

Market news & analysis
Catch up on the latest in the market and get the latest market reviews.

Trading Strategies
6 min read

Trading Strategies
5 min read

Trading Strategies
6 min read

Economic Indicator
7 min read
Trading Strategies
8 min read

Trading Strategies
8 min read

Trading Strategies
5 min read
Dark Cloud Cover Pattern: Complete Trading Guide
09 Jan, 2026

Trading Strategies
7 min read
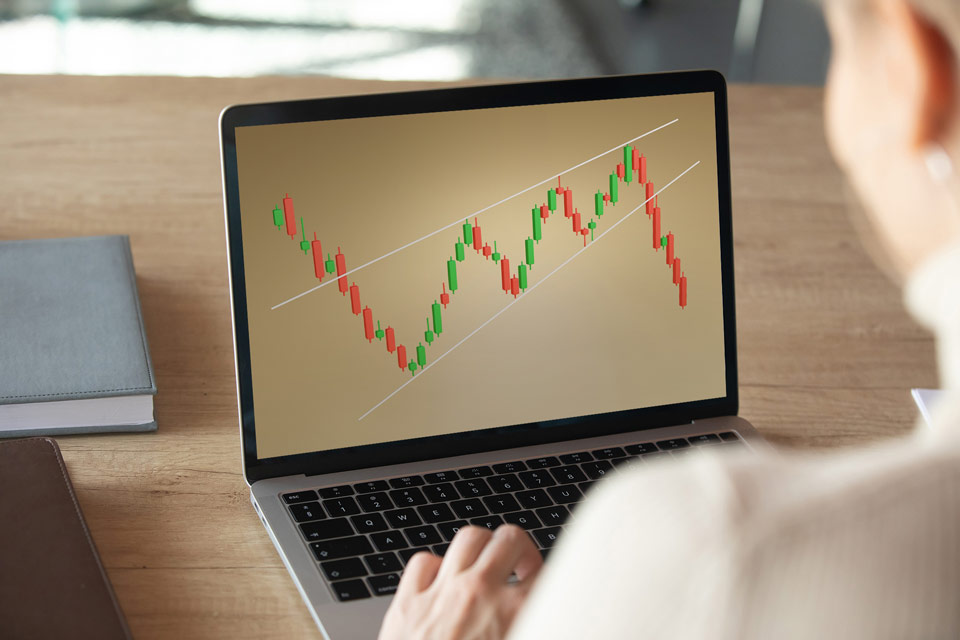
Triangle Pattern Trading: Master Technical Analysis
08 Jan, 2026
Trading Strategies
8 min read
Harmonic Trading Patterns
08 Jan, 2026

Trading Strategies
8 min read
What is a golden cross in trading?
08 Jan, 2026

Forex
10 min read
Top forex chart patterns to know in 2026
26 Dec, 2025
Trading Strategies
8 min read

Trading Strategies
5 min read

Trading Strategies
7 min read

Trading Strategies
10 min read

Shares
6 min read
Spotlight on Deepseek stock: What to expect?
20 Nov, 2025

Trading Strategies
5 min read

Shares
6 min read

Commodities
5 min read
What is Commodity Money?
17 Nov, 2025

Shares
5 min read

Economic Indicator
4 min read

Economic Indicator
10 min read

Shares
8 min read

CFD
5 min read

Shares
7 min read
Your Ultimate Guide to Meme Stocks
05 Nov, 2025

Trading Strategies
6 min read
What is Paper Trading?
05 Nov, 2025
Shares
5 min read
Google Stock Split History: Everything to Know
03 Nov, 2025

TradingView
7 min read
How to Customize Charts in TradingView
30 Oct, 2025

TradingView
10 min read
Guide to Using TradingView for Forex Market Analysis
29 Oct, 2025

Trading Strategies
5 min read
What is a Bear Trap and How Does It Work?
28 Oct, 2025

Trading Strategies
5 min read
Helicopter Money: What Is It and What Does It Do?
27 Oct, 2025

CFD
10 min read
Beginner's Guide to the JEPQ stock
23 Oct, 2025

Shares
6 min read
Will EV Stocks Drive The Stock Market in The Future?
22 Oct, 2025

Trading Strategies
5 min read
What is a Dead Cat Bounce in Trading?
21 Oct, 2025

Shares
5 min read
Trading OpenAI stock: Is it Worth it?
20 Oct, 2025

Trading Strategies
5 min read
Identifying and Avoiding the Reverse Bear Trap
15 Oct, 2025

Shares
5 min read
What Are Low-float Stocks
15 Oct, 2025

Shares
3 min read
Small-Cap Stock: Features, Pros, and Cons
14 Oct, 2025

Cryptocurrencies
7 min read
Complete Beginner's Guide to Trading Meme Coins
13 Oct, 2025

Trading Strategies
8 min read

TradingView
6 min read
How to Manage the TradingView Watchlist
08 Oct, 2025

MetaTrader
8 min read
One-Click Trading on MT5: How Does it Work?
07 Oct, 2025

Trading Strategies
4 min read
How to Trade Markets During a Recession
06 Oct, 2025

Economic Indicator
8 min read
What is EBITDAR and How to Calculate it
02 Oct, 2025

Trading Strategies
10 min read
What is the RSI Divergence Indicator
01 Oct, 2025
Trading Strategies
15 min read
The Ultimate Guide to Copy Trading
30 Sep, 2025

Forex
4 min read
The Stages of a Forex Trend
29 Sep, 2025

Trading Strategies
8 min read

Trading Strategies
9 min read

Trading Strategies
8 min read
Guide to Rectangle Chart Pattern
23 Sep, 2025

Trading Strategies
4 min read
TradingView
8 min read
How to Use Heatmap in TradingView
19 Sep, 2025

MetaTrader
8 min read
How to Backtest on MT4 and MT5
18 Sep, 2025

Economic Indicator
5 min read
How to Trade FOMC Meetings?
16 Sep, 2025

Trading Strategies
8 min read
Top Long-Term Forex Strategies
15 Sep, 2025

Trading Strategies
5 min read
How to Figure Out Your Trader Personality Profile?
12 Sep, 2025

Trading Strategies
8 min read

Commodities
10 min read
Brent Crude Oil: Key Trading Strategies
10 Sep, 2025
TradingView
10 min read

Trading Strategies
10 min read
Mastering the Triple Screen Trading Strategy
05 Sep, 2025

MetaTrader
10 min read
Trading Strategies
7 min read
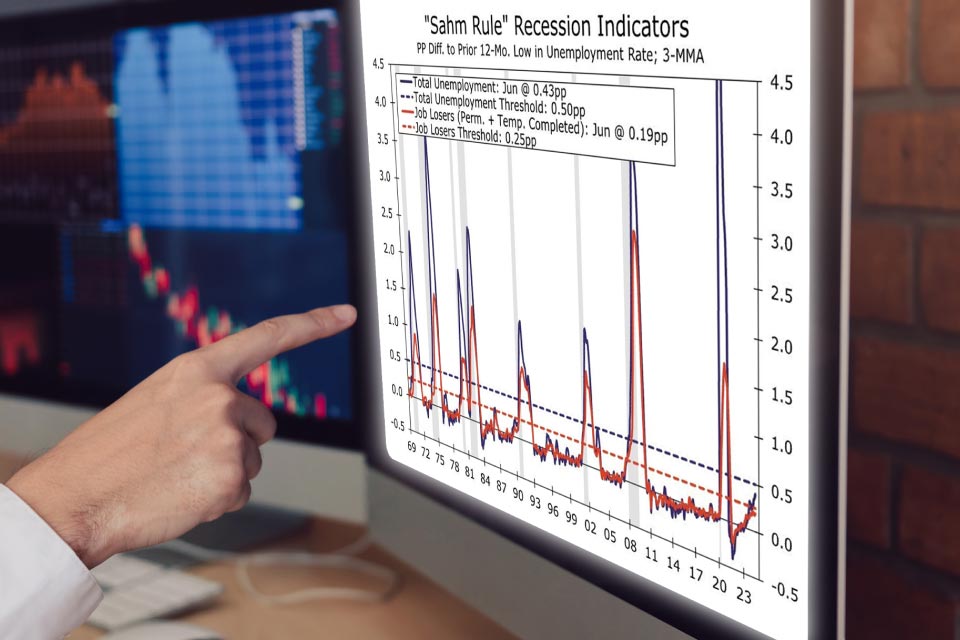
Economic Indicator
10 min read
The Sahm Rule Recession Indicator: How Does it Work?
19 Aug, 2025

Economic Indicator
7 min read

Trading Strategies
10 min read

TradingView
10 min read
What is TradingView? A Beginner's Guide
05 Aug, 2025

TradingView
4 min read
How to Set Up Your TradingView Account
04 Aug, 2025

TradingView
7 min read
How to Set Alerts on TradingView
30 Jul, 2025

Trading Strategies
6 min read

Daily Forex Analysis
8 min read

Week Ahead
8 min read
Forex Trading Week Ahead Analysis: 10th June
09 Jun, 2025

Trading Strategies
8 min read

Trading Strategies
4 min read
How to Protect Yourself From Market Reversals?
05 Mar, 2025

Economic Indicator
7 min read
US Inflation Outlook for 2025
05 Mar, 2025

Week Ahead
5 min read
Forex Week Ahead Analysis: 3rd March
03 Mar, 2025

Economic Indicator
5 min read
How to Trade the ECB Rate Decision
03 Mar, 2025

Week Ahead
5 min read
Forex Week Ahead Analysis: 24th February
24 Feb, 2025

MetaTrader
8 min read
How to Subscribe to Trading Signals on MetaTrader
20 Feb, 2025

Cryptocurrencies
8 min read
Guide to Trump Coin: Everything Traders Must Know
19 Feb, 2025

Week Ahead
8 min read
Forex Week Ahead Analysis: 17th February
17 Feb, 2025
MetaTrader
6 min read
Advanced Technical Analysis with MT5 Indicators
14 Feb, 2025

Forex
8 min read
When to Trade a Forex Cross Pair?
13 Feb, 2025
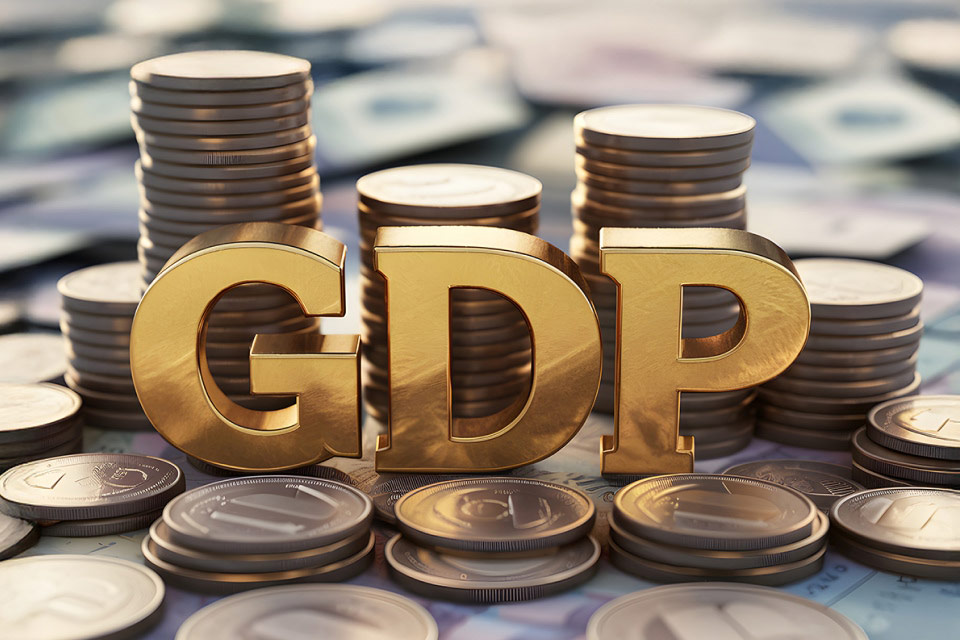
Economic Indicator
8 min read
How Can Traders Use GDP to Find Opportunities?
11 Feb, 2025

Trading Strategies
4 min read
MetaTrader
7 min read
Can You Add Scripts to MetaTrader 4?
10 Feb, 2025

Week Ahead
8 min read
Forex Week Ahead Analysis: 10th February
10 Feb, 2025

Trading Strategies
8 min read
How to Avoid Being Influenced by Recency Bias
08 Feb, 2025

Economic Indicator
5 min read
Trading Strategies
8 min read
MetaTrader
7 min read
How to Change The Volume of a Trade in MetaTrader
06 Feb, 2025
MetaTrader
6 min read
How To Create Templates In MT5
05 Feb, 2025
MetaTrader
8 min read
Mastering Chart Types in MetaTrader 5
04 Feb, 2025

Economic Indicator
7 min read

Economic Indicator
7 min read

Forex
6 min read

Week Ahead
5 min read
Forex Week Ahead Analysis: 3rd February
03 Feb, 2025

Economic Indicator
5 min read
Why European Central Bank Cut Interest Rates Again?
21 Jan, 2025

Economic Indicator
8 min read

Week Ahead
5 min read
Forex Week Ahead Analysis: 20th January
20 Jan, 2025
Trading Strategies
8 min read
Treasury Bonds vs. Treasury Notes vs. Treasury Bills
17 Jan, 2025
Commodities
8 min read

Economic Indicator
8 min read
Impact of Fed Rate Cuts on Oil Prices
13 Jan, 2025

Week Ahead
5 min read
Forex Week Ahead Analysis: 13th January
12 Jan, 2025

Economic Indicator
8 min read
Where Interest Rates Might Go In 2025?
09 Jan, 2025

Cryptocurrencies
8 min read
Top Cryptocurrency Forecasts for 2025
08 Jan, 2025

Cryptocurrencies
8 min read
Bitcoin Price Prediction For 2025: What to Expect?
07 Jan, 2025

Forex
8 min read
Forex Markets in 2025: Top Predictions
07 Jan, 2025
Commodities
5 min read
Oil Prices in 2025: What Do The Experts Say?
07 Jan, 2025

Forex
8 min read
Emerging Market Currencies to Watch
26 Dec, 2024

Forex
8 min read
Week Ahead
5 min read
Forex Week Ahead Analysis: 9th December
19 Dec, 2024

Commodities
6 min read
Will Gold Climb Higher in 2025?
19 Dec, 2024

Week Ahead
5 min read
Forex Week Ahead Analysis: 16th December
18 Dec, 2024

Economic Indicator
5 min read
Is The US Recession Coming in 2025?
17 Dec, 2024

Economic Indicator
8 min read
Is the BOJ Interest Rate Hike Coming Soon?
16 Dec, 2024

Economic Indicator
7 min read
What are Corporate Bonds?
12 Dec, 2024

Economic Indicator
5 min read
What is next for FTSE 100?
11 Dec, 2024

Commodities
5 min read
Copper Trading: Capitalizing on Global Demand
09 Dec, 2024
Economic Indicator
6 min read
What is a Treasury Bond?
06 Dec, 2024

Economic Indicator
7 min read

Commodities
5 min read
Platinum Trading: Opportunities in Precious Metals
04 Dec, 2024
Economic Indicator
5 min read
How to Trade The MSCI World Index
21 Nov, 2024

Trading Strategies
6 min read
Trading Strategies
8 min read
Simple Moving Average (SMA)
19 Nov, 2024

Cryptocurrencies
5 min read
Crypto Staking - What it is And How it Works
11 Nov, 2024
Trading Strategies
10 min read
What is Position Trading?
09 Oct, 2024

Commodities
8 min read

Trading Strategies
8 min read
Bullish and Bearish Harami Candlestick Pattern
24 Sep, 2024
Trading Strategies
8 min read
McClellan Summation Index: A Deep Dive
24 Sep, 2024

Trading Strategies
5 min read
Top Trend Following Strategies
24 Sep, 2024

Cryptocurrencies
5 min read
Trading Strategies
5 min read
Beginner's Guide to Quantitative Trading
24 Sep, 2024

Cryptocurrencies
5 min read
Crypto Day Trading: Top Strategies
24 Sep, 2024
Trading Strategies
7 min read
Trading Strategies
8 min read
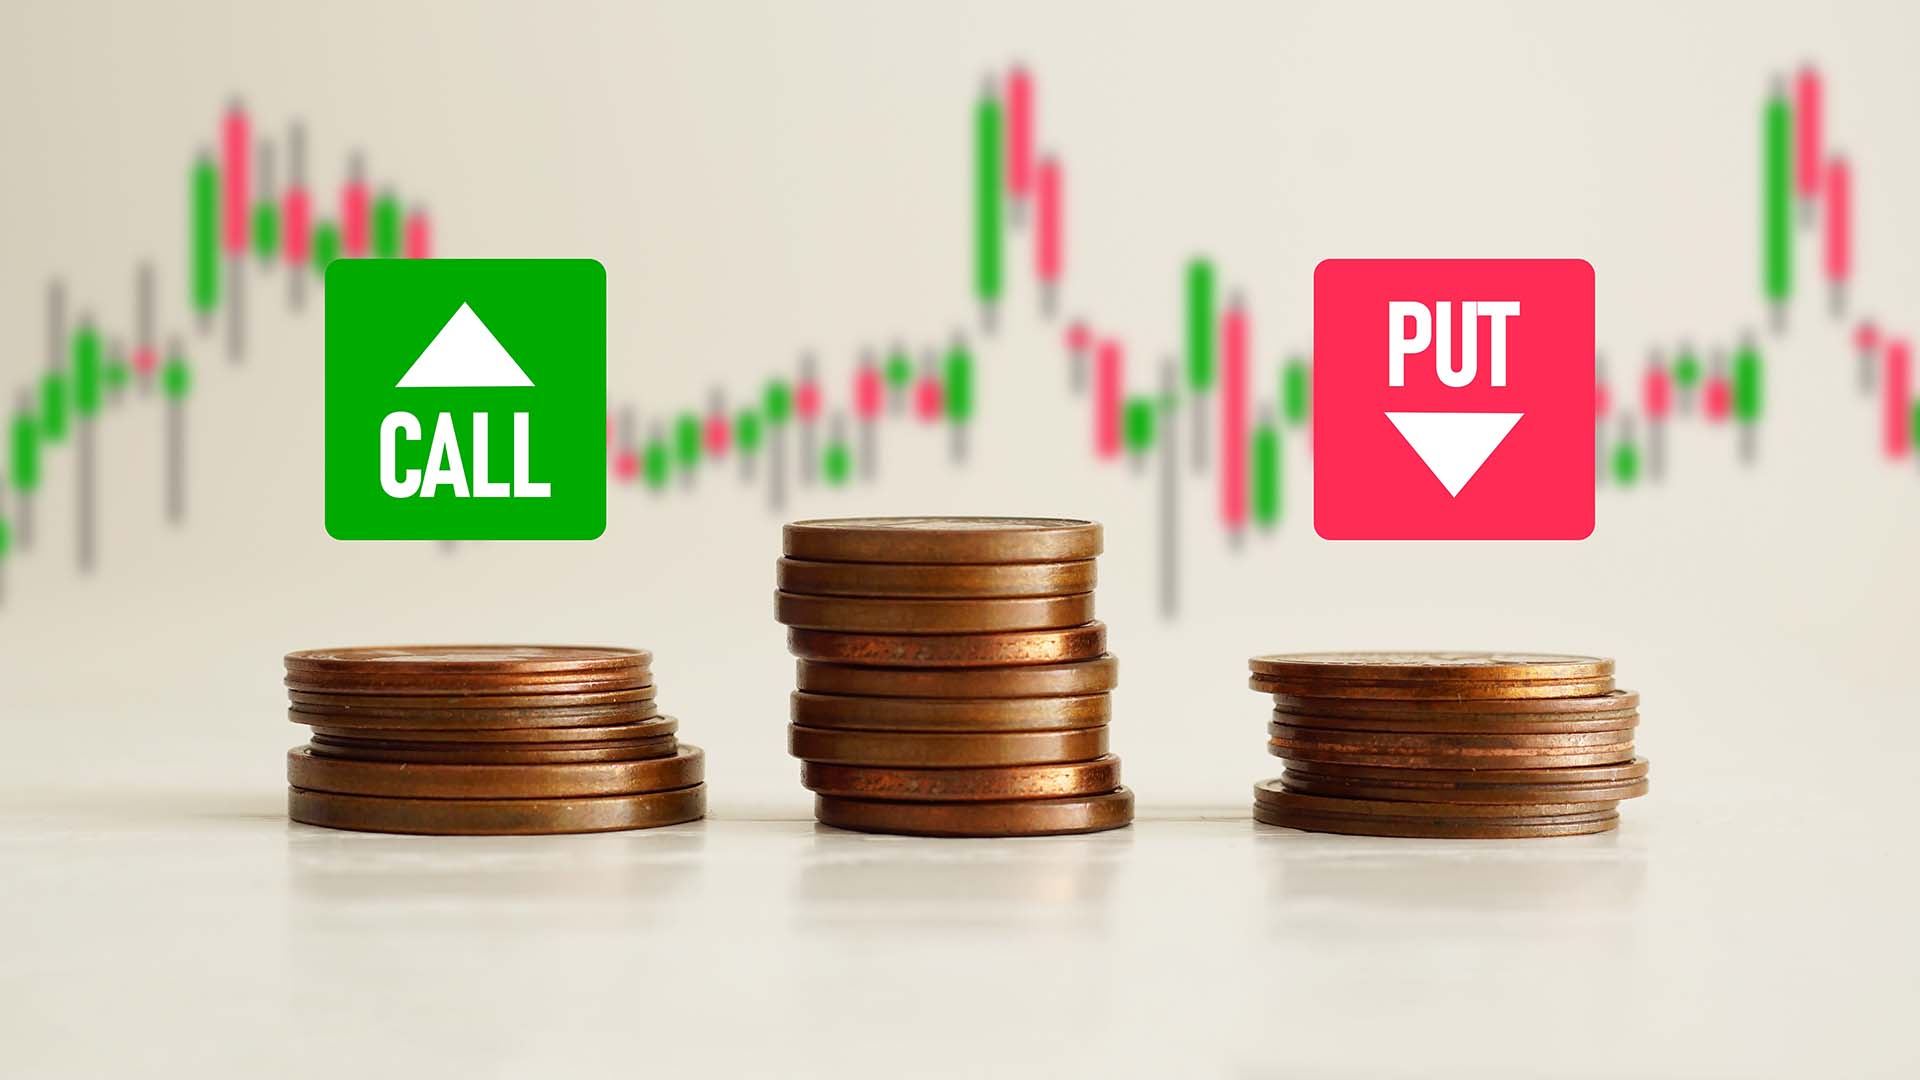
How to Use Put/Call Ratio to Gauge Market Sentiment
24 Sep, 2024
Economic Indicator
8 min read
Rate of Change (ROC) Indicator Explained
24 Sep, 2024
Forex
8 min read
Strategies for Trading Volatile Forex Pairs
24 Sep, 2024
Trading Strategies
6 min read
Trading Strategies
8 min read
Buy and Hold: The Long-Term Trading Strategy
23 Sep, 2024
Trading Strategies
8 min read
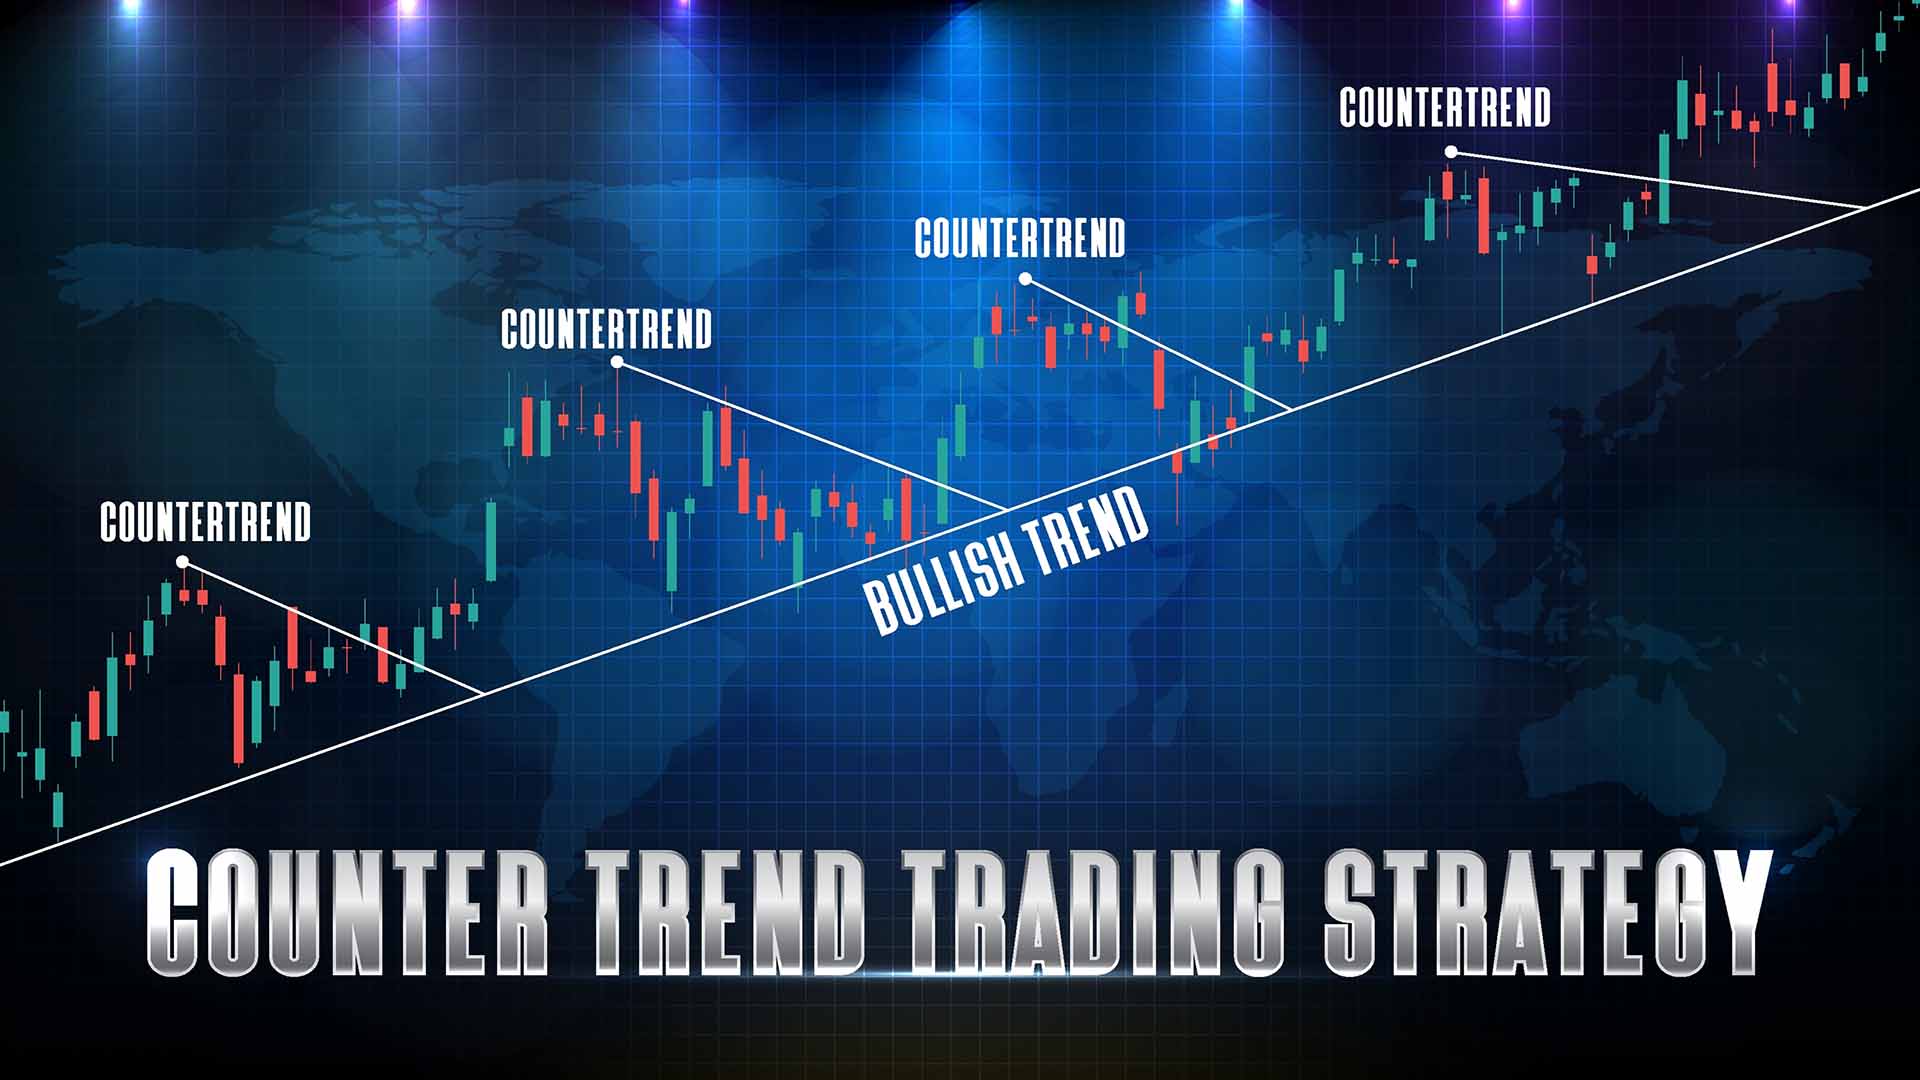
Counter-Trend Trading: Strategies and Tips
23 Sep, 2024

Cryptocurrencies
5 min read
How to Use HODLing: The Long-Term Crypto Strategy
23 Sep, 2024

Trading Strategies
5 min read
Protective Put Strategy: The Complete Guide
23 Sep, 2024

Trading Strategies
5 min read

Economic Indicator
5 min read
Dollar Retreats Ahead of US Jobs Report Looms
23 Sep, 2024

Trading Strategies
8 min read
Trading Strategies
5 min read
Technical Indicator Composites: The Complete Guide
23 Sep, 2024

Trading Strategies
6 min read
What is a Covered Call Options Strategy?
23 Sep, 2024

Forex
8 min read
What is a Take-Profit Order?
20 Sep, 2024

Forex
8 min read
How to Build Your Own Crypto Trading Strategy
19 Sep, 2024

Cryptocurrencies
5 min read
How to Create a Crypto Trading Journal
19 Sep, 2024
Cryptocurrencies
3 min read
How to Use Fundamental Analysis for Crypto Trading
19 Sep, 2024
Trading Strategies
5 min read
Trading Strategies
8 min read
Seasonal Trading: The Complete Guide
19 Sep, 2024
Trading Strategies
8 min read
Butterfly Pattern Trading: A Comprehensive Guide
18 Sep, 2024

Trading Strategies
5 min read
Guide to Rounding Bottom Pattern
18 Sep, 2024

Commodities
Trading Strategies
8 min read
M Trading Pattern: Master Double Top Strategy
18 Sep, 2024
Trading Strategies
5 min read
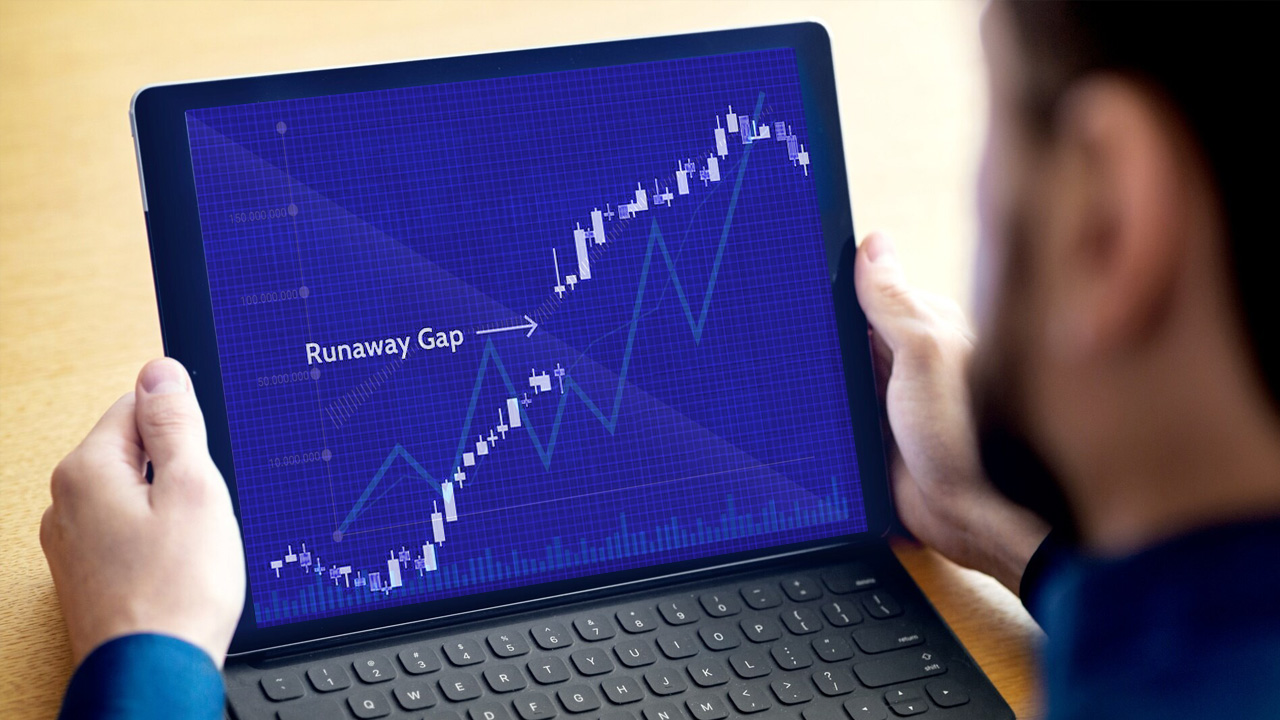
Runaway Gap: Identifying and Trading Trends
18 Sep, 2024

Trading Strategies
8 min read
Top Indicators for Swing Trading
18 Sep, 2024

Trading Strategies
5 min read
Trading the Engulfing Pattern: Bullish & Bearish
18 Sep, 2024
Trading Strategies
5 min read
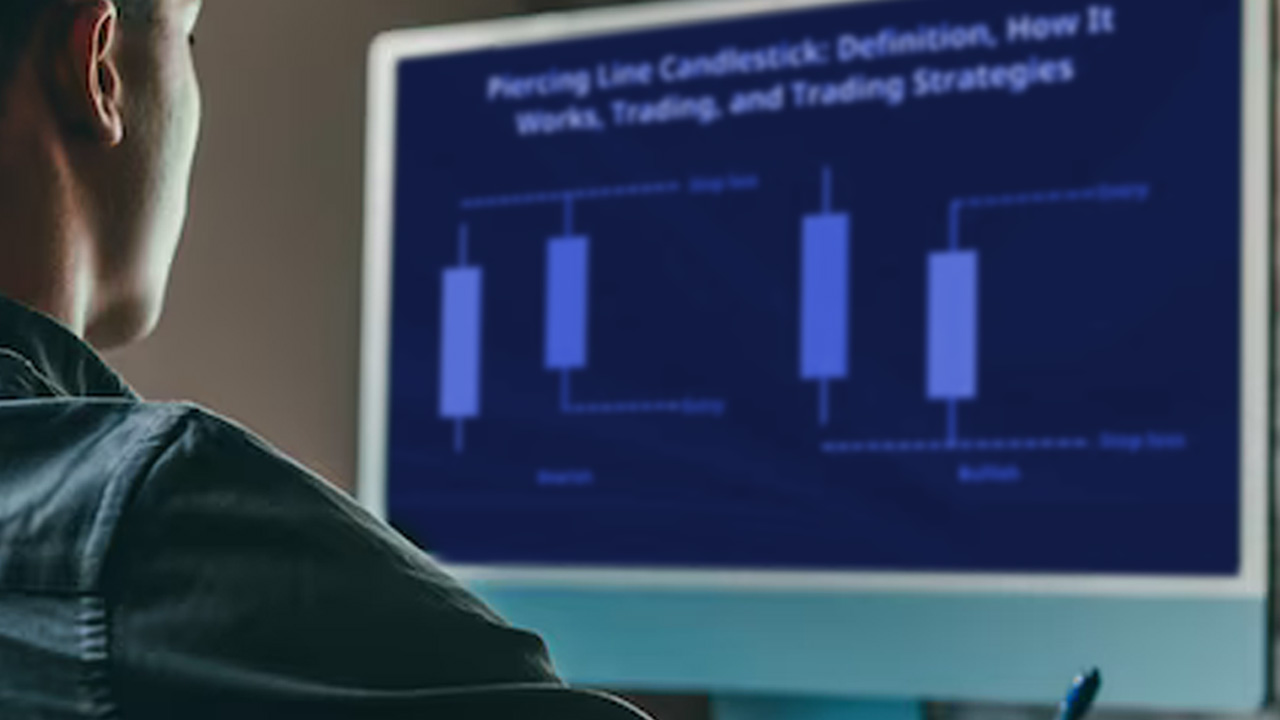
Trading the Piercing Line Pattern: A Quick Guide
18 Sep, 2024

Trading Strategies
8 min read

Forex
7 min read

Forex
5 min read

Commodities
5 min read
Gold Prices Falling After a Period of Strong Growth
18 Sep, 2024

Trading Strategies
5 min read
Questions to Ask When Trading Trends
18 Sep, 2024

Trading Strategies
8 min read
Top Ways to Minimize Missed Trades
18 Sep, 2024
Commodities
7 min read
USD to Range-Bound Amidst Central Bank Speculation
18 Sep, 2024

Trading Strategies
10 min read
Top Market Breadth Indicators
16 Sep, 2024
Trading Strategies
8 min read
Trading Wedge Pattern: A Comprehensive Guide
16 Sep, 2024

Week Ahead
5 min read
Forex Trading Week Ahead: 16th September
16 Sep, 2024
Trading Strategies
5 min read
Custom Oscillators To Personalizing Your Trading
10 Sep, 2024

Trading Strategies
8 min read
Forex Cycles Analysis: Timing Market Movements
10 Sep, 2024

Week Ahead
5 min read
Forex Trading Week Ahead: 9th September
09 Sep, 2024

Forex
5 min read

Economic Indicator
5 min read
Trading the Russell 2000: Everything You Should Know
05 Sep, 2024
Trading Strategies
5 min read
Pairs Trading: How to Use it For Hedging
05 Sep, 2024

Economic Indicator
5 min read
Trading Strategies
8 min read
Exhaustion Gap: How to Trade the Final Push
04 Sep, 2024
Trading Strategies
5 min read
Understanding Common Gap in Trading
04 Sep, 2024

Daily Forex Analysis
5 min read
British Pound Reversal
29 Aug, 2024

Week Ahead
5 min read
Forex Trading Week Ahead: 26th August
26 Aug, 2024

Week Ahead
5 min read
Forex Week Ahead Analysis: 26th August
26 Aug, 2024
Daily Forex Analysis
3 min read
How to trade GBP/JPY
22 Aug, 2024

Daily Forex Analysis
5 min read
Gold Makes New Highs
21 Aug, 2024

Week Ahead
5 min read
Forex Weekly Trading Ideas: 19th August
19 Aug, 2024
Week Ahead
5 min read
Forex Weekly Trading Ideas: 19th August (1)
19 Aug, 2024

Daily Forex Analysis
5 min read
Why are retail traders wrong?
19 Aug, 2024

Daily Forex Analysis
8 min read
GBP Rallies Despite Unemployment Claims Shock
14 Aug, 2024

Week Ahead
5 min read
Forex Weekly Trading Ideas: 12th August
12 Aug, 2024

CFD
5 min read

Shares
6 min read
Top Market Predictions for Q3 2024
07 Aug, 2024

Commodities
3 min read
Gold Trends for Q3 2024: What to Expect?
07 Aug, 2024
Daily Forex Analysis
2 min read
Daily Forex Analysis
5 min read
Correction or Recession?
05 Aug, 2024

Week Ahead
8 min read
Weekly Forex Trading Ideas- 5th August
05 Aug, 2024
Daily Forex Analysis
5 min read
What a week to be a forex trader
02 Aug, 2024

Cryptocurrencies
8 min read
How to Use Technical Analysis When Trading Crypto
02 Aug, 2024
Trading Strategies
10 min read
How to Use The Umbrella Pattern Trading
01 Aug, 2024
Trading Strategies
10 min read
Dragon Pattern Trading: A Comprehensive Guide
29 Jul, 2024
Trading Strategies
8 min read
How to Use The Megaphone Trading Pattern
29 Jul, 2024
Week Ahead
8 min read
Forex Weekly Trading Ideas: 29th July
29 Jul, 2024

Trading Strategies
8 min read
Managing Emotions in High-Stakes Trading
29 Jul, 2024

Trading Strategies
4 min read
How to Overcome the Fear of Losing Your Gains
29 Jul, 2024

Daily Forex Analysis
5 min read
Weekly Forex Trading Ideas: 29th July
29 Jul, 2024
Daily Forex Analysis
8 min read
How To Trade USD/CAD: 24th July
25 Jul, 2024
Cryptocurrencies
8 min read
How to Read Crypto Charts?
24 Jul, 2024

Trading Strategies
4 min read
How to Create a Trading Strategy
24 Jul, 2024
MetaTrader
7 min read
Can You Set Up Expert Advisors In Metatrader 4?
23 Jul, 2024

Week Ahead
5 min read
Forex Weekly Trading Ideas: 22nd July
21 Jul, 2024

Daily Forex Analysis
6 min read
How To Trade CoT Reports
17 Jul, 2024
MetaTrader
12 min read
How to Place a Trade on MT5
17 Jul, 2024
Week Ahead
5 min read
Forex Weekly Trading Ideas: 15th July
14 Jul, 2024

Daily Forex Analysis
10 min read
How to Achieve Consistent Wins in Forex Trading
12 Jul, 2024

Daily Forex Analysis
8 min read
Why Trading With Data Matters
10 Jul, 2024

Week Ahead
8 min read
Weekly Forex Trading Ideas: 8th July
07 Jul, 2024

Cryptocurrencies
8 min read
Top Indicators for Crypto Trading
05 Jul, 2024

Daily Forex Analysis
8 min read
Gold Finds Support Amid Rising Risk Events
04 Jul, 2024

Cryptocurrencies
8 min read
Effective Risk Management in Crypto Trading
02 Jul, 2024

Cryptocurrencies
8 min read
Trading Strategies
8 min read
How to Setup the Perfect Trading Routine?
28 Jun, 2024

Trading Strategies
8 min read
How to Handle Trading Slumps
28 Jun, 2024

MetaTrader
8 min read
How to Set a Trailing Stop-Loss on MT5?
28 Jun, 2024

Cryptocurrencies
8 min read
How to Choose Optimal Time Frames for Crypto Trading
28 Jun, 2024

Cryptocurrencies
8 min read
Should You Trade Cryptocurrency on The Weekends?
27 Jun, 2024

MetaTrader
8 min read
How to Change Time Frames on MT5
27 Jun, 2024
MetaTrader
10 min read
How to Install Expert Advisors on MT5
27 Jun, 2024

Daily Forex Analysis
8 min read
Don't Trade EUR/AUD Until You See This
26 Jun, 2024

Commodities
8 min read
How Do Oil Prices Affect the Stock Market?
26 Jun, 2024

Trading Strategies
8 min read
What Is Implied Volatility & Factors Affecting it?
26 Jun, 2024
Forex
8 min read

MetaTrader
8 min read
How to Create a Demo Account on MT5
24 Jun, 2024
Week Ahead
8 min read
Weekly Forex Trading Ideas: 24th June
23 Jun, 2024
Daily Forex Analysis
8 min read
How CoT Reports Could Predict a CAD Rally
19 Jun, 2024

Week Ahead
8 min read
Weekly Forex Trading Analysis: 17th June-21st June
16 Jun, 2024
Forex
6 min read

MetaTrader
6 min read
How To Use MetaTrader 5 Mobile App
07 Jun, 2024
Trading Strategies
8 min read
How to Use a Risk-Reward Calculator
06 Jun, 2024
Trading Strategies
8 min read
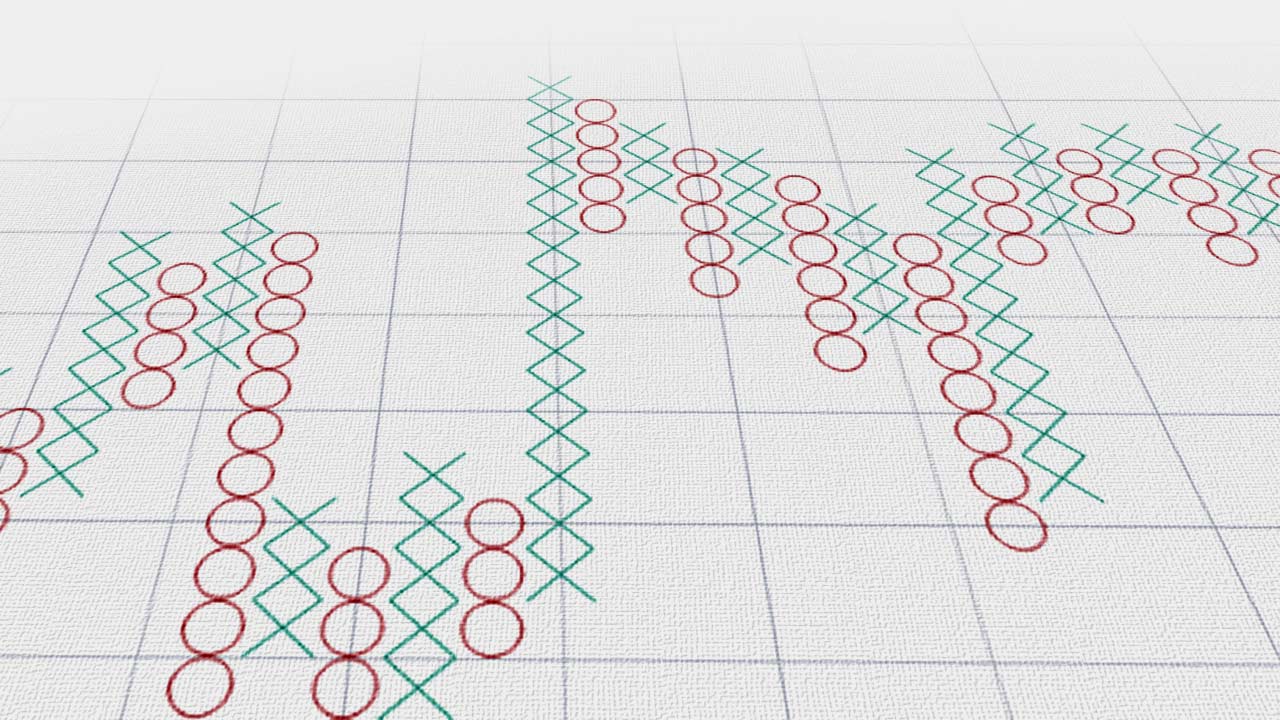
How to Trade With Point-and-Figure (P&F) Charts?
06 Jun, 2024
Trading Strategies
5 min read
Daily Forex Analysis
8 min read
ECB Poised to Cut Interest Rates
05 Jun, 2024

Trading Strategies
8 min read
How to Keep Trading Overconfidence in Check
05 Jun, 2024

Trading Strategies
8 min read
How To Find A Trading Style That Suits You
04 Jun, 2024
Forex
8 min read
How Forex Brokers Manage Risks
03 Jun, 2024
Week Ahead
9 min read
Forex Trading Week Ahead: 3rd June
02 Jun, 2024
Trading Strategies
8 min read
How to Use Pivot Points for Range Trading
30 May, 2024
Trading Strategies
6 min read

Daily Forex Analysis
5 min read
Donald Trump Found Guilty- FX Unchanged
30 May, 2024
Daily Forex Analysis
Why Silver is the Undervalued Commodity
29 May, 2024

Forex
7 min read
5 Exit Strategies To Consider in Forex Trading
28 May, 2024

Forex
EUR/USD Price Forecast 2024: What to Expect
28 May, 2024

MetaTrader
8 min read
Trading Cryptocurrencies with MetaTrader 5
28 May, 2024
Daily Forex Analysis
GBP/USD Spikes as UK Inflation Declines to 2.3%
22 May, 2024
Daily Forex Analysis
4 min read

Economic Indicator
7 min read
What is a Floating Exchange Rate?
17 May, 2024
Trading Strategies
6 min read
How to Backtest a Trading Strategy?
17 May, 2024
Forex
6 min read
How to Trade the EUR/CHF
16 May, 2024

Forex
8 min read
How to Trade GBP/CAD?
16 May, 2024
Daily Forex Analysis
3 min read
US CPI: A Market Letdown and Its Implications
15 May, 2024
Daily Forex Analysis
2 min read
Insights Ahead of US CPI Release
14 May, 2024
Daily Forex Analysis
5 min read
Sell In May and Go Away
08 May, 2024

Trading Strategies
5 min read
How do Bank Holidays Affect Trading Prices?
02 May, 2024

Economic Indicator
6 min read
How Does The FOMC Affect The Market?
02 May, 2024

Forex
8 min read
How to Trade AUD/JPY
02 May, 2024

Trading Strategies
3 min read
How to Bounce Back From a Blown Trading Account
02 May, 2024
Trading Strategies
10 min read
How to Use The Dragonfly Doji Candlestick Pattern?
02 May, 2024

Daily Forex Analysis
5 min read
To Trade or Fade USDCAD?
29 Apr, 2024

Week Ahead
5 min read
Forex Week Ahead Analysis: 29th April
28 Apr, 2024
Trading Strategies
5 min read
What is the ICT trading strategy?
26 Apr, 2024
Forex
5 min read
What is a Lot in Forex?
26 Apr, 2024
Daily Forex Analysis
5 min read
USDJPY: Can Price Go Any Higher?
24 Apr, 2024

Week Ahead
5 min read
Forex Week Ahead Analysis: 22nd April
21 Apr, 2024

Trading Strategies
5 min read

Trading Strategies
8 min read
Reasons Why New Traders Give up Too Early
19 Apr, 2024
Daily Forex Analysis
3 min read
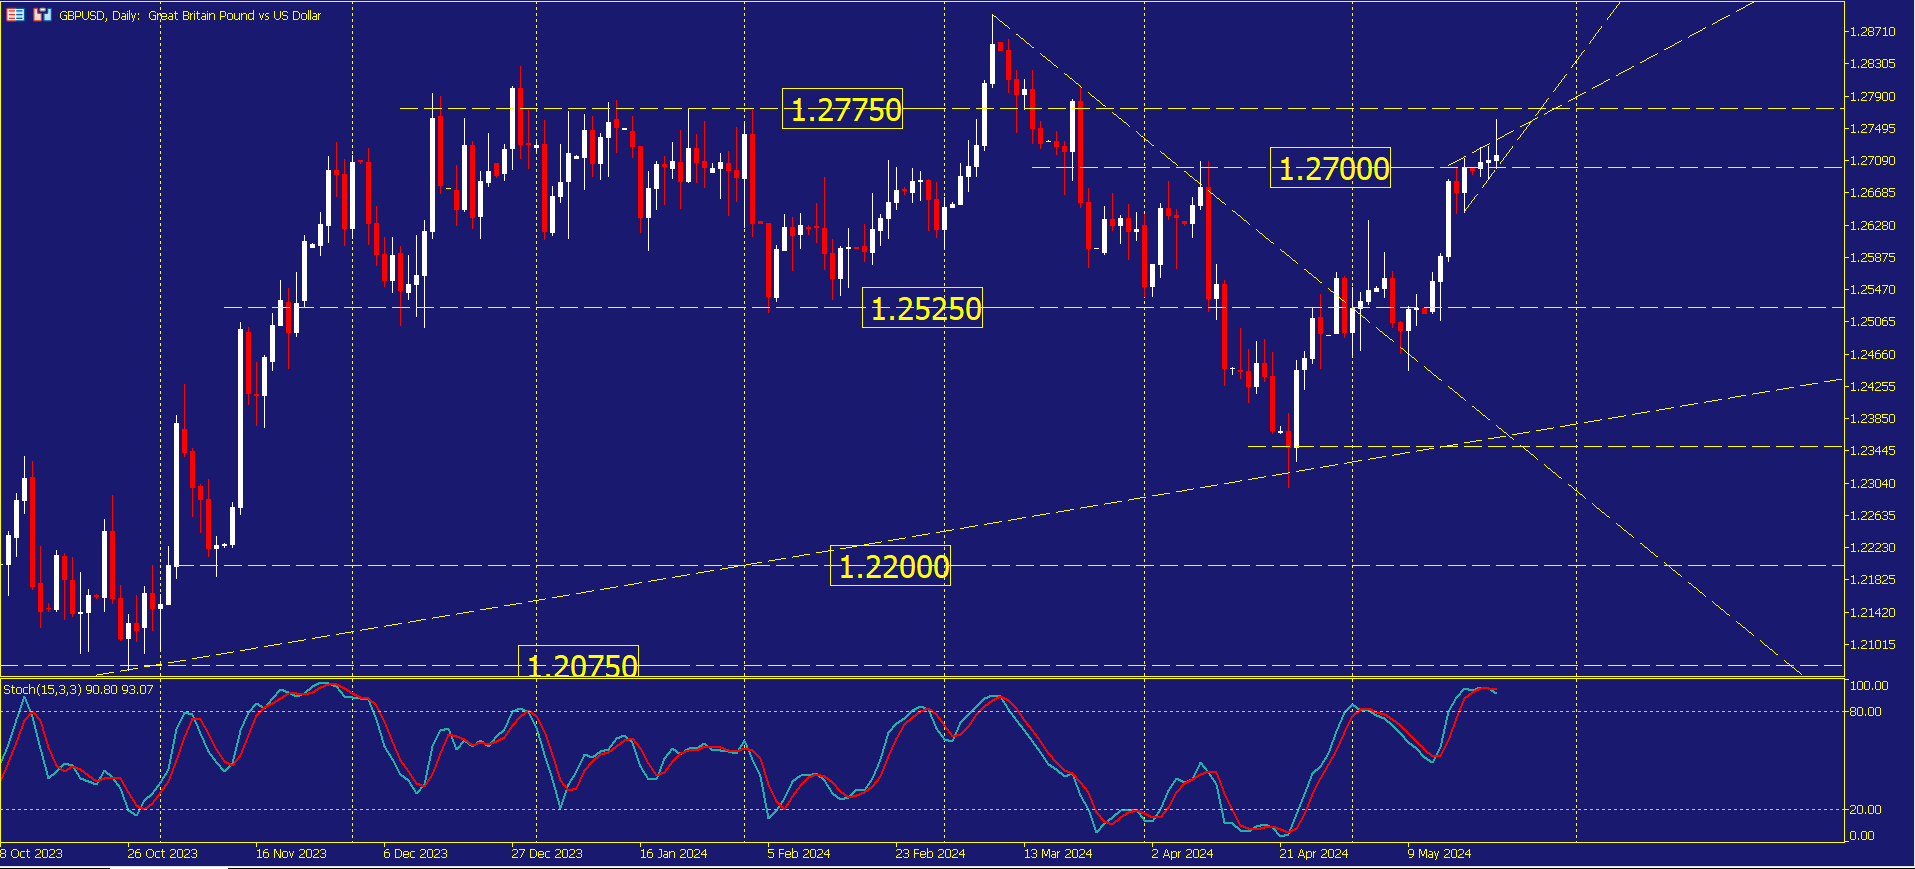
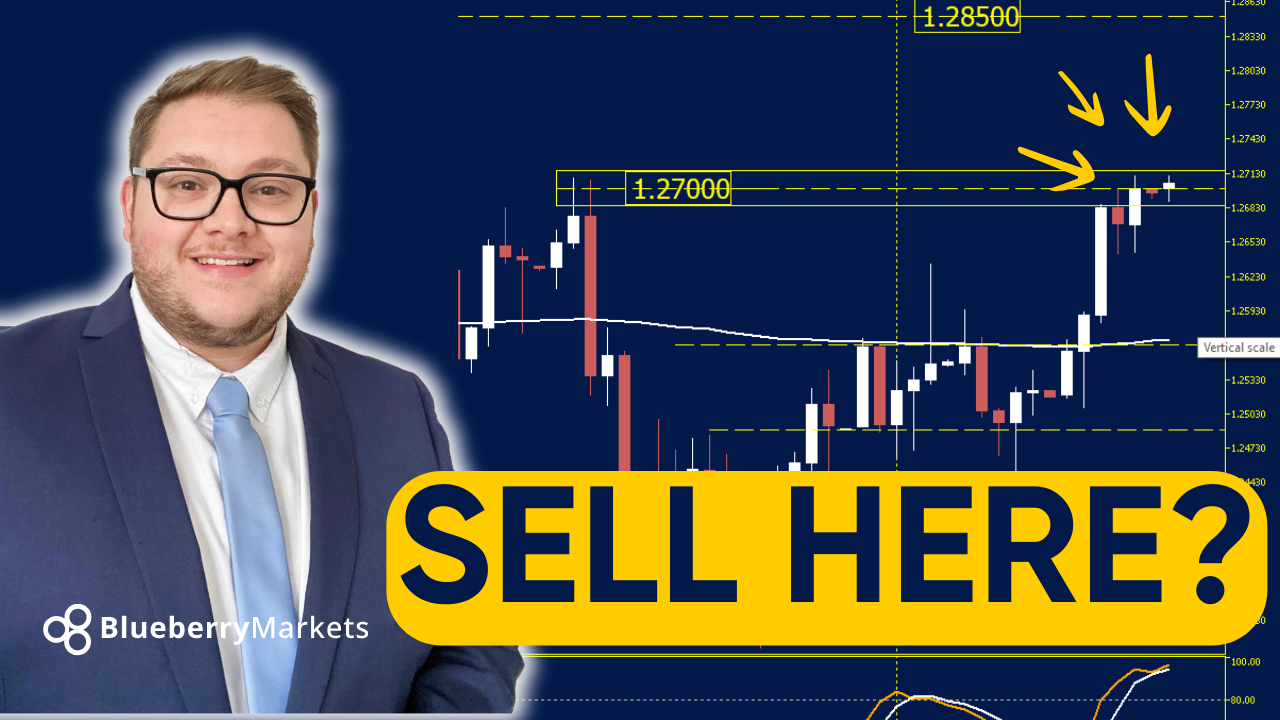
GBPUSD Traders Be Aware
17 Apr, 2024

Economic Indicator
8 min read
Trading Strategies
5 min read
How to Overcome Trading Anxiety
16 Apr, 2024

Economic Indicator
8 min read
Top Financial Regulatory Bodies in Europe
16 Apr, 2024
Daily Forex Analysis
5 min read

Forex
8 min read
How to Prepare Your Taxes as a Forex Trader in 2024
15 Apr, 2024
Week Ahead
8 min read
Forex Week Ahead Analysis: 15th April
14 Apr, 2024
Daily Forex Analysis
2 min read

Week Ahead
3 min read
Forex Week Ahead Analysis: 8th April
08 Apr, 2024
Daily Forex Analysis
3 min read
Trading Strategies
5 min read
5 Ways to Start Forex Trading As a Beginner
02 Apr, 2024
Week Ahead
3 min read
Forex Week Ahead Analysis: 1st April
01 Apr, 2024
Daily Forex Analysis
3 min read
Understanding Japan's Stance on JPY Weakening
27 Mar, 2024
Daily Forex Analysis
3 min read
WTI Crude Oil Set to Trade to $100.00?
26 Mar, 2024
Daily Forex Analysis
3 min read
Navigating the Forex Markets: A Quieter Week Ahead
25 Mar, 2024
Daily Forex Analysis
3 min read
How To Trade GBPUSD Fundamentals
21 Mar, 2024
Daily Forex Analysis
3 min read
USD In Focus Ahead Of Fed Announcement
20 Mar, 2024
MetaTrader
5 min read
Week Ahead
3 min read
Forex Week Ahead Analysis: 18th March
18 Mar, 2024
Forex
3 min read
Common Mistakes to Avoid When Making Forex Deposits
18 Mar, 2024

Forex
5 min read

Forex
5 min read
Why Do Forex Brokers Charge Commission Fees?
13 Mar, 2024
Trading Strategies
6 min read
Top Gap Trading Strategies
12 Mar, 2024

Forex
4 min read
Demo Accounts: Setting Goals and Establishing Rules
12 Mar, 2024
Daily Forex Analysis
4 min read

Week Ahead
5 min read
Forex Week Ahead Analysis: 11th March
11 Mar, 2024

Trading Strategies
5 min read
How to Trade Inside Days
08 Mar, 2024

Trading Strategies
5 min read
Passive vs Active Trading: What's the Difference?
08 Mar, 2024
Daily Forex Analysis
5 min read
Is EURUSD Bullish In 2024?
06 Mar, 2024

Forex
3 min read
What are Speed Resistance Lines?
05 Mar, 2024

Trading Strategies
8 min read
What is The Aroon Indicator?
05 Mar, 2024
Forex
8 min read
Yield Curve: What it is and How to Use it
05 Mar, 2024

Forex
10 min read
How to Trade USD/MXN Currency Pair
05 Mar, 2024

Forex
10 min read
Forex
5 min read
What Are Price Charts (And How to Use Them?)
05 Mar, 2024

Forex
8 min read
What is the Linear Regression Slope?
05 Mar, 2024

Trading Strategies
3 min read
How to Trade with CCI Indicator
04 Mar, 2024

MetaTrader
8 min read
How to Start Trading on MetaTrader 4 with Robots
04 Mar, 2024

Economic Indicator
8 min read
How Does Supply and Demand Affect Markets?
04 Mar, 2024

Trading Strategies
8 min read
What is the Raff Channel Indicator?
04 Mar, 2024
Week Ahead
5 min read
Forex Week Ahead Analysis: 4th March
03 Mar, 2024
Daily Forex Analysis
5 min read
Bitcoin Soars as New ETFs Drive Record Trades
29 Feb, 2024
Daily Forex Analysis
5 min read
Tips For Trading Gold
27 Feb, 2024
Week Ahead
5 min read
Forex Week Ahead Analysis: 26th February
25 Feb, 2024

Trading Strategies
6 min read
What is an Emerging Market?
21 Feb, 2024

Daily Forex Analysis
5 min read
AUDJPY In Focus Ahead Of RBA Meeting Minutes
19 Feb, 2024

Forex
5 min read
What to do With Big Wins as a Forex Trader?
19 Feb, 2024
Week Ahead
8 min read
Trading Strategies
6 min read
5 Key Strategies for Advanced Technical Analysis
16 Feb, 2024
Trading Strategies
10 min read
What is the Hidden Divergence Trading Strategy?
15 Feb, 2024
Trading Strategies
5 min read
What is the 5-3-1 Trading Strategy in Forex?
15 Feb, 2024

Trading Strategies
8 min read
How to Set Realistic Trading Goals
14 Feb, 2024

Trading Strategies
5 min read
Daily Forex Analysis
5 min read
Will Gold Prices Fall Further?
14 Feb, 2024
Trading Strategies
8 min read
Five Trading Strategies For a Highly Volatile Market
13 Feb, 2024
4 min read
How to Build Flexibility in Forex Trading
13 Feb, 2024
MetaTrader
7 min read
How to Check Your Trade History in MT5?
13 Feb, 2024

Forex
5 min read

Forex
7 min read
Why Forex Traders Should Use a Risk Calculator
13 Feb, 2024

Trading Strategies
5 min read
How to Combine Trading Strategies
12 Feb, 2024

Forex
5 min read
How and When to Buy or Sell in Forex Trading
12 Feb, 2024

Forex
8 min read
How to Trade Low Volatility Markets?
12 Feb, 2024

Week Ahead
8 min read
Forex Week Ahead Analysis: 12th Feb
11 Feb, 2024
Daily Forex Analysis
3 min read
Have Traders Spotted This Forex Breakout?
07 Feb, 2024
Daily Forex Analysis
7 min read
A Blueprint to Consistency in Forex Trading
05 Feb, 2024

Week Ahead
5 min read
Daily Forex Analysis
3 min read
USD Index Key Levels
31 Jan, 2024
Daily Forex Analysis
3 min read
Don't Trade GBP/AUD Until You See This
29 Jan, 2024

Week Ahead
8 min read
Forex Week Ahead Analysis: 27th January
28 Jan, 2024
Week Ahead
8 min read
Forex Week Ahead Analysis: 29th Jan
28 Jan, 2024
Forex
8 min read
Three-Bar Reversal Pattern For Day Trading
26 Jan, 2024

Trading Strategies
5 min read
What is the Retail Sales Index?
26 Jan, 2024
Forex
6 min read
A Forex Trader's Guide to Federal Reserve Bank
26 Jan, 2024

Forex
8 min read
How to Trade the EUR/JPY Currency Pair?
26 Jan, 2024

Trading Strategies
8 min read
How Trading Competitions Work?
26 Jan, 2024

Cryptocurrencies
8 min read
The Year Ahead: Top Crypto Predictions for 2024
26 Jan, 2024

Forex
6 min read
What Are Competitive Spreads?
26 Jan, 2024
Daily Forex Analysis
3 min read
EURJPY What Next? | Price Action Trading
24 Jan, 2024
Daily Forex Analysis
5 min read
Is This The NEXT Trending Forex Pair?
22 Jan, 2024

Week Ahead
8 min read
MetaTrader
6 min read
How to Download Historical Data on MT4
17 Jan, 2024

Economic Indicator
6 min read
What is the Consumer Sentiment Index?
17 Jan, 2024
Daily Forex Analysis
5 min read
Will This Market Crash?
17 Jan, 2024

Economic Indicator
JPY Forecast For 2024
15 Jan, 2024

Economic Indicator
5 min read
Daily Forex Analysis
3 min read
Where Is The Bitcoin Price Heading Now?
15 Jan, 2024

Week Ahead
5 min read
Daily Forex Analysis
5 min read
Price Action Trading In Forex
10 Jan, 2024
Forex
8 min read
Top Triangle Chart Patterns
09 Jan, 2024

Commodities
8 min read
Gold Price Forecast For 2024
09 Jan, 2024
Economic Indicator
5 min read

Forex
10 min read
What is Leverage in Forex?
09 Jan, 2024

Forex
2 min read
How To Predict Forex Movements?
08 Jan, 2024

Forex
5 min read
What is The Tick Volume Indicator?
08 Jan, 2024
Daily Forex Analysis
5 min read
Forex Traders Alert! EURGBP Technical Analysis
08 Jan, 2024

Forex
7 min read

Trading Strategies
8 min read

Week Ahead
5 min read
Daily Forex Analysis
5 min read
Economic Indicator
5 min read
Forex Economic Calendar 2024: What to Watch
02 Jan, 2024
Shares
10 min read
Popular Stocks to Start Your 2024 Out Strong
02 Jan, 2024

Week Ahead
5 min read
Trading Strategies
8 min read
How to Avoid Stop-Loss Hunting?
27 Dec, 2023

Forex
8 min read
Helpful Tips For Forex Trading Newbies
27 Dec, 2023

Forex
8 min read
How to Trade AUD/USD?
27 Dec, 2023
Forex
8 min read
How to Use a Forex Demo Account for Practice?
27 Dec, 2023

Trading Strategies
5 min read
How to Manage Currency Exposure in Your Portfolio?
26 Dec, 2023
MetaTrader
8 min read
Trading with MetaTrader's Forex Volume Indicator
26 Dec, 2023
Trading Strategies
5 min read
What is Drawdown in Forex Trading?
26 Dec, 2023

Forex
8 min read

Forex
8 min read

Forex
5 min read
Why Does the BoJ Intervene in the Forex Markets?
26 Dec, 2023
Trading Strategies
5 min read

Trading Strategies
8 min read
Top Trading Strategies For GBP/USD
20 Dec, 2023

Economic Indicator
5 min read
Daily Forex Analysis
4 min read
How To Find Better Forex Trading Levels
18 Dec, 2023
Economic Indicator
5 min read
2024 Economy And Stock Market Predictions
15 Dec, 2023
Trading Strategies
5 min read
How to Trade a Short Squeeze?
15 Dec, 2023
Forex
3 min read
How Bond Yields Affect Currency Movements in Forex?
15 Dec, 2023

Partnership
8 min read

Cryptocurrencies
5 min read
How to Invest in Crypto Without Buying Crypto?
15 Dec, 2023
Trading Strategies
4 min read
How To Set A Stop-Loss Based On Price Volatility?
15 Dec, 2023

Forex
8 min read
Is Forex Trading Halal or Haram?
14 Dec, 2023
Cryptocurrencies
4 min read
How To Cautiously Trade Cryptocurrencies?
13 Dec, 2023
Daily Forex Analysis
5 min read
How To Be A Better Forex Trader
13 Dec, 2023

Partnership
3 min read

Trading Strategies
8 min read
What is The Marubozu Candlestick Pattern?
11 Dec, 2023

Economic Indicator
5 min read
What is The Petrodollar?
11 Dec, 2023
Trading Strategies
4 min read
How to Know When to Close a Trade
11 Dec, 2023

Forex
8 min read
What is the Risk-Reward Ratio?
11 Dec, 2023
Daily Forex Analysis
3 min read

Partnership
5 min read
What is an Introducing Broker (IB)?
24 Nov, 2023
Forex
3 min read
How to Calculate Lot Size in Forex?
23 Nov, 2023

Economic Indicator
8 min read
How Do Unemployment Rates Affect The Forex Market?
23 Nov, 2023

Forex
3 min read
4 Big Mistakes Traders Make When Setting Stops
23 Nov, 2023

Forex
5 min read
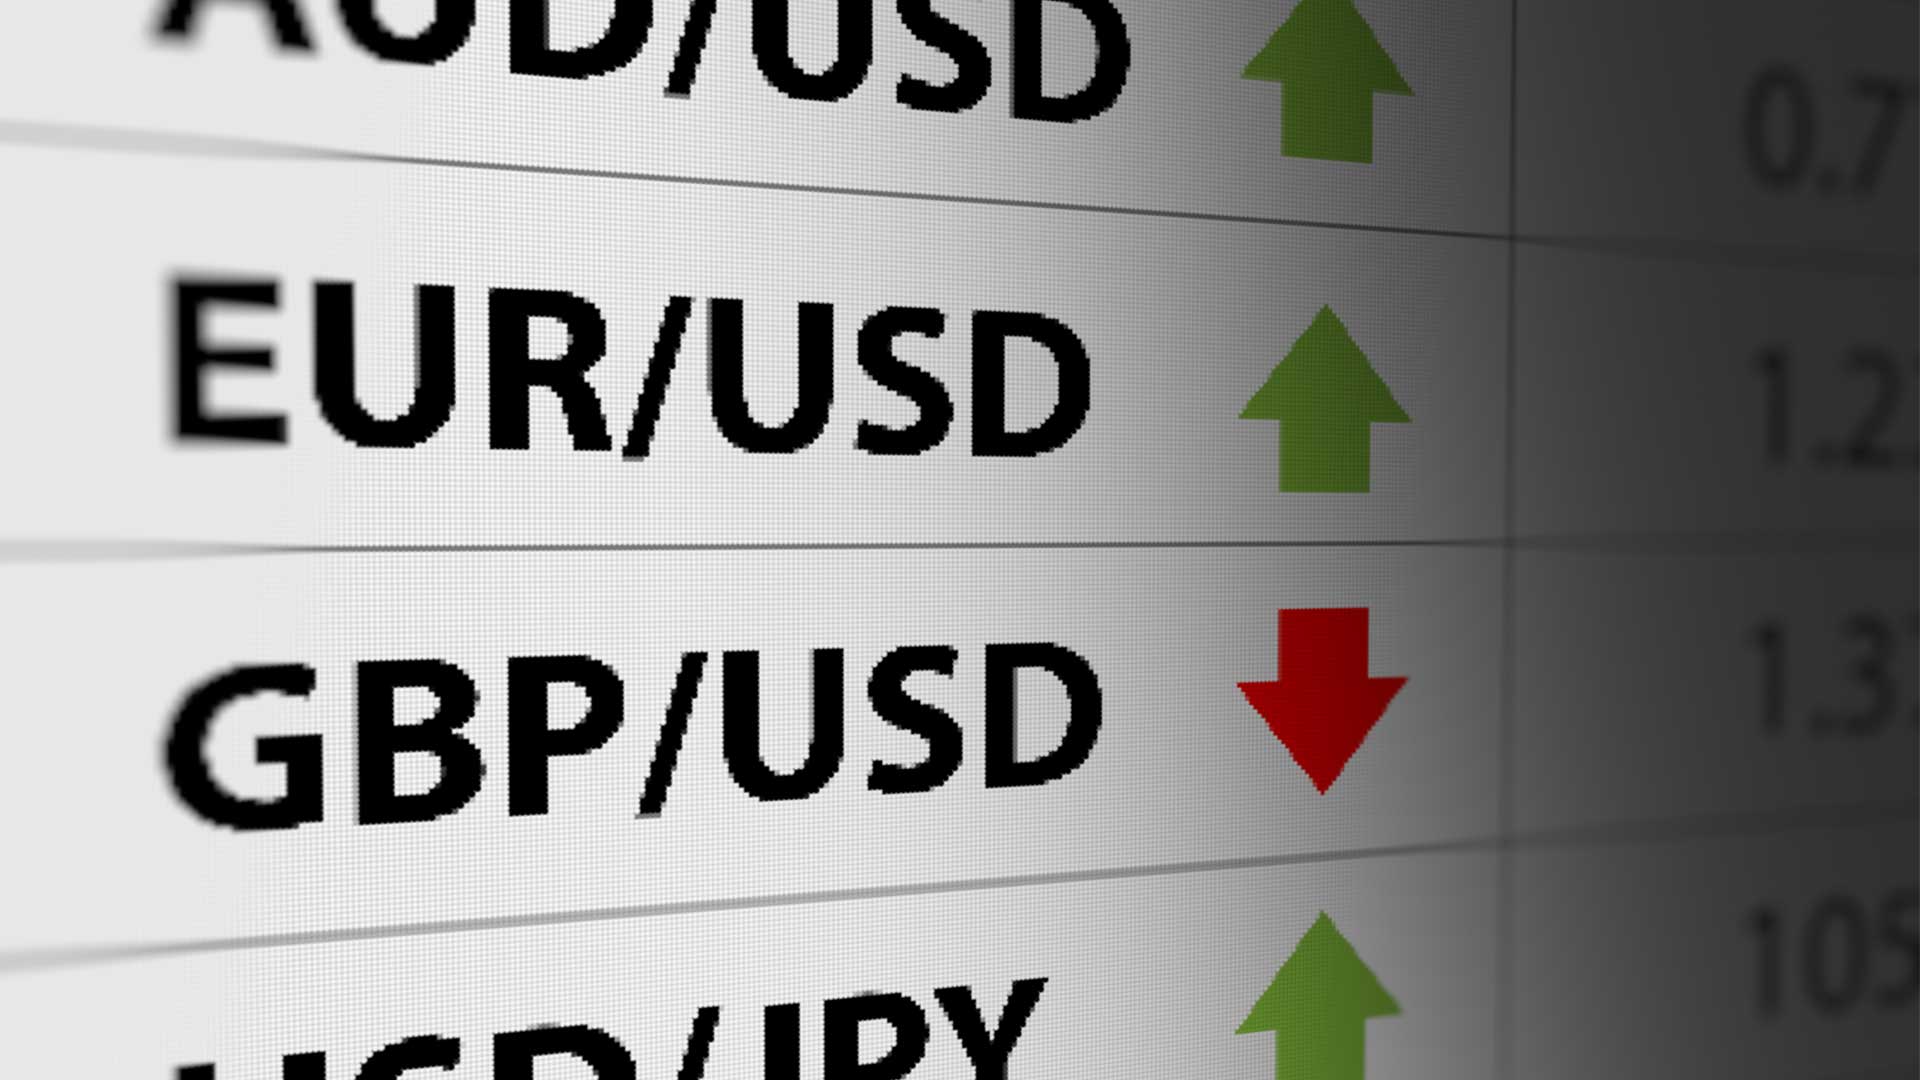
Choosing Forex Pairs: A Comprehensive Guide
23 Nov, 2023
Forex
5 min read
How to Study Your Losses to Realize Gains?
23 Nov, 2023
Trading Strategies
5 min read

Economic Indicator
5 min read
Daily Forex Analysis
5 min read
Risk On Returns In The Forex Markets
22 Nov, 2023

Forex
3 min read
Economic Indicator
5 min read
How Does Inflation Affect The Interest Rates?
15 Nov, 2023

Trading Strategies
5 min read

Forex
5 min read
Forex
5 min read
How to Read and Leverage The Forex Economic Calendar
14 Nov, 2023
Trading Strategies
5 min read
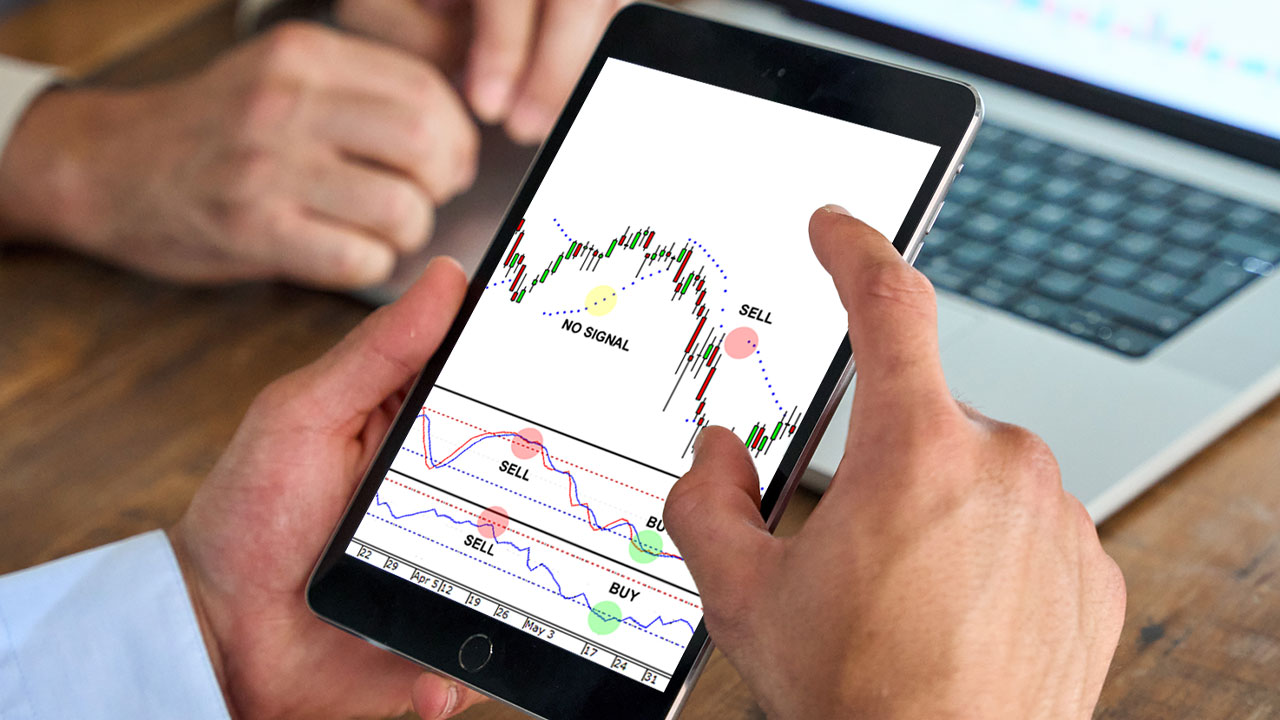
What Are Trading Signals & How Do They Work?
14 Nov, 2023

Forex
5 min read
Forex Trading and Taxes: What You Need to Know
13 Nov, 2023

Forex
5 min read
Understanding Supply and Demand in Forex Trading
13 Nov, 2023
CFD
8 min read
What is the FRA40 index?
10 Nov, 2023

Forex
5 min read
How Central Banks Impact the Forex Market?
07 Nov, 2023

Forex
5 min read
Forex
5 min read
How to Read And Understand Forex Trading Quotes
07 Nov, 2023
Trading Strategies
5 min read
What is Multi-Asset Trading?
07 Nov, 2023
Trading Strategies
5 min read
A Beginner's Guide to Hedging
07 Nov, 2023

Trading Strategies
8 min read
How to Use a Trading Journal?
07 Nov, 2023

Trading Strategies
8 min read
Top Strategies to Trade The Euro/British Pound
06 Nov, 2023

Forex
8 min read
Forex
5 min read
The Forex Trader's Guide to USD/JPY Pair
26 Oct, 2023
Economic Indicator
5 min read
Major Economic Reports That Affect the British Pound
26 Oct, 2023

Forex
7 min read
The Impact of BOJ on the Forex Market
26 Oct, 2023

Trading Strategies
8 min read
How to Create an AI Trading Bot With ChatGPT?
25 Oct, 2023

Trading Strategies
3 min read
Benefits And Risks of Using AI in Trading
18 Oct, 2023

Forex
5 min read
How to Switch Forex Brokers?
18 Oct, 2023

Forex
8 min read
How to Trade the Euro/British Pound?
18 Oct, 2023
Forex
3 min read
How to Trade the EUR/AUD Currency Pairs?
17 Oct, 2023

Forex
8 min read
How to Trade the Japanese Yen?
17 Oct, 2023

CFD
5 min read
FTSE 100 vs FTSE 250: What’s The Difference?
16 Oct, 2023

Trading Strategies
8 min read
Risks Associated With Candlestick Chart Patterns
16 Oct, 2023

Trading Strategies
5 min read
Stop-Loss Strategy For Day Trading
16 Oct, 2023

Forex
5 min read
Five Questions to Ask Your Forex Broker
16 Oct, 2023
Trading Strategies
5 min read
Hedging vs Speculation: Top Differences
10 Oct, 2023

Forex
3 min read
How to Use ChatGPT for Algorithmic Trading?
10 Oct, 2023
Daily Forex Analysis
3 min read
How To Analyze A Forex Chart: AUDJPY In Focus
10 Oct, 2023
Commodities
5 min read
The Correlation Between Commodities And Inflation
10 Oct, 2023
CFD
5 min read
What is the NAS100 Index?
09 Oct, 2023

Trading Strategies
5 min read
Risk Management Strategies for Active Traders
05 Oct, 2023
Trading Strategies
5 min read
Risks of Automated Trading Systems
04 Oct, 2023
Forex
4 min read
How to Make the Most of Your Brokerage Account
04 Oct, 2023
Forex
5 min read
How Does GDP Affect Forex Trading?
02 Oct, 2023
Economic Indicator
5 min read
How to Read a Balance Sheet For Trading?
02 Oct, 2023
Forex
5 min read
What Are the Factors Affecting USD/CAD?
02 Oct, 2023

Forex
8 min read
How Oil Impacts The Canadian Dollar?
02 Oct, 2023
CFD
5 min read
CFDs vs Futures: What Are The Differences?
20 Sep, 2023

Forex
8 min read
What is Forex VPS Hosting: A Comprehensive Guide
08 Sep, 2023

CFD
8 min read
How to Trade Crypto CFDs?
08 Sep, 2023

Economic Indicator
5 min read
How Does CPI Affect the Stock Market?
06 Sep, 2023

Commodities
8 min read
How Does NFP Affect the Price of Gold?
06 Sep, 2023

Forex
5 min read
Seasonal Market patterns For EUR/USD
06 Sep, 2023
Forex
5 min read
Top Differences Between Hedging and Stop-loss
06 Sep, 2023

Trading Strategies
8 min read
What is the Ideal Setup for Trading?
06 Sep, 2023
CFD
5 min read
Top Industries in FRA40 Index
06 Sep, 2023
CFD
5 min read
The Complete Guide to Euro Stoxx 50 Index
05 Sep, 2023
CFD
5 min read
What is DAX 30 Index?
05 Sep, 2023

Commodities
8 min read
What is OPEC, and How Does it Influence Oil Prices?
25 Aug, 2023

Trading Strategies
5 min read
How Will AI Impact Trading
24 Aug, 2023
Commodities
8 min read
How Can Oil Prices Affect Stock Prices?
23 Aug, 2023

Trading Strategies
4 min read
How to Use ChatGPT For Trading?
10 Aug, 2023

Trading Strategies
8 min read
Top AI Tools for Trading
10 Aug, 2023
Economic Indicator
5 min read
How Does GDP Affect the Stock Market?
09 Aug, 2023
Forex
5 min read
Forex Economic Calendar for 2023
31 Jul, 2023
Economic Indicator
5 min read

Economic Indicator
5 min read
Top Economic News Events for Forex Trading
25 Jul, 2023
Forex
5 min read
Forex
8 min read
S&P 500 Index
20 Jul, 2023

Forex
8 min read
How Does The Recession Affect The Stock Market?
18 Jul, 2023
Forex
5 min read
What is ADP National Employment Report?
18 Jul, 2023
Forex
5 min read
What is the Shanghai Index?
18 Jul, 2023
Forex
5 min read
How Does Inflation Affect the Forex Market?
13 Jul, 2023
MetaTrader
7 min read
How To Get The News Feed In MT4?
12 Jul, 2023
MetaTrader
6 min read
How To Set Up MetaTrader? Step-By-Step Instruction
11 Jul, 2023

MetaTrader
3 min read
Can You Use MetaTrader 4 Without A Broker?
07 Jul, 2023
MetaTrader
7 min read
How to Copy a Trade on MT4?
07 Jul, 2023

MetaTrader
6 min read
Is MetaTrader 4 Good For Beginners?
07 Jul, 2023

MetaTrader
5 min read
How to Add Templates to MT4?
05 Jul, 2023
MetaTrader
10 min read
Type of Orders in Metatrader
30 Jun, 2023
MetaTrader
8 min read
How To Speed Up MT4?
29 Jun, 2023
Forex
8 min read
MetaTrader
8 min read
How Do You Set Price Alerts With MetaTrader 4?
21 Jun, 2023
MetaTrader
5 min read
How Does MetaTrader 4 Work?
21 Jun, 2023
MetaTrader
8 min read
How to Add Commodities to MT4?
21 Jun, 2023

MetaTrader
2 min read
How to Add Indices to MT4?
21 Jun, 2023

Forex
8 min read
MetaTrader
How to Use MetaTrader 4
19 Jun, 2023
Forex
5 min read
Dos and Don'ts of Forex Trading in Vietnam
18 Jun, 2023

Forex
8 min read
What is Nikkei 225?
18 Jun, 2023
Forex
5 min read
Forex
4 min read

Forex
5 min read

Forex
4 min read

Forex
5 min read

Forex
5 min read

Forex
4 min read
Forex
7 min read
The Ultimate Guide to The Tokyo Stock Exchange
02 Jun, 2023

Forex
5 min read
MetaTrader
13 min read
Basic Functions of MT4
23 May, 2023
MetaTrader
8 min read
Customizing MT4 Interface: Tips and Tricks
23 May, 2023

MetaTrader
5 min read
MetaTrader
8 min read
The Advantages of Using MT4 for Forex Trading
09 May, 2023
MetaTrader
10 min read
A Comprehensive Guide to MT4 Trading for Beginners
01 May, 2023
MetaTrader
7 min read
How to Optimize MT4 Trading Experience
01 May, 2023

Trading Strategies
5 min read
What is Purchasing Manager's Index?
24 Apr, 2023

Trading Strategies
8 min read
15 Strongest Currencies in The World
17 Apr, 2023
Forex
5 min read

Trading Strategies
4 min read
Buying The Dip: What Does it Mean?
16 Mar, 2023

Trading Strategies
5 min read
Popular Trading Tools for New Traders
07 Mar, 2023

Commodities
5 min read
Gold Price Forecast for 2023
05 Mar, 2023

Daily Forex Analysis
3 min read
Forex Chart Of The Day: Is Gold Heading To $1800.00?
22 Feb, 2023
MetaTrader
8 min read
How to Open a MetaTrader 5 Account
15 Feb, 2023

Trading Strategies
5 min read
Automated Trading vs Manual Trading
08 Feb, 2023

Commodities
5 min read
Top Factors That Affect Gold Prices
23 Jan, 2023
Forex
5 min read
How to Become a Part-Time Forex Trader
19 Jan, 2023

Forex
5 min read
Top Forex Trends For 2023
10 Jan, 2023
Trading Strategies
8 min read
The Ultimate CFD Day Trading Guide
21 Dec, 2022

Cryptocurrencies
8 min read
Cryptocurrencies to Focus on in 2023
06 Dec, 2022
Trading Strategies
5 min read
What is Grid Trading?
01 Dec, 2022
Trading Strategies
5 min read
Russian Ruble Financial Crisis 2022: What to Expect?
22 Nov, 2022
Trading Strategies
5 min read
How Do Interest Rates Affect The Stock Market?
15 Nov, 2022
Trading Strategies
8 min read
What is a Ranging Market?
08 Nov, 2022
Trading Strategies
3 min read
How to Use RSI for Intraday Trading
02 Nov, 2022
Trading Strategies
8 min read
How to Trade With MetaTrader WebTrader
26 Oct, 2022
Trading Strategies
6 min read
How to Build a Diversified Portfolio
18 Oct, 2022

Forex
8 min read
Top Forex Forecasting Techniques
11 Oct, 2022
Trading Strategies
5 min read
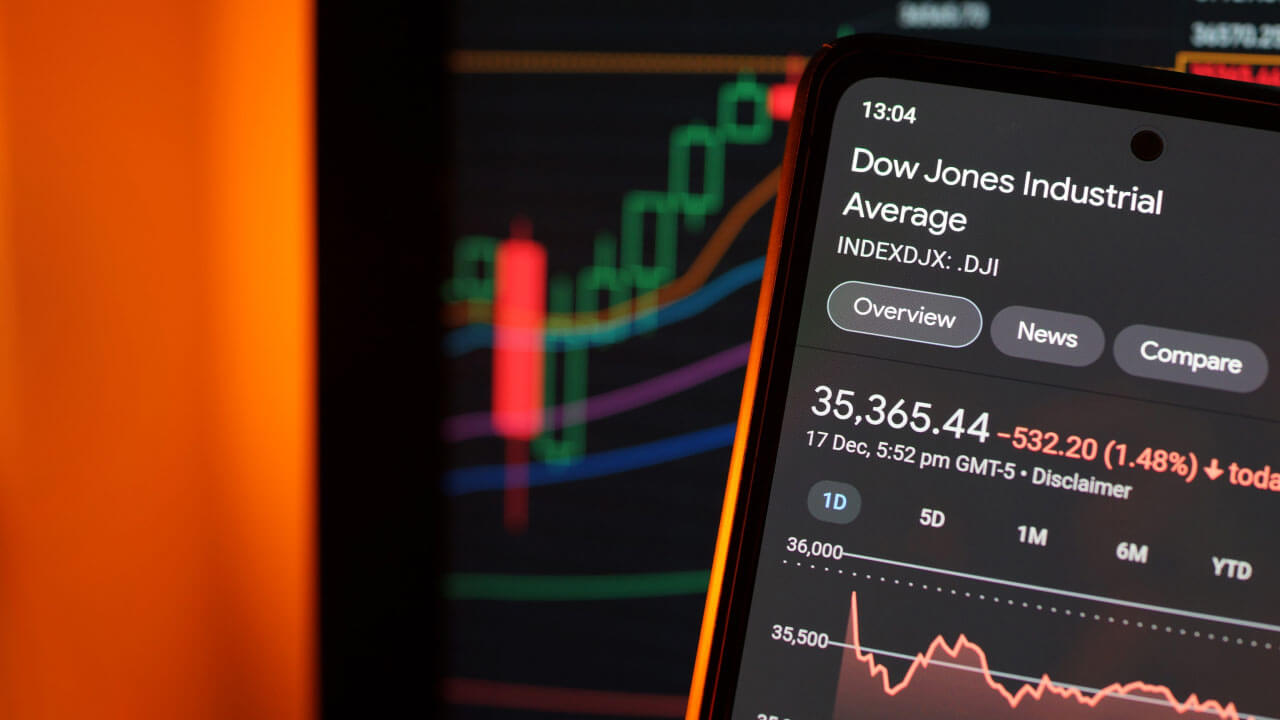
What is Dow Jones?
26 Sep, 2022

Trading Strategies
8 min read
What is Overtrading (And How to Avoid it)
19 Sep, 2022

Trading Strategies
5 min read
How to Master The Psychology of Forex Trading
06 Sep, 2022

Forex
8 min read
Major Forex Market Hours and Trading Sessions
30 Aug, 2022
CFD
4 min read
How to Choose a CFD Trading Platform
23 Aug, 2022
Trading Strategies
4 min read
How to Overcome Fear When Trading
22 Aug, 2022
Forex
5 min read

Trading Strategies
6 min read
What is Carry Trade in Forex?
03 Aug, 2022

Forex
5 min read
How to Trade Forex News: Forex News Trading Strategy
27 Jul, 2022

Trading Strategies
5 min read
Why Do Traders Lose Money in Intraday Trading
19 Jul, 2022
Forex
5 min read
What is Consolidation in the Stock Market?
12 Jul, 2022
Forex
8 min read
Forex Words and Jargons Every Trader Should Know
28 Jun, 2022

Trading Strategies
5 min read
What Are Market Reversals And How to Spot Them?
07 Jun, 2022
Trading Strategies
10 min read
MetaTrader 4: Top Tips and Tricks
01 Jun, 2022
Forex
8 min read

Cryptocurrencies
5 min read

Commodities
5 min read
Top Silver Trading Strategies To Get Ahead
03 May, 2022
Forex
8 min read
What Are The Key Drivers of The Forex Market
25 Apr, 2022

Daily Forex Analysis
5 min read
Questions to Ask When Planning Trade Exits
06 Apr, 2022
Forex
5 min read
7 Popular Indices Trading Strategies
21 Mar, 2022
Forex
5 min read
Forex
5 min read

CFD
5 min read
Top CFD Trading Strategies For Beginners
01 Mar, 2022

Commodities
5 min read
Forex
5 min read
How to Use the USDX for Forex Trading
16 Feb, 2022

Forex
6 min read
Commodities
3 min read
How to Trade Oil CFDs
25 Jan, 2022
CFD
5 min read
How Does an Index CFD Work?
13 Jan, 2022
CFD
5 min read
10 Important Rules for CFD Trading
21 Dec, 2021

Forex
4 min read
How to Find Out Which Forex Broker Is Legit
24 Nov, 2021
Shares
3 min read
Index Trading Explained: How to Trade Indices
22 Nov, 2021
Commodities
8 min read
Cryptocurrencies
5 min read
Top 10 Tips for Bitcoin and Crypto Trading
10 Nov, 2021
Shares
5 min read

Forex
5 min read
16 Effective Day Trading Strategies for Beginners
19 Oct, 2021
Commodities
5 min read

Cryptocurrencies
5 min read
Forex
8 min read
Shares
5 min read
CFDs vs Stocks: Which is a Better Investment?
21 Sep, 2021

Commodities
2 min read
How to Start Oil Trading in 5 Simple Steps
13 Sep, 2021

Forex
5 min read
Top Economic Indicators Traders Should Watch
08 Sep, 2021

Forex
8 min read
Forex Trading Strategies That Actually Work
31 Aug, 2021
Forex
5 min read
Commodities
8 min read
How to Trade Commodities: A Complete Guide
24 Aug, 2021

Forex
8 min read
Top 5 Moving Average Trading Indicators
24 Aug, 2021

Cryptocurrencies
5 min read
What is Bitcoin and How Do You Trade It?
20 Aug, 2021
Forex
8 min read
Types of Forex Charts (And How to Read Them)
12 Aug, 2021

Commodities
8 min read
Daily Forex Analysis
5 min read

Forex
8 min read

Forex
7 min read
A Guide to Multiple Timeframe Analysis
05 Aug, 2021
CFD
5 min read
Top Benefits of Trading CFDs
30 Jul, 2021

Commodities
5 min read
How to Start Day Trading Gold
29 Jul, 2021
CFD
8 min read
Forex
8 min read
Forex
7 min read
How Interest Rates Affect Forex Trading
16 Jul, 2021

Forex
5 min read
Why Forex Traders Need Quantitative Tightening
02 Jul, 2021

Forex
5 min read
Forex
7 min read

Forex
6 min read
What Is Algorithmic Trading
11 Jun, 2021
Forex
5 min read
Spoofing In Forex Trading
10 Jun, 2021
Forex
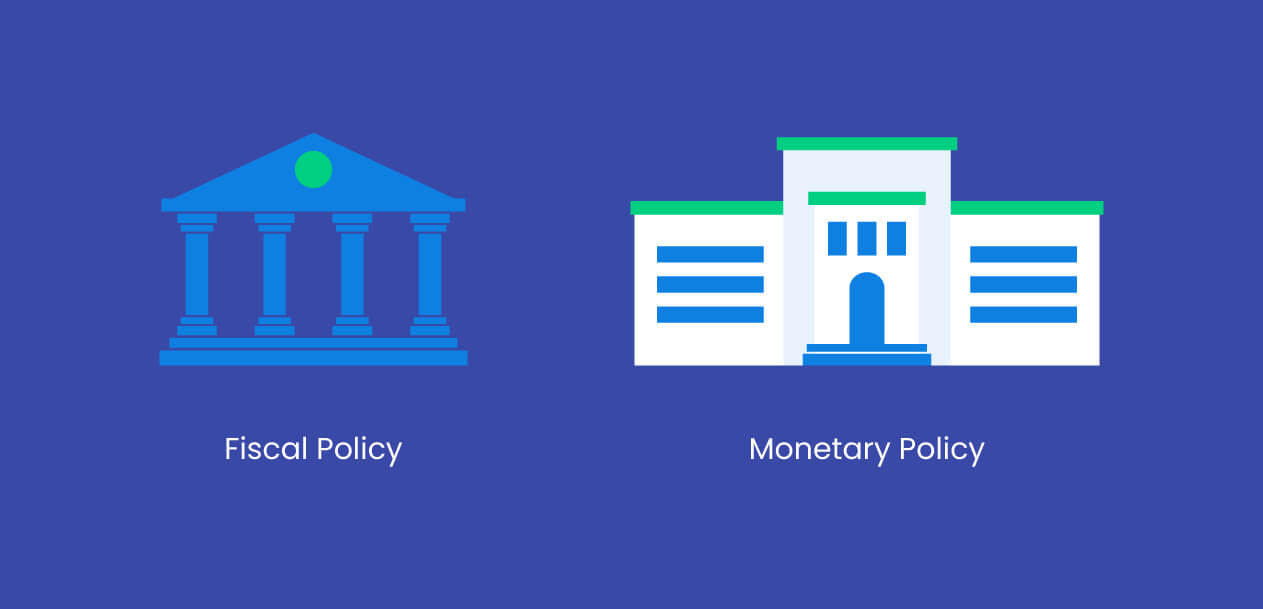
5 min read
Monetary And Fiscal Policies In Forex
06 Jun, 2021
Forex
5 min read
How To Profit From Double Candlestick Patterns
04 Jun, 2021
Forex
3 min read
Forex Trading Using Support And Resistance Levels
21 May, 2021

Forex
5 min read
How to Use a VPS For Forex?
21 May, 2021

Cryptocurrencies
5 min read
Forex
5 min read
Exploring Binary Options Trading
14 May, 2021

Forex
5 min read

Forex
5 min read
Binni Ong On The Past, Present, And Future Of Forex
28 Apr, 2021

Forex
5 min read
Trading With The RSI Indicator
09 Apr, 2021

Forex
5 min read
Forex
4 min read
Choosing Your Forex Broker
18 Mar, 2021

Forex
5 min read
The Best Time To Trade Forex
15 Mar, 2021

Forex
8 min read
The Pip And Its Usage In Forex
12 Feb, 2021

Forex
5 min read
The Basics Of A Fundamental Analysis
11 Feb, 2021
Forex
5 min read
The Basics Of Opening A Forex Account
09 Feb, 2021
Forex
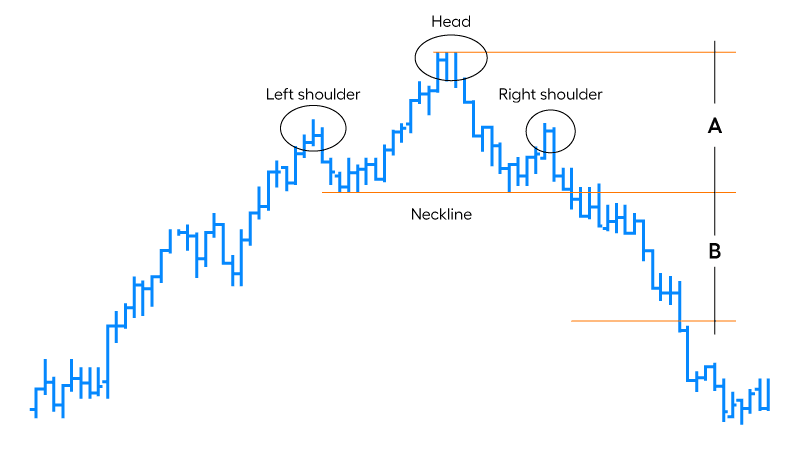
5 min read
How To Trade With The Head And Shoulders Pattern
05 Feb, 2021

Forex
8 min read
Forex: Its History And Futures
03 Feb, 2021

Forex
5 min read
The Basics Of Swing Trading
25 Jan, 2021

Forex
8 min read
Forex
8 min read
Forex 101: How To Make A Forex Trading Plan
12 Jan, 2021

Trading Strategies
8 min read
Divergence Trading and How to Navigate Around It
29 Dec, 2020
Daily Forex Analysis
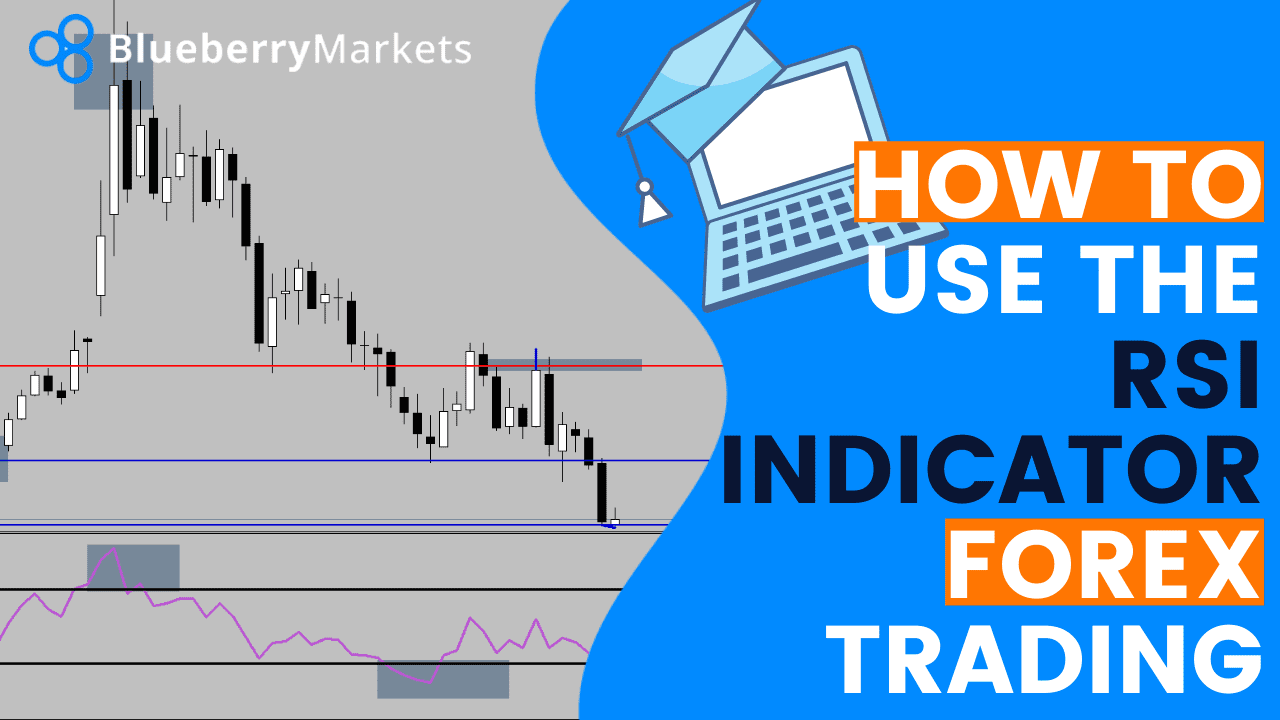
6 min read
How To Use The RSI Indicator Forex Trading
09 Dec, 2020
Daily Forex Analysis
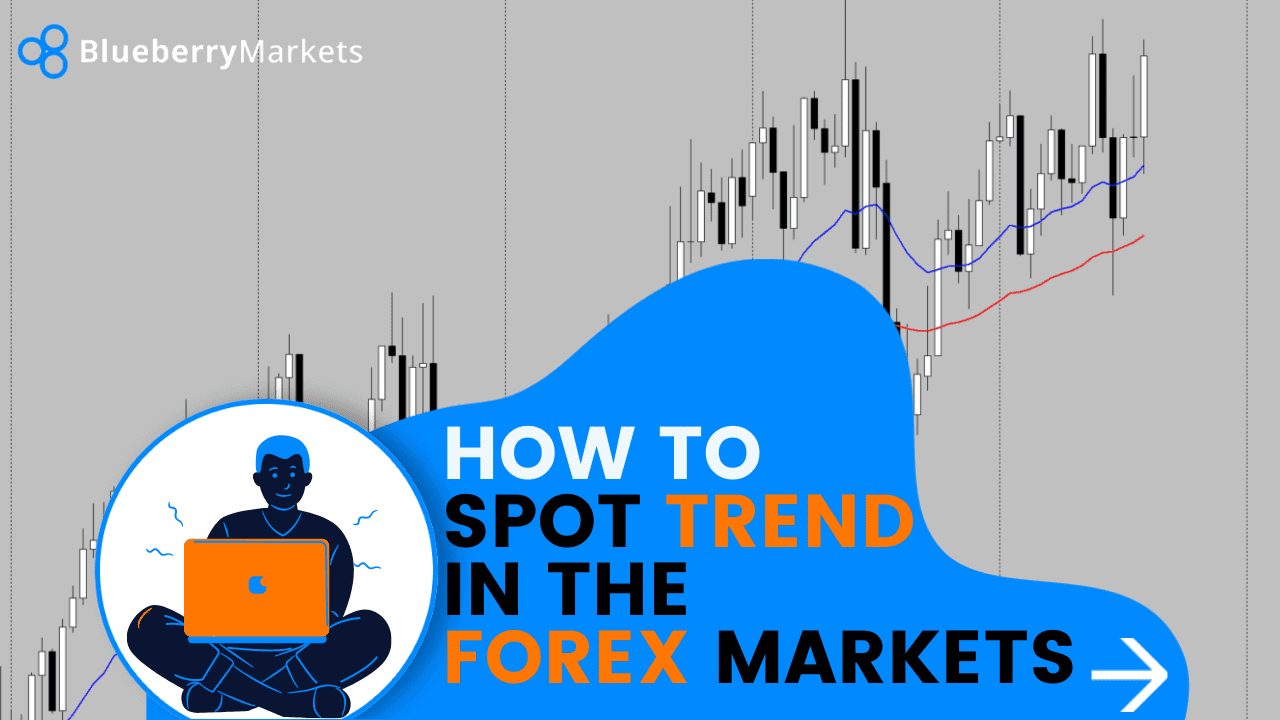
5 min read
How To Spot Trend In The FOREX Market
03 Dec, 2020

Trading Strategies
5 min read
Trading with the Head and Shoulders Pattern
06 Oct, 2020
Trading Strategies
5 min read
Pivot Points and Why They Matter
02 Oct, 2020

Trading Strategies
5 min read
The Key to Making It as a Retail Trader
12 Sep, 2019

Trading Strategies
8 min read
The Nitty-Gritty of Risk Management
12 Sep, 2019
Page 1 of 1