



Technical analysis in financial markets relies on historical price patterns to identify potential future trends. The W pattern is used by some traders to identify possible trend reversals. One commonly considered feature of the W pattern is identifying what technical analysts commonly describe as a confirmed breakout.
Let’s discuss everything about the W pattern and how to use it in forex trading. We’ll go in-depth on the double-bottom side, outlining how to use the W pattern in your trading.
What is a W pattern?
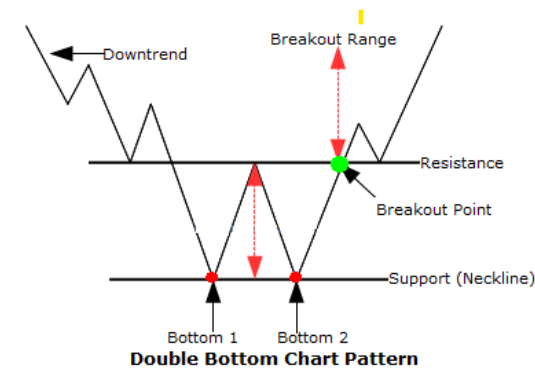
The W pattern, a double bottom, is a technical analysis indicator used in financial markets to identify potential bullish reversals within a downtrend. It is formed by two distinct price lows separated by a central high, resembling the letter ‘W’ when visualized on a price chart. These lows are commonly observed at approximately similar levels, indicating a level of support which may indicate increased buying interest at that price level.
- The W pattern suggests a loss of momentum in the downtrend which may indicate increased buying interest at that price level.
- The central high indicates a temporary price recovery but doesn't necessarily signify a complete reversal.
- The key to utilizing the W pattern lies in identifying a confirmed breakout. This occurs when the price decisively closes above the upper trendline, drawn around the central reaction high between the two lows.
Does the W pattern work in stocks, crypto, and forex?
The double bottom, or W pattern, is a trade signal rooted in supply and demand. Rather than being based solely on stocks or a single asset class, it’s a signal that may appear across different asset classes. Whether traders research cryptocurrency, indices, commodities, stocks, or forex, the general structure may appear similar, although interpretation can vary.
However, one important distinction between stocks and indices compared to forex is that the latter doesn’t have the same centralized volume feed. A breakout above the neckline may be interpreted differently in stocks and indices because centralised volume data is available because it’s backed by a visible spike in trading volume. Forex has no centralized volume feed, meaning traders pay more attention to price momentum indicators and candlestick structure.
Cryptocurrency CFDs exist in the space between these groups. While volume data is available, it can vary between exchanges, making it less consistent than in equities. Combined with the typically higher volatility of digital assets, higher volatility may affect stop-loss behavior and position risk and additional indicators may be considered when analyzing a breakout.
While the pattern and psychology of the W pattern remain consistent, how traders use and respond to the pattern may vary by asset class.
Identifying W patterns
Charts
Heiken-Ashi candlesticks
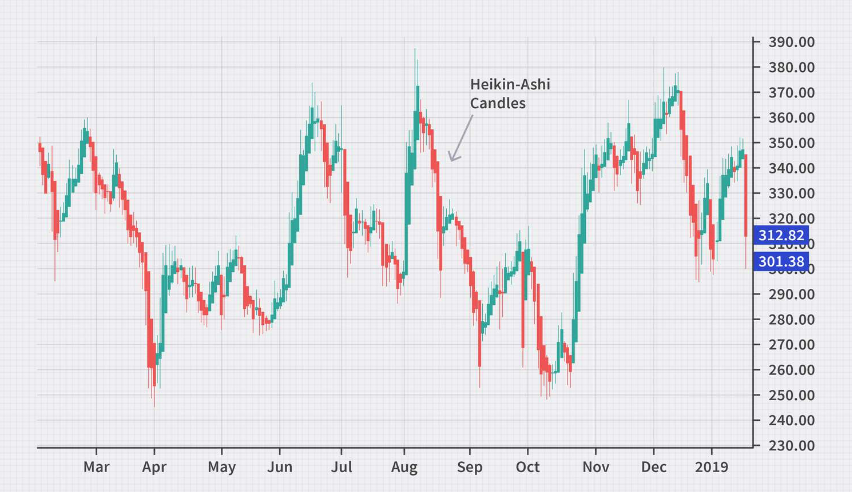
Heikin-Ashi candles modify the appearance of traditional candlesticks by smoothing out price action and focusing on the underlying trend. These charts help identify W patterns because they can sometimes reduce price noise, making the overall trend and potential reversal points clearer. Due to the modified open and close prices of the Heikin-Ashi candles, the two distinct lows and the central high of the W pattern may be visually more prominent.
Three-line break chart
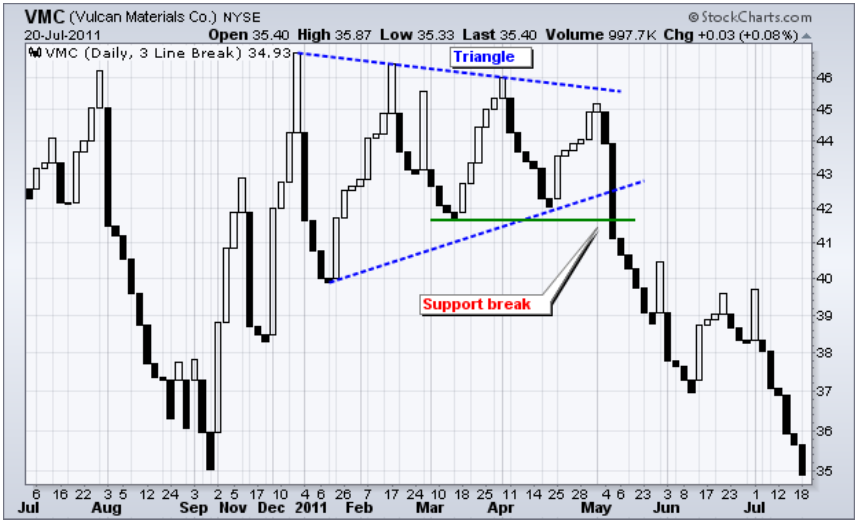
Three-line break charts are bar charts that plot a bar only when the price breaks a certain threshold (usually a specific percentage) from the previous bar's close. They can be useful for identifying W patterns because they emphasize significant price movements. The two lows and the central high of the W pattern can be represented by distinct bars, highlighting the potential reversal points within the downtrend.
Line charts
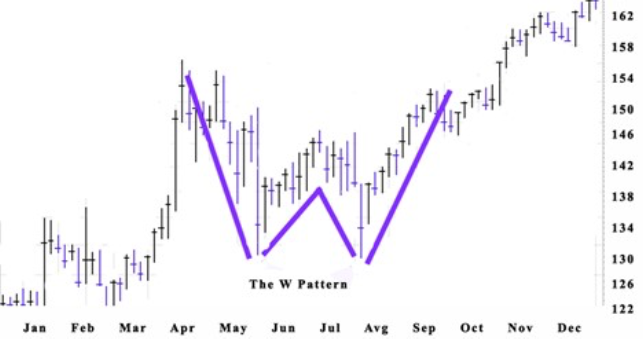
Line charts connect closing prices over time, providing a basic visualization of the price trend. Line charts offer a simplified view of price movements. While they might not be the most precise tool, they can still identify the general W pattern formation, particularly for traders who prefer a less cluttered chart. The two lows and the central high might be visually identifiable, but subtle price movements within the pattern might be less evident.
Tick charts
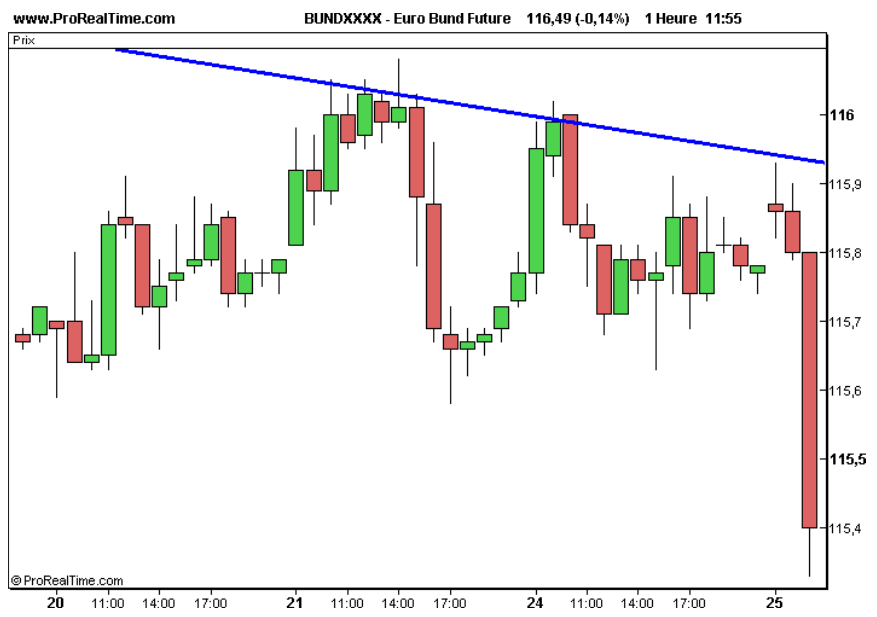
Tick charts plot a new bar every time a specific number of price ticks (transactions) occur, regardless of the time elapsed. The two lows and the central high might be more visually distinct, especially if they occur with significant volume changes. Analyzing the volume at the lows and the central high of the potential W pattern can provide additional information. Higher observed volume near the lows may indicate increased market participation, and lower observed volume near the central high may indicate reduced market participation.
Indicators
Stochastic oscillator
This indicator measures the relationship between the current closing price and the price range over a specific period. During a W pattern formation, the Stochastic Oscillator might dip into oversold territory near the two lows, suggesting increased buying interest. A subsequent rise above its oversold level could coincide with the price move towards the central high, which some analysts may interpret as a possible reversal indication.
Bollinger bands
These bands represent a volatility channel around the moving average price. As the W pattern forms, the price might compress towards the lower Bollinger Band near the lows, which some analysts may interpret as price trading near the lower volatility band. A breakout above the Bollinger Band could then align with the price move above the neckline of the W, which may be interpreted as a possible change in price direction.
On-balance volume (OBV)
The On-Balance Volume indicator tracks volume changes associated with price movements. During the W pattern, the OBV might show a flattening or slight increase at the lows, suggesting buying activity that could slow or halt the downtrend. A sustained rise in OBV coinciding with the price move towards the central high could further support the possibility of a bullish reversal.
Price momentum oscillator (PMO)
This indicator measures the rate of price change. During the W pattern formation, the PMO might dip into negative territory near the lows, reflecting a weakening downward momentum. A subsequent rise back above zero could then align with the price move towards the central high, potentially indicating a shift in momentum towards an uptrend.
Step-by-step guide: How to spot W patterns
This is an example only to enhance a consumer's understanding of the strategy being described above and is not to be taken as Blueberry providing personal advice.
1- Identify the downtrend
Start by analyzing the chart and identify a downward trend in price movement.
2- Look for the first low
Observe the price action and locate the first distinct low within the downtrend. This low represents a point where exit pressure temporarily halts the decline.
3- Watch for a price rebound
Following the first low, a price recovery should occur, forming a central high. This high indicates a temporary pause in the downtrend but doesn't necessarily signify a complete reversal.
4- Identify the second low
After the central high, the price should decline again and create a second distinct low. This second low ideally should be at a similar level or slightly higher than the first low, suggesting continued entry pressure preventing a deeper decline.
5- Confirm the neckline
Draw a trendline connecting the lows of the first and second bottoms. This trendline represents the neckline of the W pattern.
6- Watch for the breakout
Finally, identify a confirmed breakout. It occurs when the price decisively closes above the neckline. This breakout suggests a potential shift in market sentiment towards a potential uptrend.
Interpreting W patterns: How do external factors impact it?
- Economic data releases: Major economic data releases (such as GDP reports, non-farm payrolls, and employment statistics) cause significant market volatility, which distorts W patterns. Be cautious of false breakouts or exaggerated price movements around major economic announcements; wait for confirmation post-event.
- Interest rate changes: Central bank interest rate decisions significantly affect market trends and price levels. Interest-rate increases may influence market direction, depending on expectations and broader conditions, while interest-rate reductions may also affect market direction and volatility. Hence, traders should consider rate policies in their analysis.
- Earning reports: Company earnings reports can cause price gaps and volatility, impacting the formation and breakout of W patterns in individual stocks and, similarly, in forex rates. Earning announcements may affect whether an existing technical setup continues or fails, while negative announcements may cause the price structure to change. However, earnings announcements may involve elevated volatility and gap risk to avoid extreme volatility.
- Currency correlations: Correlated currency pairs tend to move in the same direction. If two currency pairs with a strong positive correlation exhibit a W pattern, the signal strengthens. Conversely, conflicting W patterns between correlated pairs may indicate market uncertainty and weaken the pattern's reliability.
Trading strategies using W patterns
W pattern breakout strategy
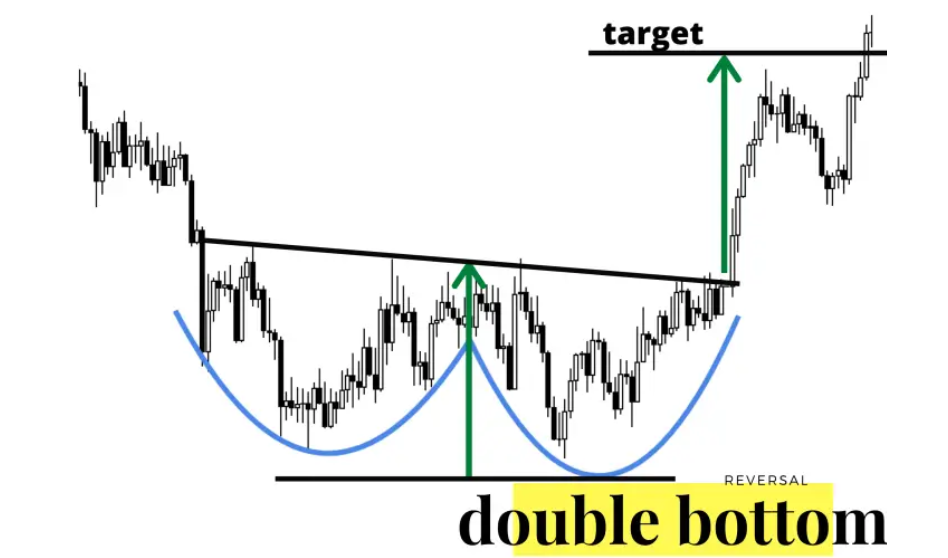
The W pattern breakout strategy captures the initial price movement after the W pattern breaks bullish. Traders typically should enter the trade only after a confirmed breakout, which means the price decisively closes above the neckline (the upper trendline connecting the lows of the W).
This confirmed breakout suggests a higher probability of a sustained uptrend, indicating the downtrend might be losing steam. To limit potential losses if the breakout turns out to be false, place a stop-loss order just outside the opposite trendline of the breakout (typically below the neckline).
W pattern Fibonacci strategy
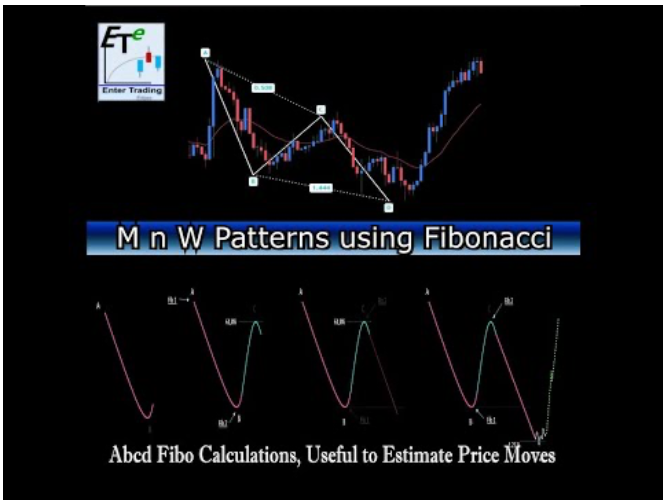
The W pattern Fibonacci strategy combines the principles of the W pattern with Fibonacci retracement levels to identify potential entry and exit points. Fibonacci levels act as potential areas of support and resistance.
It provides insights into where prices may pause or reverse during pullbacks. Traders can enter a long position when the price pulls back to a Fibonacci retracement level (such as 38.2%, 50%) after the breakout of the W pattern's neckline and vice versa.
W pattern pullback strategy
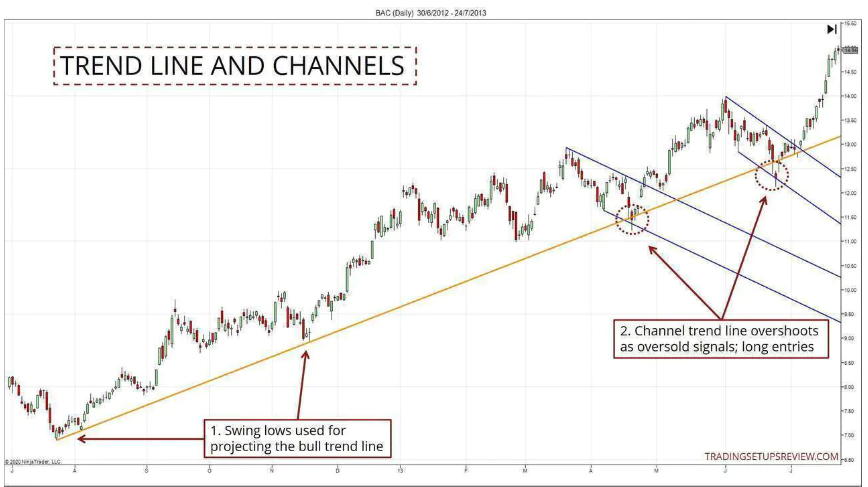
The W pattern pullback strategy involves waiting for a retracement or pullback to occur after the breakout of a W pattern. Enter the trade after a slight pullback following the confirmed breakout. The price might retrace slightly after the breakout before continuing its upward momentum.
This pullback can be seen as an opportunity to enter the trade at a potentially better price point. Look for a confirmation signal during the pullback to support the uptrend continuation. It could be a moving average crossover or a bullish candlestick pattern on a lower time frame chart.
W pattern volume confirmation strategy
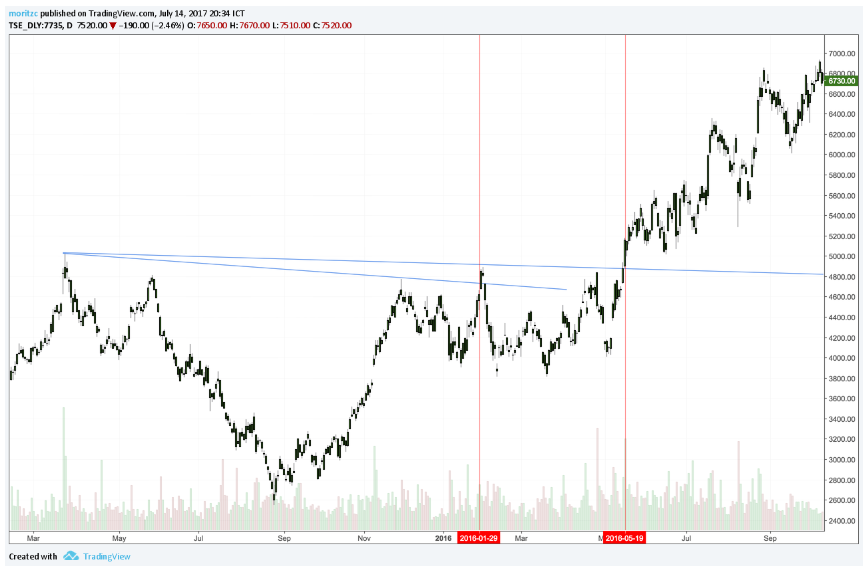
The W pattern volume confirmation strategy uses volume analysis to validate the breakout of a W pattern. Adding volume analysis to the W pattern identification provides additional insights into entry and exit pressure.
Look for higher volume at the lows of the W (indicating prolonged pressure halting the downtrend) and during the breakout itself. It suggests stronger long pressure, potentially increasing the likelihood of a bullish reversal.
W pattern divergence strategy
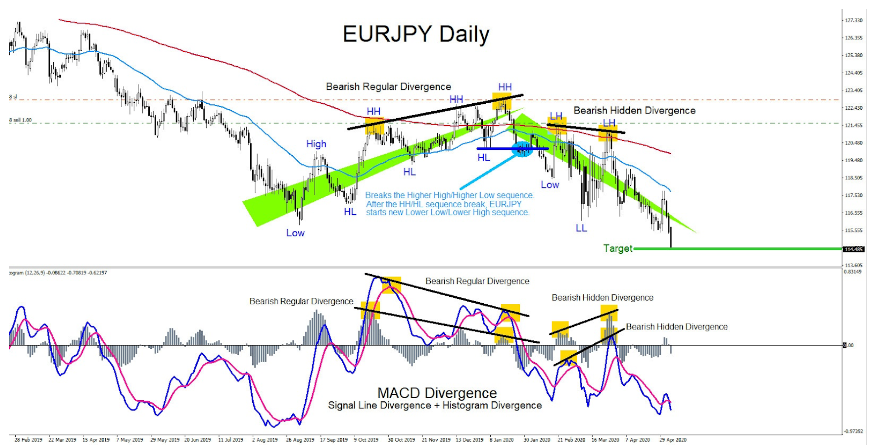
The W pattern divergence strategy focuses on identifying divergence signals during the formation of a W pattern on the price chart. It provides early clues regarding a potential reversal.
During the W pattern formation, the price might make new lows while a momentum indicator like RSI doesn't. This divergence suggests weakening exit pressure even though the price is dropping. It can hint at a potential reversal brewing before the actual breakout occurs.
W pattern partial position entry strategy
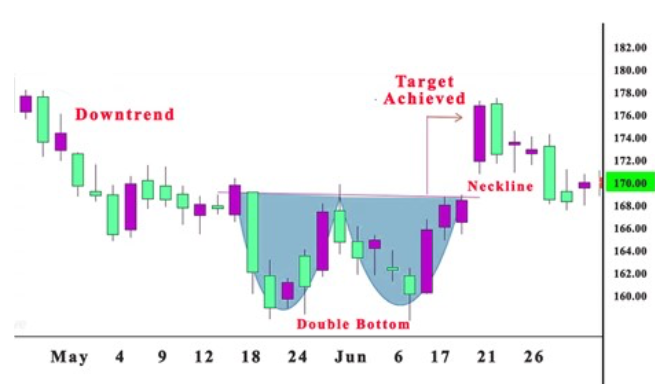
Traders can combine a partial position strategy with the W pattern to manage risk as the setup develops. Rather than opening a full position immediately, traders can begin with a smaller position after the second low has formed, when the potential double bottom becomes visible but the reversal isn’t yet confirmed. IF the price later closes above the neckline and confirms the breakout, they may choose to add to the position as the pattern develops.
A staged approach ties position size to increasing confirmation of the W pattern rather than committing the full position before the pattern is complete. Learn more in Blueberry’s guide around how to calculate Forex position sizing.
How to set a price target for the W pattern
One method traders may use to estimate a potential price target is to measure the vertical distance between the lowest point of the W pattern and the neckline. After the price closes above the neckline, the same distance is projected upward from the breakout point to estimate a potential target.
For example, if the distance from the pattern’s low to the neckline is 100 points, a trader may project an initial target approximately 100 points above the breakout level. Doing so provides a more consistent framework for analyzing potential price movement but is never a guarantee that the market will reach the projected level.
This example is provided for educational purposes only to enhance a trader’s knowledge of the strategy and should not be taken as Blueberry providing personal financial trading advice.
Common risks with W pattern trading and how to avoid them
- False breakouts: W pattern breakouts may sometimes fail to sustain momentum, leading to false signals and losses. Traders should wait for confirmation of the breakout with strong volume and follow-through price action. Additionally, consider using a higher timeframe to confirm the breakout signal, reducing the likelihood of false breakouts.
- Low-volume breakouts: Breakouts from W patterns occurring on low volume may lack conviction and increase the risk of reversal. Traders should confirm the breakout with above-average volume and avoid trading breakouts with low volume, as they may lack follow-through.
- Market whipsaws: Choppy market conditions or sudden price movements can result in market whipsaws (sudden, sharp price reversals), leading to losses. Traders should filter out noisy market conditions by using additional technical indicators or confirming signals from higher timeframes. Avoid trading during periods of low liquidity or high volatility, which can increase the risk of whipsaws.
- Confirmation bias: Succumbing to confirmation bias by selectively interpreting information that supports a bullish bias on W patterns can lead to overlooking warning signs or early exit signals. Traders should stay objective and evaluate W pattern signals impartially, considering both bullish and bearish scenarios. Avoid ignoring contradictory signals or dismissing early exit signals that indicate potential reversals.
How W pattern vs. M pattern (double top)
The W pattern and M pattern are both reversal patterns that traders use in technical analysis, showing potential trends in opposite market directions.
As we’ve touched on, a W pattern forms after a downtrend. It consists of two lows at a similar price level, separated by a temporary recovery. If there is a confirmed break above the neckline, it may indicate that selling pressure is weakening and that bullish reversal is developing.
An M pattern, or a double top pattern, is a direct contrast to this technical indicator, instead forming after an uptrend. It features two highs at a similar level separated by a pullback. A confirmed break below the neckline may suggest that buying momentum is fading and that a bearish reversal is beginning.
For more detail, read the Blueberry article on the M trading pattern.
The W trading pattern: what to remember?
The W trading pattern helps identify potential bullish reversals within a downtrend. Traders should consider the following tips to trade the W pattern:
- Combine the W pattern with other technical indicators like RSI or MACD for stronger breakout signals
- Look for higher volume at the lows and during the breakout to strengthen the possibility of reversal
- Utilize stop-loss orders to limit potential losses if the breakout is false
- Don't chase breakouts; wait for confirmation and consider entering on a pullback for better entry points
By recognizing the W formation and key elements, traders can gain valuable insights into market shifts, especially for uptrend potentials.
Frequently asked questions
What’s the difference between a double top and a double bottom?
A double bottom (W pattern) forms after a downtrend and may signal a potential bullish reversal. A double top (M pattern) is the opposite, forming after a downtrend and indicating a potential bearish reversal.
Is the W pattern (double bottom) bullish or bearish?
The W pattern is typically associated with a bullish reversal, as it forms after a downtrend and may signal that selling pressure is weakening.
How do traders trade the W pattern?
Traders typically wait until a confirmed breakout above the neckline before then analyzing potential trading opportunities. Other technical indicators and risk management considerations should always come into play for a comprehensive strategy.
Disclaimer: All material published on our website is intended for informational purposes only and should not be considered personal advice or recommendation. As margin FX/CFDs are highly leveraged products, your gains and losses are magnified, and you could lose substantially more than your initial deposit. Investing in margin FX/CFDs does not give you any entitlements or rights to the underlying assets (e.g. the right to receive dividend payments). CFDs carry a high risk of investment loss.