


Stochastic Indicator helps traders identify overbought and oversold market conditions that substantially lead to market reversals. It becomes easier for traders to determine when and where to enter or exit the market when they receive potential market reversal signals through the Stochastic Indicator. In this article, we discuss everything there is to know about Stochastic Indicator:
What is a Stochastic Indicator?
Stochastic Indicator measures the market's price momentum. The indicator uses support and resistance levels to find out when a currency pair is trading above or below its actual/fair value. The indicator is range bound and consists of readings between 0 to 100. It helps compare how far or close the current currency pair price is trading to its high and low price levels. This leads to future market price predictions that help traders enter or exit the market.
- Traders receive buy signals whenever the current price is close to its low price, as the market is expected to reverse in an upward direction from hereon.
- Traders receive sell signals whenever the current price is close to its high price, as the market is expected to reverse in a downward direction from hereon.
Types of Stochastic Indicators
1. High Stochastic
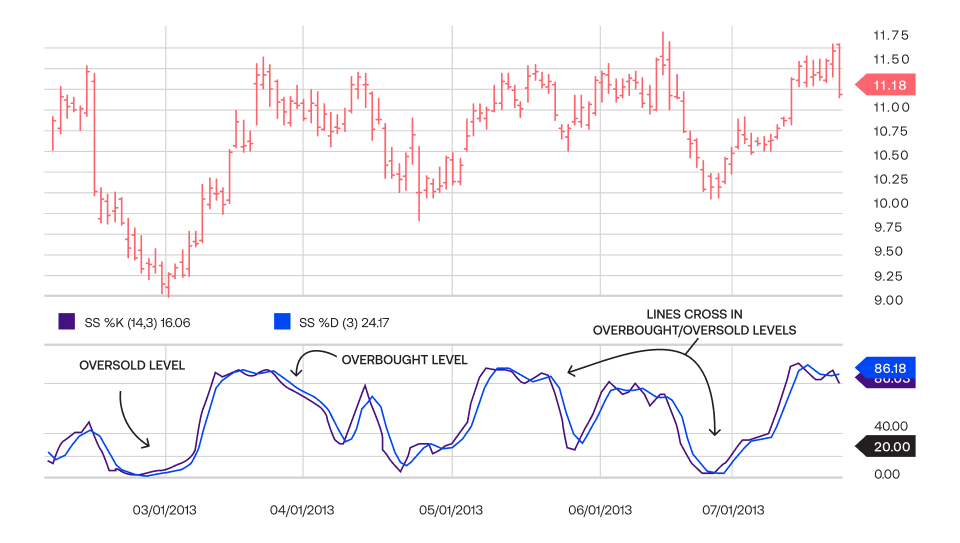
A High Stochastic occurs when the currency pair prices close near to their high price and keep increasing. An overbought condition is signalled when the stochastic lines are above 80, providing traders with a downward market reversal. This prepares traders to be ready to short the trade with the prices expected to fall soon.
2. Low Stochastic
A Low Stochastic occurs when the currency pair prices close near to their low price and keep decreasing. An oversold condition is signalled when the stochastic lines are below 20, providing traders with an upward market reversal. This prepares traders to be ready to enter long trade positions, with the prices expected to increase soon.
How does the Stochastic Indicator work?
The Stochastic indicator focuses on the currency pair’s closing price placement and compares it with the high and low price range in a particular period. The indicator helps traders identify potential price reversal points in the market.
- When the Stochastic indicator compares the current currency pair price line being near the highest price levels, it indicates that the currency pair is closing at the top level and signals to short orders due to an expected downtrend reversal.
- When the Stochastic indicator compares the current currency pair price line being near the lowest price levels, it indicates that the currency pair is closing near the low level and signals to long orders due to an expected uptrend reversal.
How to read the Stochastic Indicator
The Stochastic indicator provides values between 0 to 100:
- Above 80: It signals that the currency pair is trading near its highest level in an uptrend. It is an overbought currency pair situation that signals to short orders due to an expected downtrend reversal.
- Below 20: It signals that the currency pair is trading near its lowest level in a downtrend. It is an oversold currency pair situation that signals traders to long the order due to an expected uptrend reversal.
- Between 50 and 80: indicates that the currency pair is trading within the upper portion of the high-low range, and there is a potential uptrend continuation to follow.
- Between 0 to 50: it indicates that the currency pairs are trading within the lower portion of the high-low range, and there is a potential downtrend continuation to follow.
If the Stochastic indicator touches 80 but immediately falls below 50, it signals that the currency pair has started trending in a downtrend, and traders can short the orders. If the Stochastic indicator touches 20 but immediately rises above 50, it indicates that the currency pair has started trending in an uptrend, and traders can long the orders.
*This is an example only to enhance a consumer's understanding of the strategy being described above and is not to be taken as Blueberry providing personal advice.
What is the Stochastic Indicator formula?
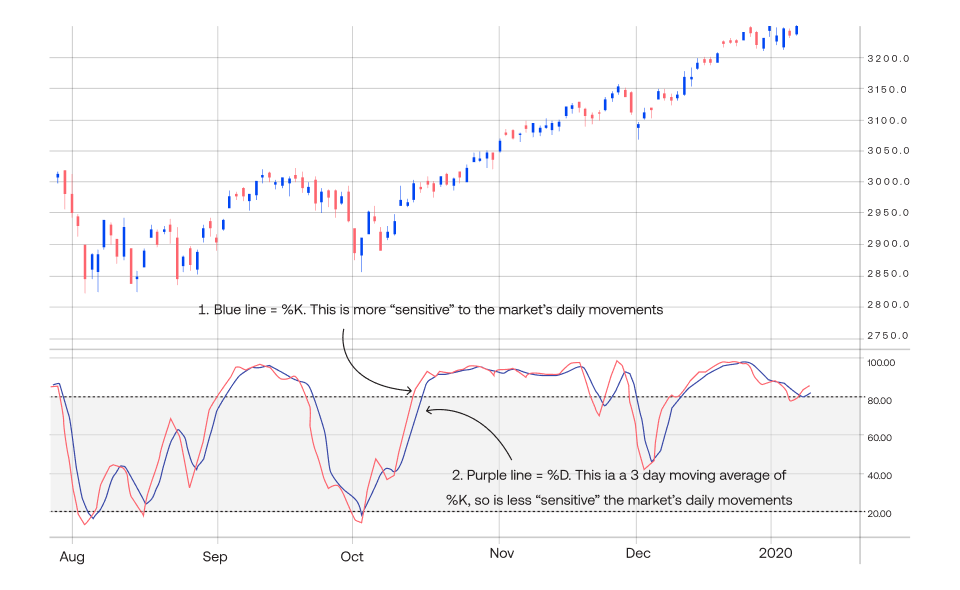
The Stochastic Indicator consists of two lines – K and D. The K line is used to compare the lowest of the low and highest of the high price levels of a currency pair in the last 14 periods (days, weeks, months or an intraday time period) to define the currency pair’s price range. After the price range is defined, it displays what percentage of the range was the last closing price.
- A higher percentage shows that the closing price is near the high price, signalling an overbought market condition.
- A lower percentage shows that the closing price is near the low price, signalling an oversold market condition.
The D line is the 3-period simple moving average of K, and it helps in smoothing out the trendlines that generate trade signals. Calculating K = 100 * (CP – L14 / H14 – L14) Where, CP = Recent closing price L14 = Lowest price of the previous 14 trading periods H14 = Highest price of the previous 14 trading period Calculating D = 100 * (H3/L3) or a 3-day simple moving average of K Where, H3 = Highest price in the last three trading sessions L3 = Lowest price in the last three trading sessions
Benefits of trading with the Stochastic Indicator
1. Provides strong market turning points
The Stochastic Indicator predicts market turning points or reversals by comparing a currency pair’s current closing price with its price range. If the prices close near the high or low price in the range, it signals a market reversal.
- If the currency pair is trending in the upward direction, its closing price will be nearer to the high price, signalling a downward market turning point.
- If the currency pair is trading in the downward direction, its closing price will be nearer to the low price, signalling an upward market turning point.
2. Helps traders time their entries better
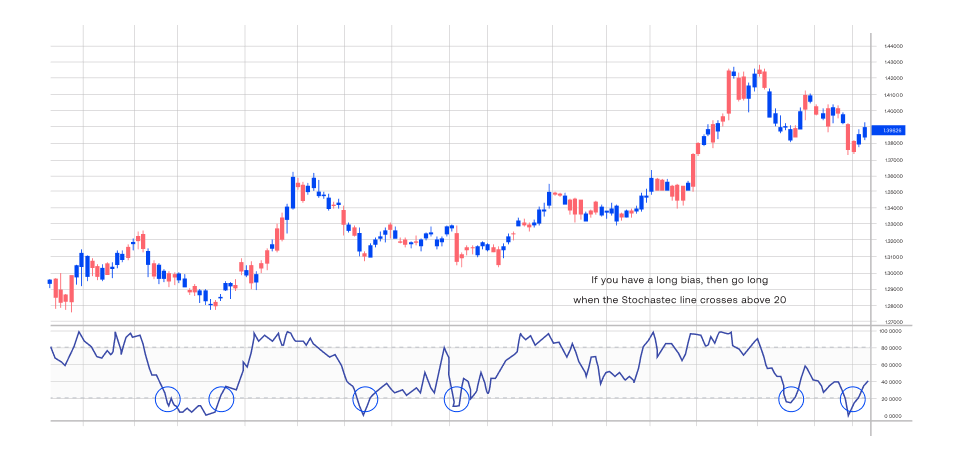
The Stochastic Indicator helps traders time their entries as it provides them with potential signals as to when an uptrend will end in the overbought market and when a downtrend will end in the oversold market.
- If you want to enter a long trade, it is recommended to enter the market when the Stochastic line crosses above the level of 20.
- If you want to enter a short trade, it is recommended to enter the market when the Stochastic line crosses below the level of 80.
3. Filters high probability trading setups
High probability trading setups are in the same direction as the overall currency pair price trend. Filtering high probability trading setups requires a trader to trade in a longer timeframe, with the market direction and not against it.
- When a market is in an uptrend, it sends a buy signal to traders.
- When a market is in a downtrend, it sends a sell signal to traders.
The Stochastic Indicator can be used to filter short-term trades by considering the currency pair’s long-term positioning.
Top Stochastic Indicator trading strategies
Divergence strategy
The Stochastic indicator Divergence strategy keeps a close eye on the currency pair’s current price and checks if the prices are making any new highs or lows. A divergence in the market helps identify any potential market reversal that can occur.
- A bullish divergence occurs when the currency pair price makes a lower low, but the Stochastic indicator makes a higher low, indicating an uptrend reversal.
- A bearish divergence occurs when the currency pair price touches a higher high level, but the Stochastic indicator touches a lower high, indicating a downtrend reversal.

Oversold/Overbought strategy
The Oversold/Overbought strategy is a popular stochastic forex trading strategy that helps identify entry and exit levels.
- An oversold market condition occurs when the Stochastic indicator provides a reading below 20. You should place a buy order when the market is oversold due to a potential market reversal and rise thereafter.
- An overbought market condition occurs when the Stochastic indicator provides a reading above 80. You should place a sell order when the market is overbought due to a potential market reversal and fall thereafter.

Crossover strategy
The Stochastic indicator Crossover strategy is when the two lines in the indicator cross each other in an oversold or overbought market condition.
- When the %K line is trending upwards and crosses the %D line from above in an oversold market condition, it indicates a bullish continuation and signals traders to buy the order.
- When a falling %K line crosses the %D line from below in an overbought market condition, it indicates a bearish continuation and signals traders to sell the order.
How to trade with the Stochastic Indicator
Trading with the Stochastic Indicator completely depends on where the stochastic lines are trending. If it is trending above 80 and indicating an overbought market condition, traders are signalled to exit the market. If it is trending below 20 and indicating an oversold market condition, traders are signalled to enter the market. Let us understand this with an example. If USD/EUR’s price range is 1.2-2.5, with 2.5 being the highest price in that period, and its current price closes at 2.3, it shows an overbought market situation and signals traders to exit the market as soon as possible. On the other hand, if the same pair closes at 1.4 (which is closer to its lowest price of 1.2), it shows an oversold market situation and signals traders to enter the market as soon as possible.
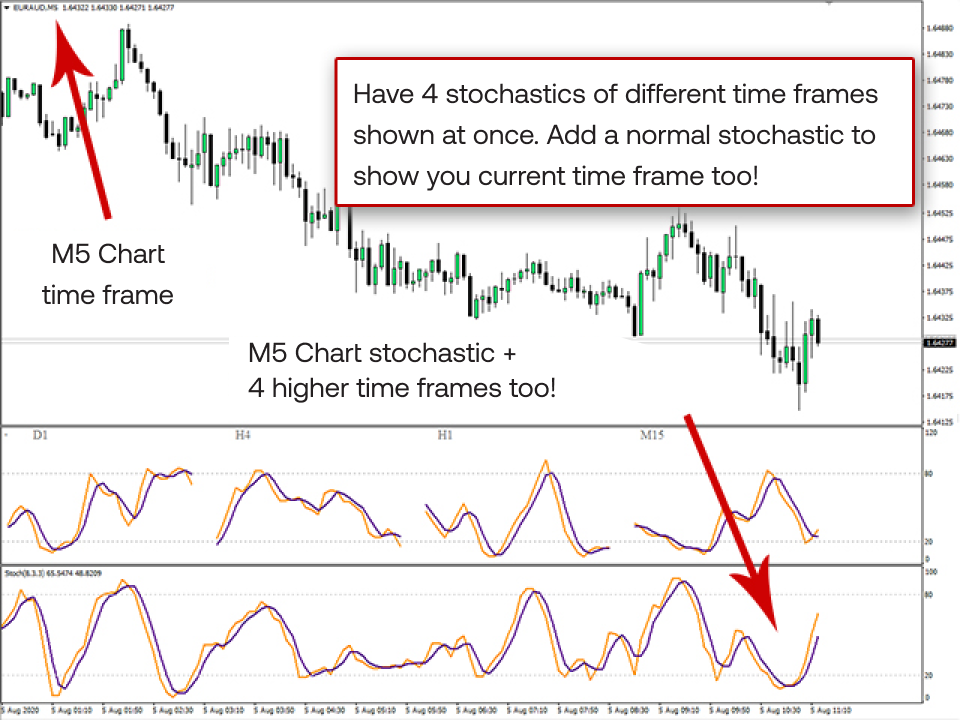
Using stochastics with different timeframes
Stochastics is a price momentum oscillator that measures the position of a closing price relative to its high-low range over a specified period. It identifies overbought and oversold conditions and potential price trend reversals.
The key to using stochastic indicator is to understand how different timeframes can provide varying insights:
Short-term timeframes (such as 5-minute, 15-minute)
- Fast-moving: These timeframes provide quick stochastic signals, making them suitable for short-term traders
- Noise: Can be noisy due to rapid price fluctuations on the price chart, leading to false signals
- Scalping: Often used for scalping strategies, where traders aim to gain from small price movements
Intermediate timeframes (such as 30-minute, 1-hour)
- Balanced approach: Offer a balance between sensitivity and less noise
- Trend identification: Can be effective for identifying trends and potential reversals
- Day trading: Suitable for day traders who hold positions for a portion of the trading day
Long-term timeframes (such as 4-hour, daily)
- Smoother signals: Provide smoother signals, reducing the impact of short-term noise
- Trend confirmation: Can be used to confirm longer-term trends and potential major reversals
- Swing trading: Ideal for swing traders who hold positions for several days or weeks
By comparing stochastic indicator on different timeframes, traders can identify potential divergence between short-term and long-term momentum. This can provide valuable insights into the underlying trend. For instance, if the stochastic indicator on a shorter timeframe shows a bullish signal but on a longer timeframe indicates a bearish trend, it could suggest a potential divergence and a potential reversal. Conversely, a bullish signal on both timeframes can strengthen the bullish trend.
Benefits and risks and using the stochastic indicator
Benefits
Identifies overbought and oversold conditions
Stochastic indicator is a tool for identifying when a market is overbought or oversold. When the stochastic value reaches extreme levels (such as above 80 or below 20), it suggests that the market may be due for a correction. This can help traders avoid entering currency pairs at overvalued prices or exiting them at undervalued prices.
Provides momentum signals
The Stochastic indicator can also be used to gauge a market's momentum. A rising stochastic value indicates increasing momentum, suggesting a potential uptrend. Conversely, a falling stochastic value indicates decreasing momentum, suggesting a potential downtrend. This can help traders time their entries and exits more effectively.
Works well with trend-following
Stochastic indicator is used for trend-following strategies. By identifying overbought and oversold conditions, traders can use stochastics to confirm trends and spot potential reversals. For example, if a market is in an uptrend and the stochastic value is oversold, it may signal a short-term pullback within the overall uptrend.
Identifies divergences
A divergence occurs when there's a mismatch between the price direction and the stochastic indicator. This can signal a potential trend reversal. For example, a bullish divergence happens when the price makes a new low, but the stochastic fails to make a new low and vice versa. By analyzing these bullish and bearish divergences, traders can potentially identify turning points in the market.
What is a Stochastic Oscillator?
Risks
Lag
One of the main drawbacks of the stochastic indicator is that it can lag behind opening and closing price movements. The indicator may not provide timely signals, especially during rapid market moves.
False signals
Stochastics can generate false signals, particularly in choppy markets or during periods of high volatility. This can lead to unnecessary trades and losses.
Overreliance
Relying solely on the stochastic indicator can be risky, so using the indicator in conjunction with other technical analysis tools and fundamental analysis to make informed trading decisions is essential.
Limited predictive power of stochastics
While the stochastic indicator can be helpful, it doesn't confirm future price movements. Its accuracy can vary based on market conditions and timeframes. The indicator is based on historical data and does not have inherent predictive capabilities.
What is a Stochastic Oscillator?
A Stochastics Oscillator, also known as a Stochastic indicator, is a momentum indicator that can predict market reversals by measuring the currency pair’s price momentum in the market. It oscillates between the 0 to 100 range and identifies overbought and oversold market conditions. Since price momentum is the accelerated rate by which the price changes in the market, it provides traders with the ideal levels at which the currency pair can change its trend direction.
What is the difference between Stochastic and RSI?
Both RSI and Stochastic indicators are price momentum indicators that can identify market trends. However, the main difference between the two is that the Stochastic indicator measures the price moment based on support and resistance levels. In contrast, the RSI indicator is based on the average profits and losses in a particular period. The Stochastic indicator compares the currency pair prices to its high-low range, whereas the RSI directly predicts overbought and oversold market conditions to trade.
Stochastic Oscillator vs. Relative Strength Index (RSI)
Calculation method
RSI calculates the average gain and loss over a specified period. It compares the average gain to the average loss to determine relative strength. On the other hand, the stochastic indicator formula compares the closing price to the low-high range over a specified period. It calculates the percentage distance of the closing price from the low.
Interpretation
RSI has oversold readings between 0 and 30. The divergence between RSI and price can signal potential trend reversals. The stochastic oscillator also has similar overbought and oversold readings, but the crossovers/divergences occur between the fast and slow stochastic lines, signaling potential trend reversals.
Sensitivity
RSI is generally less sensitive to short-term price fluctuations. Hence, it is more suitable for identifying longer-term trends and potential reversals. In contrast, SO is more sensitive to short-term price fluctuations and can provide quicker signals but may also be more susceptible to false breakouts.
Use cases
RSI is suitable for identifying overbought/oversold conditions, trend reversals, and momentum. It is often used with other indicators for a more accurate technical analysis. On the other hand, stochastic oscillators identify overbought/oversold conditions and short-term trend reversals and can be useful for scalping and day trading strategies.
Signal strength
The speed and magnitude of the price movements can determine the signal strength of RSI signals. On the other hand, the signal strength of stochastic can be determined by the distance of the indicator from the overbought/oversold levels.
False signals
RSI generates false signals, especially during choppy markets or periods of high volatility. Meanwhile, SO generates false signals, particularly when used in shorter timeframes.
Mean reversion and momentum
RSI is more focused on mean reversion, suggesting that prices will eventually revert to their average. This makes it suitable for traders who believe markets are efficient and tend to correct overbought or oversold conditions. On the other hand, the stochastic Oscillator is more focused on momentum, measuring the speed and direction of price changes on the price chart. This makes it a tool that is able to identify trends and potential reversals.
Make the most with the Stochastic Indicator
Stochastic Indicator helps traders understand when a market is overbought or oversold and make trade decisions accordingly. Blueberry. is a forex trading platform that provides you with a reliable trading experience with the help of readily accessible strategies and charts. Sign up for a live trading account or try a demo account.