


Advanced forex trading strategies are perfect for experienced forex traders. If you already have the basics down, moving forward with advanced trading strategies can give you an edge over other forex traders. In this article, we will cover the top advanced forex trading strategies.
What are advanced forex strategies?
Advanced forex trading strategies depend on long-term market analysis and provide you with strong price points where you can enter or exit the market. They involve several technical indicators and strategies that help identify ideal price levels. These trading strategies require close monitoring of the market and expertise in forex. Hence, such strategies are mostly used by traders who have experience in the forex market already.
Top advanced forex trading strategies
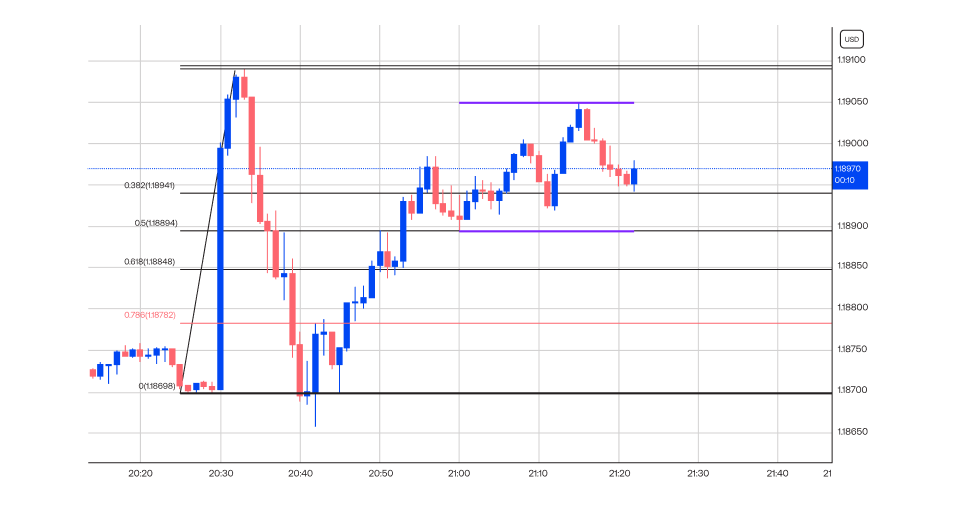
Counter trading
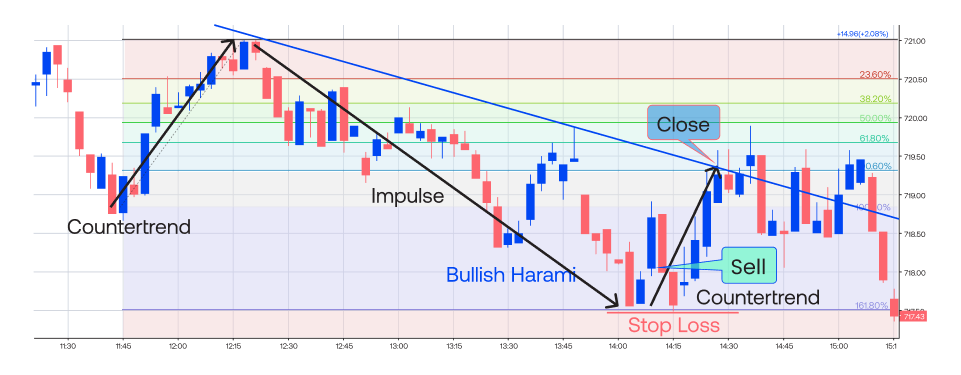
Counter trading in forex refers to trading against the market. When the current market trend is weak, the possibility of a market reversal is more. In this situation, traders have an opportunity to open an opposite position in the market.
To counter trade, you need to identify a candle that is in the opposite direction in the market, which means a red candlestick during an uptrend and a green candlestick during a downtrend. When more than two such candles appear, it signals to you that there is going to be a temporary reversal in the market.
At this point, you can enter the market at the low-price level of a red candlestick and exit at the high of a green candlestick. Stop loss signals are generated by comparing the counter trend move and the trend impulse line (which indicates the current market direction). Set a stop loss above the top and below the bottom price level between the counter trend line and trend impulse line.
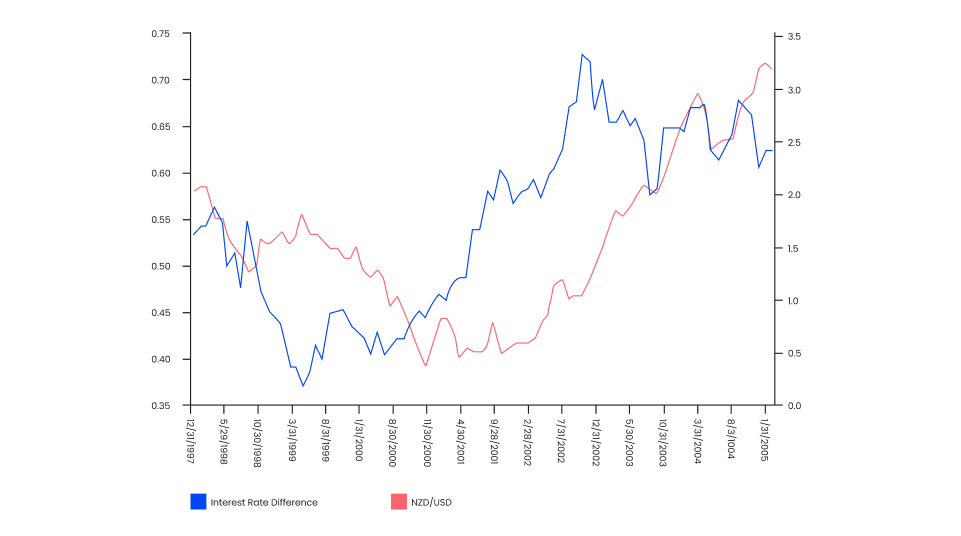
Swap Trading
Currency swap trading involves keeping a forex position open overnight. The interest you pay for the trade or earn from the trade is called a swap. There are two types of swaps you can trade, swap long (when you keep long positions open overnight) or swap short (when you keep short positions open overnight). With this trading strategy, when you notice a continuous uptrend in a currency pair, you can keep a long position open overnight as it is likely to earn interest. On the other hand, to avoid paying interest on short orders, you can keep it open overnight during a continuous downtrend.
Swaps are considered on both currencies in the currency pair.
For example, let’s assume you are trading EUR/USD, where interest on EUR is +0.50, and the same on USD is -0.49. If you short EUR/USD is 1000 units and keep the position overnight, the next day, you will have a total swap calculated as +0.50 (interest earned) – 0.49 (interest paid) = $0.01 per unit, or $0.01*1000 = $10 for the entire trade position open overnight.
You can buy or long the currency with a high-interest rate while selling or shorting the currency with a low-interest rate. The difference between the two interest rates after the overnight position is closed will be your interest earnings from the trade apart from the gains made through the price difference. You can also keep the positions open for more than one night and multiply your interest earnings similarly if the market continues to move in your favour.
Cross Currency Triangulation
Cross-currency triangulation is a type of forex strategy where one currency is concentrated into another currency via a common currency. This strategy is most useful to deal with currency pairs not involving the USD and utilises the difference between the bid-ask spread between the exchange rates of non-USD currency pairs.
When you want to trade a currency but want the gains to come back in their home currency, you can use this strategy to convert the different currencies into your home currency. Let us consider that you are a trader in Europe wanting to enter into a triangulation trade with EUR/GBP, GBP/CHF and EUR/CHF. GBP/CHF will be quoted in the form of EUR/GBP and EUR/CHF, making the base currencies in EUR/CHF and EUR/GBP equal to the base currency in GBP/CHF.
Assuming GBP/CHF bid = (EUR/CHF bid)/(EUR/GBP offer).
And GBP/CHF offer = (EUR/CHF)/(EUR/GBP bid) Both will give a certain percentage rate calculated in euros.
Whatever gains you will make by trading GBPs and CHFs will be converted into EUR before coming into your bank account automatically. This will minimise the time that you may have to spend on converting the gains from one currency to another after they are earned.
Arbitrage Trading
Forex arbitrage trading is a strategy that takes advantage of the price difference of the currency pair’s exchange rates in different forex markets or by trading the disparities between multiple currency pairs. In the first case, if the currency pair EUR/USD costs 1 in forex market A whereas it costs 1.2 in forex market B, the trader buys more in forex market A and sells more in forex market B to make a successful trading order.
Arbitrage trading is preferred when there are important news or financial events like disclosing the country’s union budget. This is because, during this time, the exchange rates are most volatile, and gains can be made by trading different currencies simultaneously. Taking advantage of price inefficiencies is a quick task, and all orders must be opened and closed in a short-term timeframe.
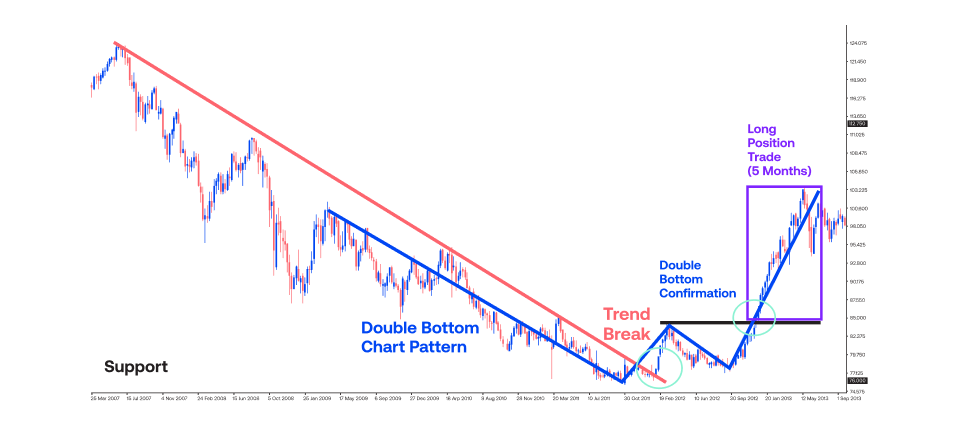
Position Trading Strategy
Position trading strategy enables traders to execute, hold and maintain a position in the forex market for a long-term time frame. This involves rigorous monitoring and analysis of the market along with future market predictions while entering any trade. When a position trade strategy is employed, you must keep a close eye on the market on a daily basis to note any minor or major price fluctuations.
With position trading, you enter a long position during a long-term uptrend when the market prices have been rising for the past month with an expectation of market continuation. Unless the market shows signs of reversal, you hold onto the long position. On the other hand, you enter a short position during a short-term uptrend when the market prices have been falling for the past month. Unless the market shows signs of reversal, you hold onto the short position.
Using the support and resistance lines helps you place successful position trading orders.
- When the market prices trade around but are above the support level for a long time, it indicates a continuous downtrend and signals you to place short orders.
- When the market prices trade around but below the resistance level for a long time, it indicates a continuous uptrend and signals you to place long orders.
Non-Farm Payroll (NFP) Trading
Non-Farm Payroll or NFP is one of the most important news events in the US that is released every month that tells the changes in the US economy’s job market over the last month, excluding farm workers, non-profit employees and private household employees.
The news release impacts the USD in the forex market and similarly other currencies. It is mostly used by day traders right around the NFP new releases. The market starts fluctuating a few hours before the NFP event takes place, and the direction may be changed right after the news is released.
If the market is in an uptrend before the news release but starts moving downwards right after the release, you can place a short order to benefit from the falling markets. On the other hand, if the market is in a downtrend before the release but starts rising after the release, you can place long orders to benefit from the rising market.
If the market continues in the same direction as it was before the NFP release, you can hold onto your existing positions considering the news event did not create a reversal impact on the market.
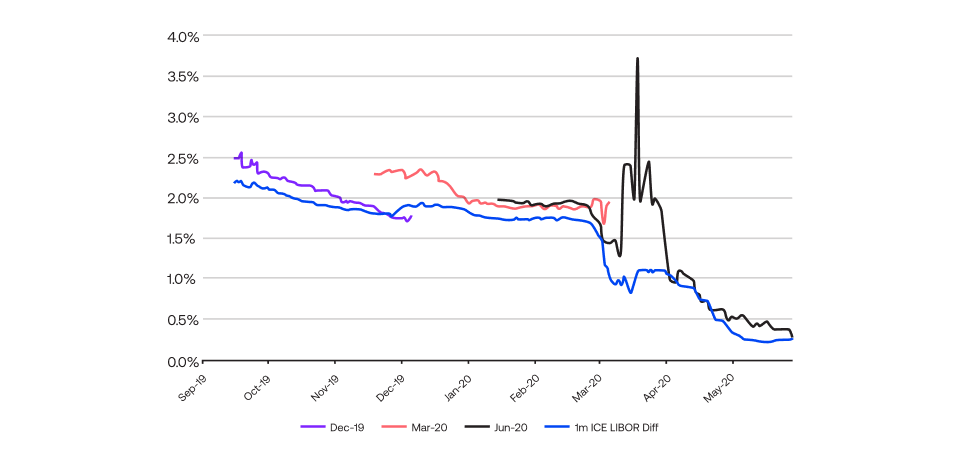
Bonds Spreads Trading
The bond market is a strong indicator of the price movement in the forex market due to the relationship between currencies and bond spreads. When the prices of bonds are lower, it depicts higher interest rates. This, in turn, means that investing in currencies is more beneficial, which leads to an increment in exchange rates. So, there stands an inverse relationship between bond and currency prices.
A bond spread refers to the difference in yields of two bonds hailing from different currencies. If the bond spread between the UK and the US (EUR/USD) is higher, this means that the exchange rate for EUR is rising, whereas that for the UK is falling, enabling traders to buy more EUR and sell more USD.
On the other hand, if the same bond spread between these two currencies is lower, which means that yield from EUR is less than the yield for the USD, this means that interest rates from USD are higher than interest rates from the EUR. This enables traders to buy more of the USD and sell more of the EUR to benefit from the bond spread strategy.
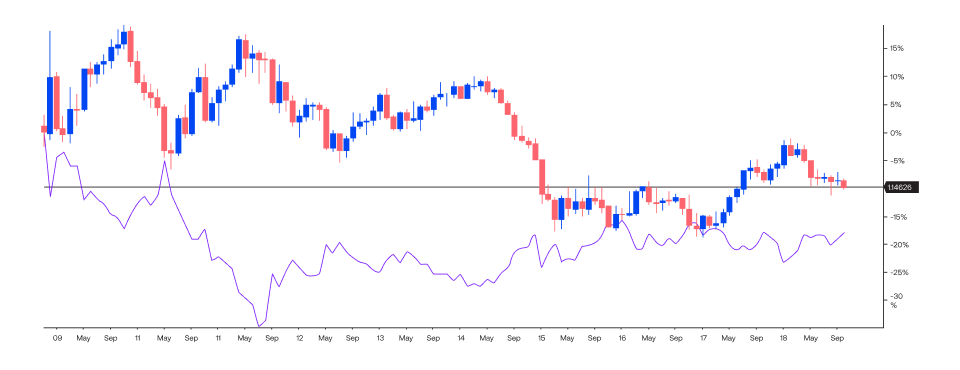
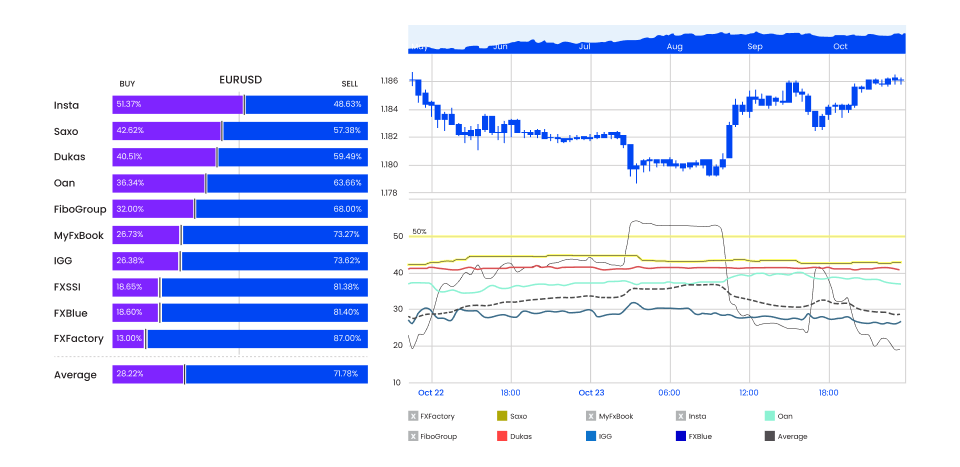
Open Position Ratio
The open position ratio is the percentage of each major currency’s open positions relative to the total open positions for all the pairs on the forex platform. This ratio is different on all trading platforms and provides you with information about the open interest in the forex market. By using this strategy, you can understand the currencies on which most investors are focusing and open a position in the same pairs.
The analysis is done by also combining this analysis with the currency’s trade volume. The higher the volume and open position ratio, the better the chance to open a long position for the currency pair in the market due to an uptrend expectation. However, if the volume is high, but the open position is low, you can open short positions in the market due to a downtrend expectation.
For example, if you want to choose between EUR/USD and GBP/USD to trade, you can compare their open ratios in the market. If the open ratio for EUR/USD is 30 whereas that for GBP/USD is 25, it means that the former represents 30% of all the open positions on the platform right now and the latter only represents 25%. Since EUR/USD is being more focused on, at the momentum, you can open a long position during a continuous uptrend to place a successful trading order.
Algorithmic trading
Algorithmic trading involves using computer programs to execute trades based on predefined rules and algorithms. These algorithms can analyze vast amounts of data, identify patterns, and execute trades at speeds far surpassing human capabilities.
For example, an algorithm might be programmed to detect when a certain price level is reached for a currency pair and then automatically place a long or short order. This allows for more objective and efficient trading, reducing the impact of emotional factors that can often lead to poor decision-making.
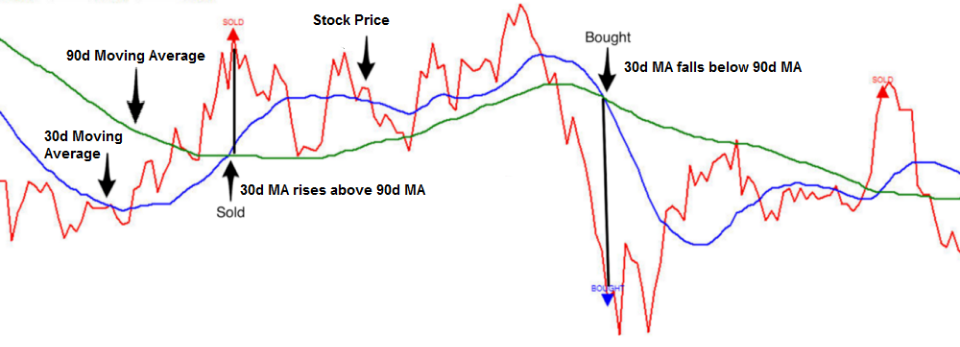
A trend-following algorithm can automatically enter a long position when the price crosses above a moving average and exit when the price crosses below the same moving average.
High-Frequency Trading (HFT)
High-frequency trading is a specialized form of algorithmic trading that involves executing a large number of trades very quickly to capitalize on tiny price movements. HFT firms use advanced technology and low-latency networks to achieve this, often executing thousands or even millions of trades per day.
HFT firms also use co-location services to place their servers physically close to the exchanges where they trade, reducing latency and improving execution speed. However, the high-speed nature of HFT can also increase the risk of errors and forex market manipulation.
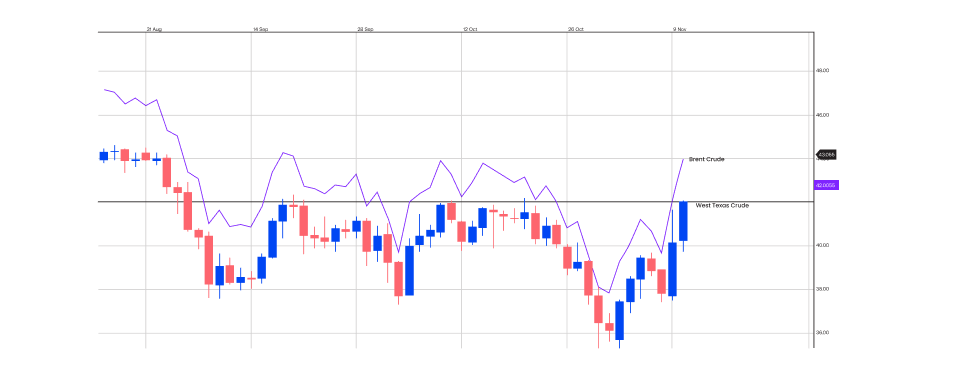
Cointegration trading
Cointegration trading involves identifying statistically related currency pairs and trading based on their mean reversion properties. This means that even if the prices of the assets diverge in the short term, they are likely to converge back to their long-term relationship over time. To identify cointegrated pairs, traders often use statistical methods such as –
- Engle-Granger test: This test determines if two-time series are cointegrated
- Johansen test: This test can identify multiple cointegration relationships within a system of variables
For example, a cointegration trader might identify a relationship between the EUR/USD and GBP/USD currency pairs. If the EUR/USD appreciates significantly relative to the GBP/USD, the trader might expect the EUR/USD to eventually depreciate to restore the historical relationship.
Carry trade
Carry trade involves borrowing funds in a low-interest-rate currency and investing them in a higher-interest-rate currency. The difference in interest rates is known as the 'carry.' The goal is to gain from the interest rate differential, but this strategy is also exposed to currency risk. To mitigate currency risk, traders may use hedging strategies such as –
- Currency futures: These contracts can be used to hedge against potential losses from currency depreciation.
- Currency options: These contracts can provide insurance against adverse currency movements.
Mean reversion
Mean reversion is a trading strategy that capitalizes on currency pairs' tendency to revert to their long-term averages after experiencing significant deviations. This strategy assumes that overbought or oversold conditions are temporary and prices will eventually return to more sustainable levels.
Traders can use statistical methods and technical indicators to identify mean reversion opportunities. For example, the Bollinger Bands can be used to identify when prices are significantly above or below their historical average. When a trader believes an asset is overbought or oversold, they can enter a trade in the opposite direction, expecting the price to revert to its mean. If a currency pair trades significantly above its 200-day moving average, a trader might short the pair, anticipating it will eventually decline.
Technical analysis for forex trading
Technical analysis is a method of forecasting future price movements based on the study of past price data. It involves analyzing charts and using various technical indicators to identify market trends, patterns, and potential trading opportunities. Some technical analysis indicators include –
- Moving averages: These are calculated by averaging the closing prices of a security over a specific period. Simple moving averages (SMAs) and exponential moving averages (EMAs) are commonly used. Moving averages can help identify market trends and potential support or resistance levels.
- Bollinger bands: These are volatility bands that plot a simple moving average and two standard deviations above and below it. They can help identify overbought or oversold conditions, as well as potential trend reversals.
- Stochastic oscillator: This indicator measures the closing price of a security relative to its high-low range over a specific period. It can be used to identify overbought or oversold conditions and potential trend reversals.
Developing a forex trading strategy
Define goals and risk tolerance
Start by identifying desired gain levels and risk tolerance.
Choose a trading style
Then, select a trading style that suits your trading personality and preference, such as –
- Day trading: Involves trading currencies within the same trading day
- Swing trading: Holding positions for a few days to a few weeks
- Position trading: Holding positions for extended periods, often months or years
Select a trading system
Employ fundamental analysis of economic, political, and social factors influencing currency values. Then, analyze past price data to identify patterns and market trends. Blend the two for a comprehensive approach.
Develop a trading plan
Define entry and exit points and determine when to trade currencies based on the chosen trading system. After that, set stop-loss and take-profit orders to protect capital and lock in gains.
Backtest the strategy
Use historical data to test the strategy against past market data to assess its performance. Based on the backtesting results, make necessary adjustments.
Start with a small account
Begin trading with a small amount of capital to minimize potential losses. Gradually increase trading size as confidence grows.
Conclusion
By combining two or more indicators together, you can get confirmed market signals that enable you to place successful trading orders. However, trading with such advanced trading strategies requires the proper experience, understanding and expertise in the forex market. With Blueberry. forex trading platform, you get access to trading platforms and demo accounts which allows you to trade with confidence. Sign up for a live trading account or try a demo account.