


The Moving Average Crossover is a valuable tool to find the middle price-point of a trend in forex trading. When currency prices crossover their current moving averages, it helps traders identify the favourable buying or selling points for the currency. Since new traders are beginners and do not have much knowledge about the forex market, it gives them a solid basis for their trading strategy. In this article, we discuss everything there is to know about moving average crossover, and more.
What is a moving average crossover?
The Moving Average (MA) Crossover is a forex price chart line indicating market price trends. It occurs when we plot two moving averages based on different timeframes (long-term and short-term), which end up crossing up with each other on a particular point. A crossover always occurs when the shorter period (faster) moving average crosses the longer period (slower) moving average. The short-term moving average is faster because it considers prices only at a short interval; hence the volatility is higher. On the other hand, the long-term moving average is slower because it considers prices over a long period of time and is less reactive to daily prices. If the short-term moving average exceeds or crosses the long-term moving average from above, it is an indication for traders to buy the currency due to a market uptrend signal. But if the short-term moving average crosses the long-term moving average from below, it is an indication to short the position and sell the currency due to the downward trend.
Types of Moving Average Crossover
1. Long-term moving average
A long-term moving average is the currency's average price over a year or more. For example, a 200-day moving average is a long-term moving average that provides you with the long-term trend in the market. You can calculate the long-term moving average by adding all closing prices of the currency pairs in the last year(s) and divide it by the total time period. A long-term moving average smooths out the minor daily price fluctuations and provides you with the overall market’s direction in the last year.
2. Short-term moving average
A short-term moving average is the average price of the currency over less than a year (a few days, weeks or months). For example, a 12-day moving average is a short-term moving average that provides you with the short-term trend in the market. You can calculate the short-term moving average by adding the currency pair’s closing price over the number of days, weeks or months considered and divide it by the total time period. A short-term moving average considers all the price fluctuations that occur daily and is influenced by even the slightest of the price changes. It provides you with the overall market direction that the currency pair has been following over a few weeks and helps you take short-term trading decisions.
Understanding the moving average trading strategy
The moving average trading strategy that we will be discussing uses the exponential moving average. We consider this because the exponential moving average responds quickly to all the price changes. Follow the steps for developing a successful moving average trading strategy –
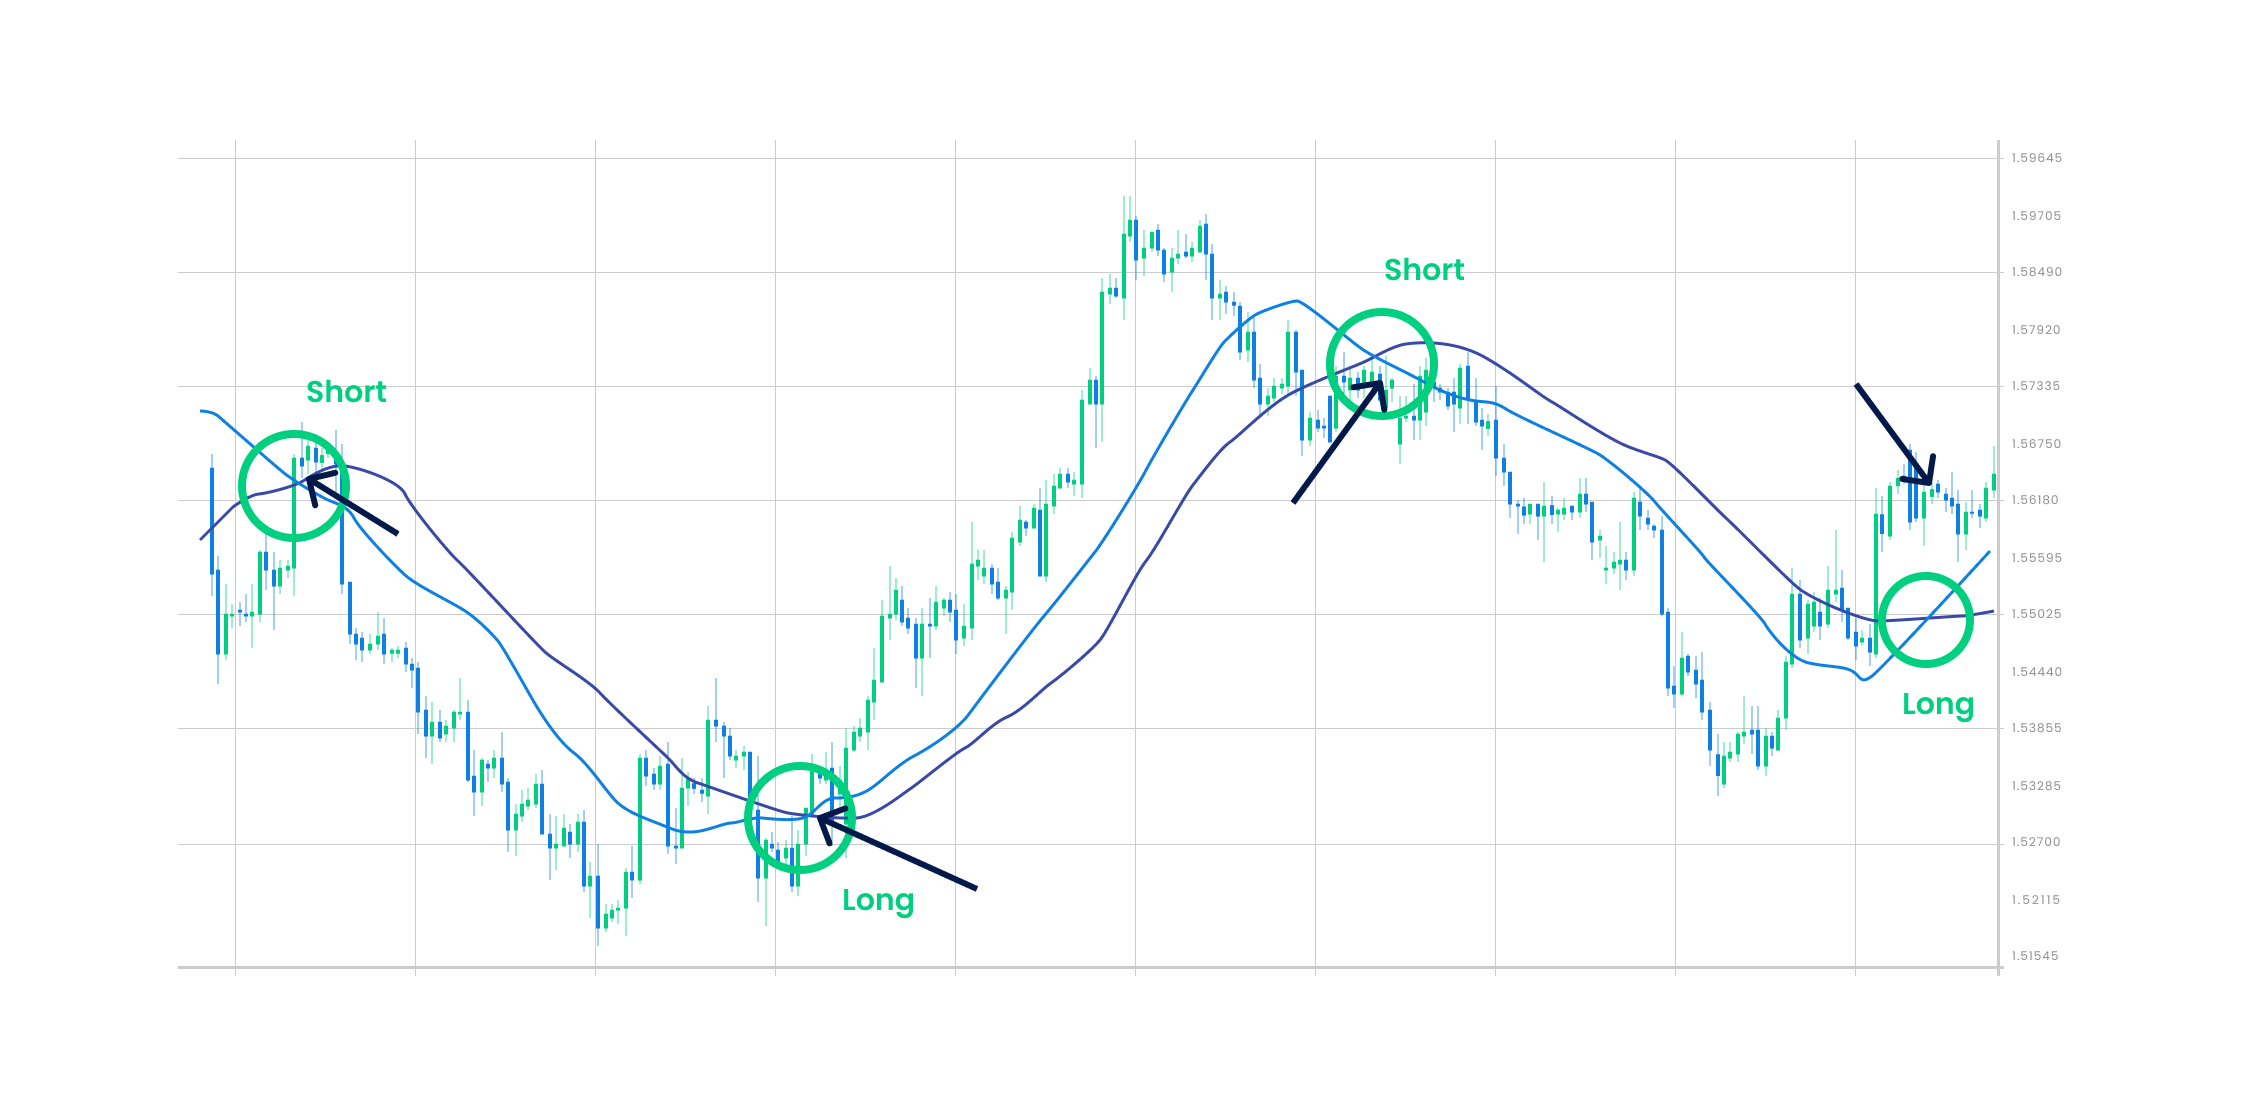
- Plot three moving averages over 3 different periods. Let us consider 5-period, 20-period, and 50-period exponential moving averages on a 15-minute forex chart.
- Enter the market or buy the currency when the 5-period exponential moving average crosses the 20-period exponential moving average from below. Both the 5-period and 20-period exponential moving averages prices should be above the 50-period exponential moving average prices.
- If you wish to identify the selling point or the point to exit the market, only sell when the 5-period exponential moving average crosses the 20-period exponential moving average from above. Both the exponential moving averages and the price of the 5- period and 20-period exponential moving averages should be below the 50-period exponential moving average at this point.
- Ensure that you place a stop-loss order below the 20-period exponential moving average during a buy move.
- You can also move this stop-loss point to a break-even point when the trade becomes 10% more profitable.
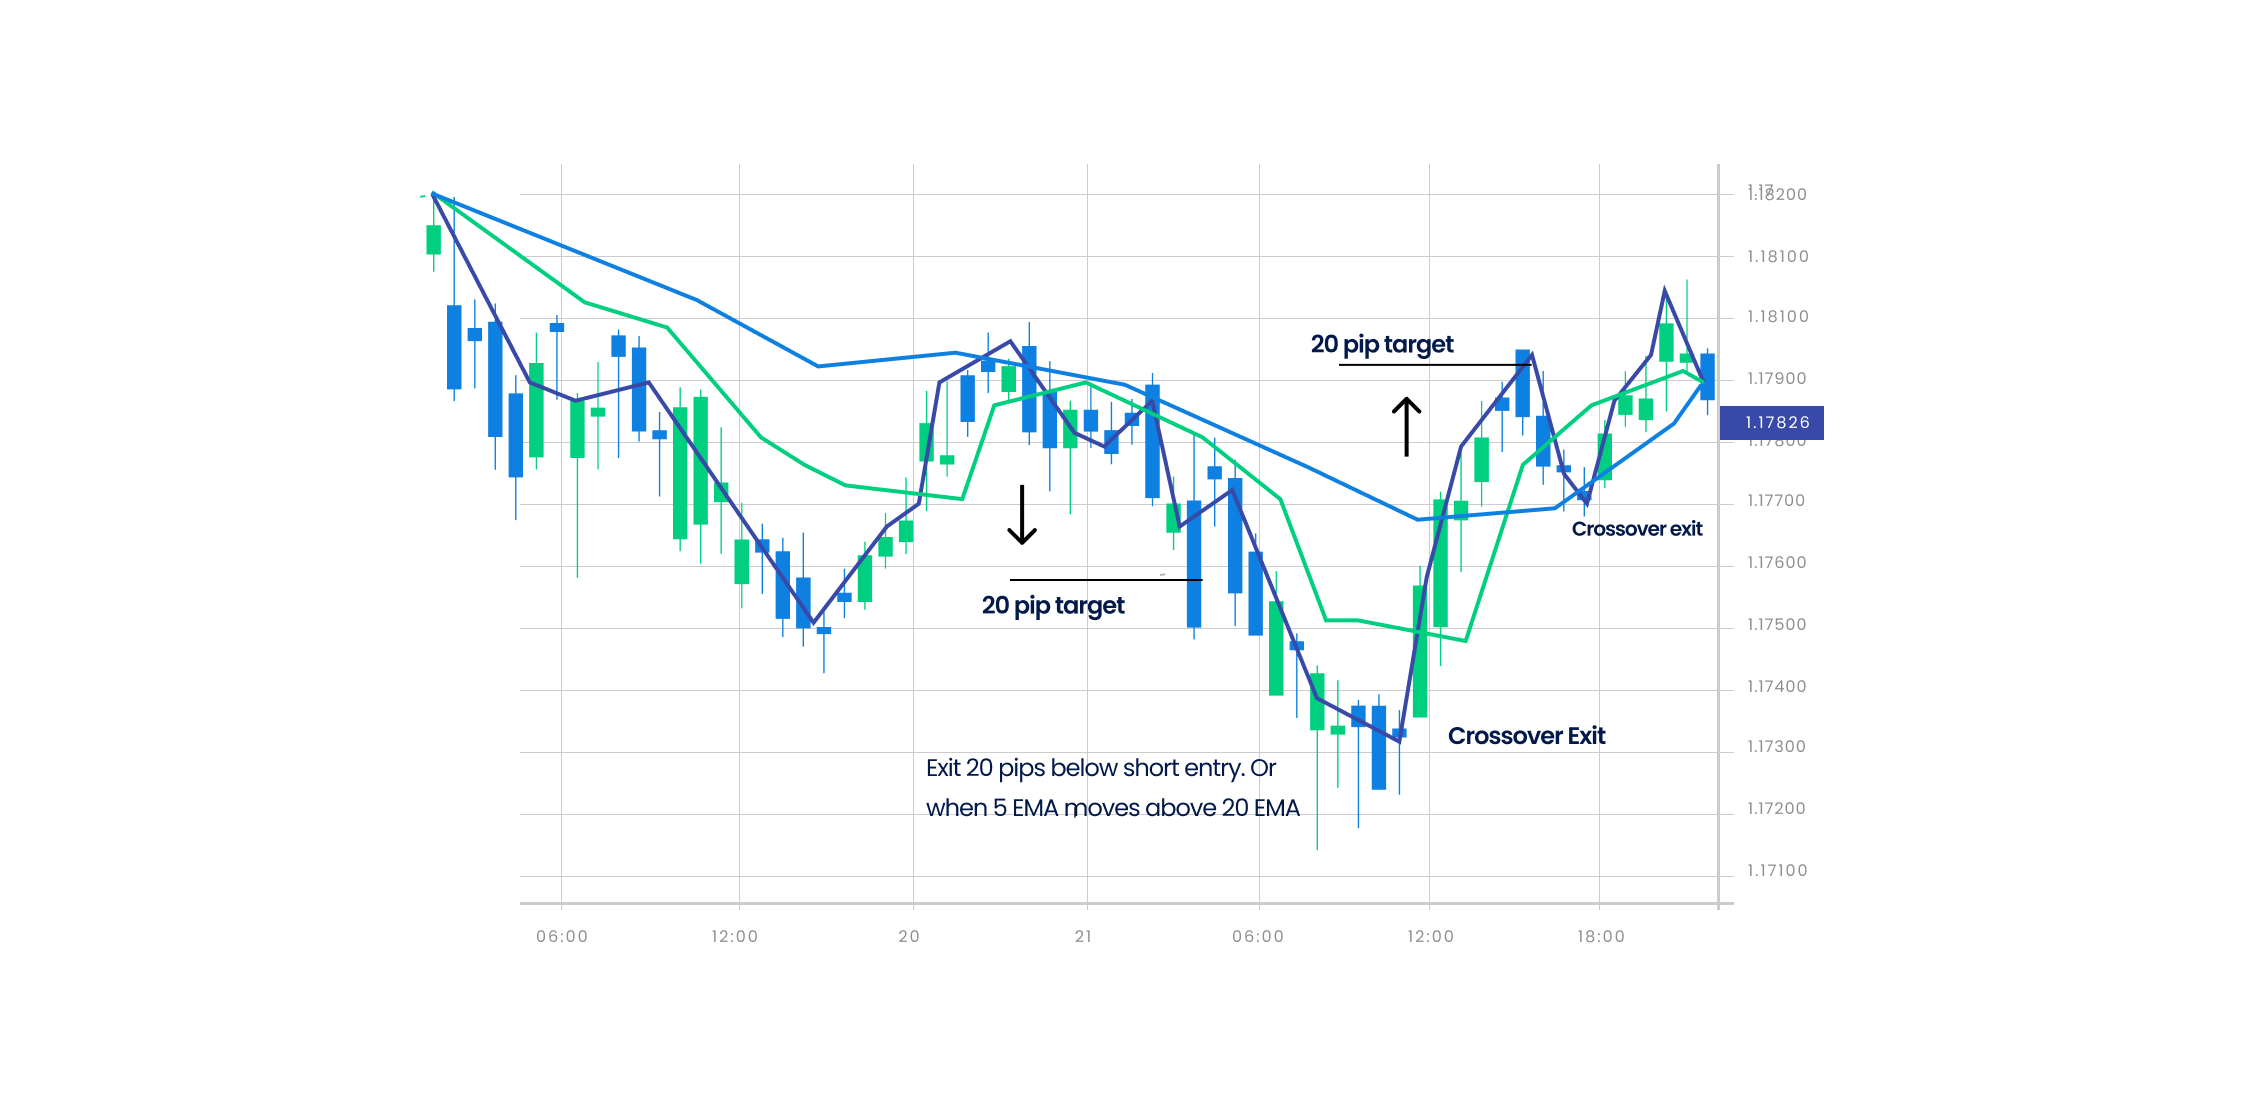
- You can set a profit target of 20% and/or exit when the 5-period exponential moving average line is below the 20-period exponential moving average line.
Understanding Moving Average Envelopes trading strategy
One of the most traded moving average strategies is the Moving Average Envelopes Trading Strategy. These are percentage- based envelopes that are set below and above a particular moving average. Both simple moving average and exponential moving average can be used as the basis of the moving average. However, the exponential moving average is considered a more relevant moving average that presents better results as it reacts more dynamically to the prices. In this trading strategy, forex traders test different percentages, timeframes, and currency pairs in order to understand how one can make the best use of the strategy. Mostly, envelopes are seen over 10 to 100 day timeframes and are 1-10% away from the moving average. During day trading, envelopes are often less than 1%. The percentages change daily depending on the market volatility. Traders should ideally trade when they see a strong overall direction bias to the price, either as an upward or downward trend. Most traders then only trade in that particular direction. In case of an uptrend, traders should consider buying more as the price approaches the moving average point. Whereas, in a downtrend, traders should short-sell their positions as the price reaches the moving average point and then drops further. Once the traders short the position, they should place a stop-loss order just above the recent high price point. In case of a long-trade, a stop-loss order should be placed just below the recent low price point. As soon as the price reaches the lower point on a short trade or the upper point on a long trade, traders should consider exiting the trade to minimise losses. Lastly, it is a good strategy to set targets double the risk. For example, if you risk 5%, set a target of a point that is at least 10% away from the entry point.
Calculating the Exponential Moving Average
Let us consider that you wish to use 20 days as the time period for the exponential moving average. The first step to calculate the exponential moving average is to wait until the last day (in our case, the 20th day) to get the simple moving average of the time period. The next day, the 21st day, the trader can use the simple moving average that they calculated from the 20th day as the first exponential moving average for the previous day. Calculating the simple moving average is extremely easy. Simply sum up the currency's closing prices for the time period and divide it by the total number of observations, which in our case is 20. Next, we calculate the weightage multiplier for the exponential moving average. The weightage multiplier is also called a smoothing. It is derived by dividing the number of observations + 1 by 2. This means, in our case, the weightage multiplier will be [2/(20+1)]=0.0952. Finally, use the formula to calculate the current exponential moving average: Closing price * Multiplier + Exponential moving average of the previous day (calculated as the simple moving average) * (1-multiplier). Higher weight is given to recent prices in an exponential moving average, which is not the case with the simple moving average.
What are Golden Cross and Death Cross?
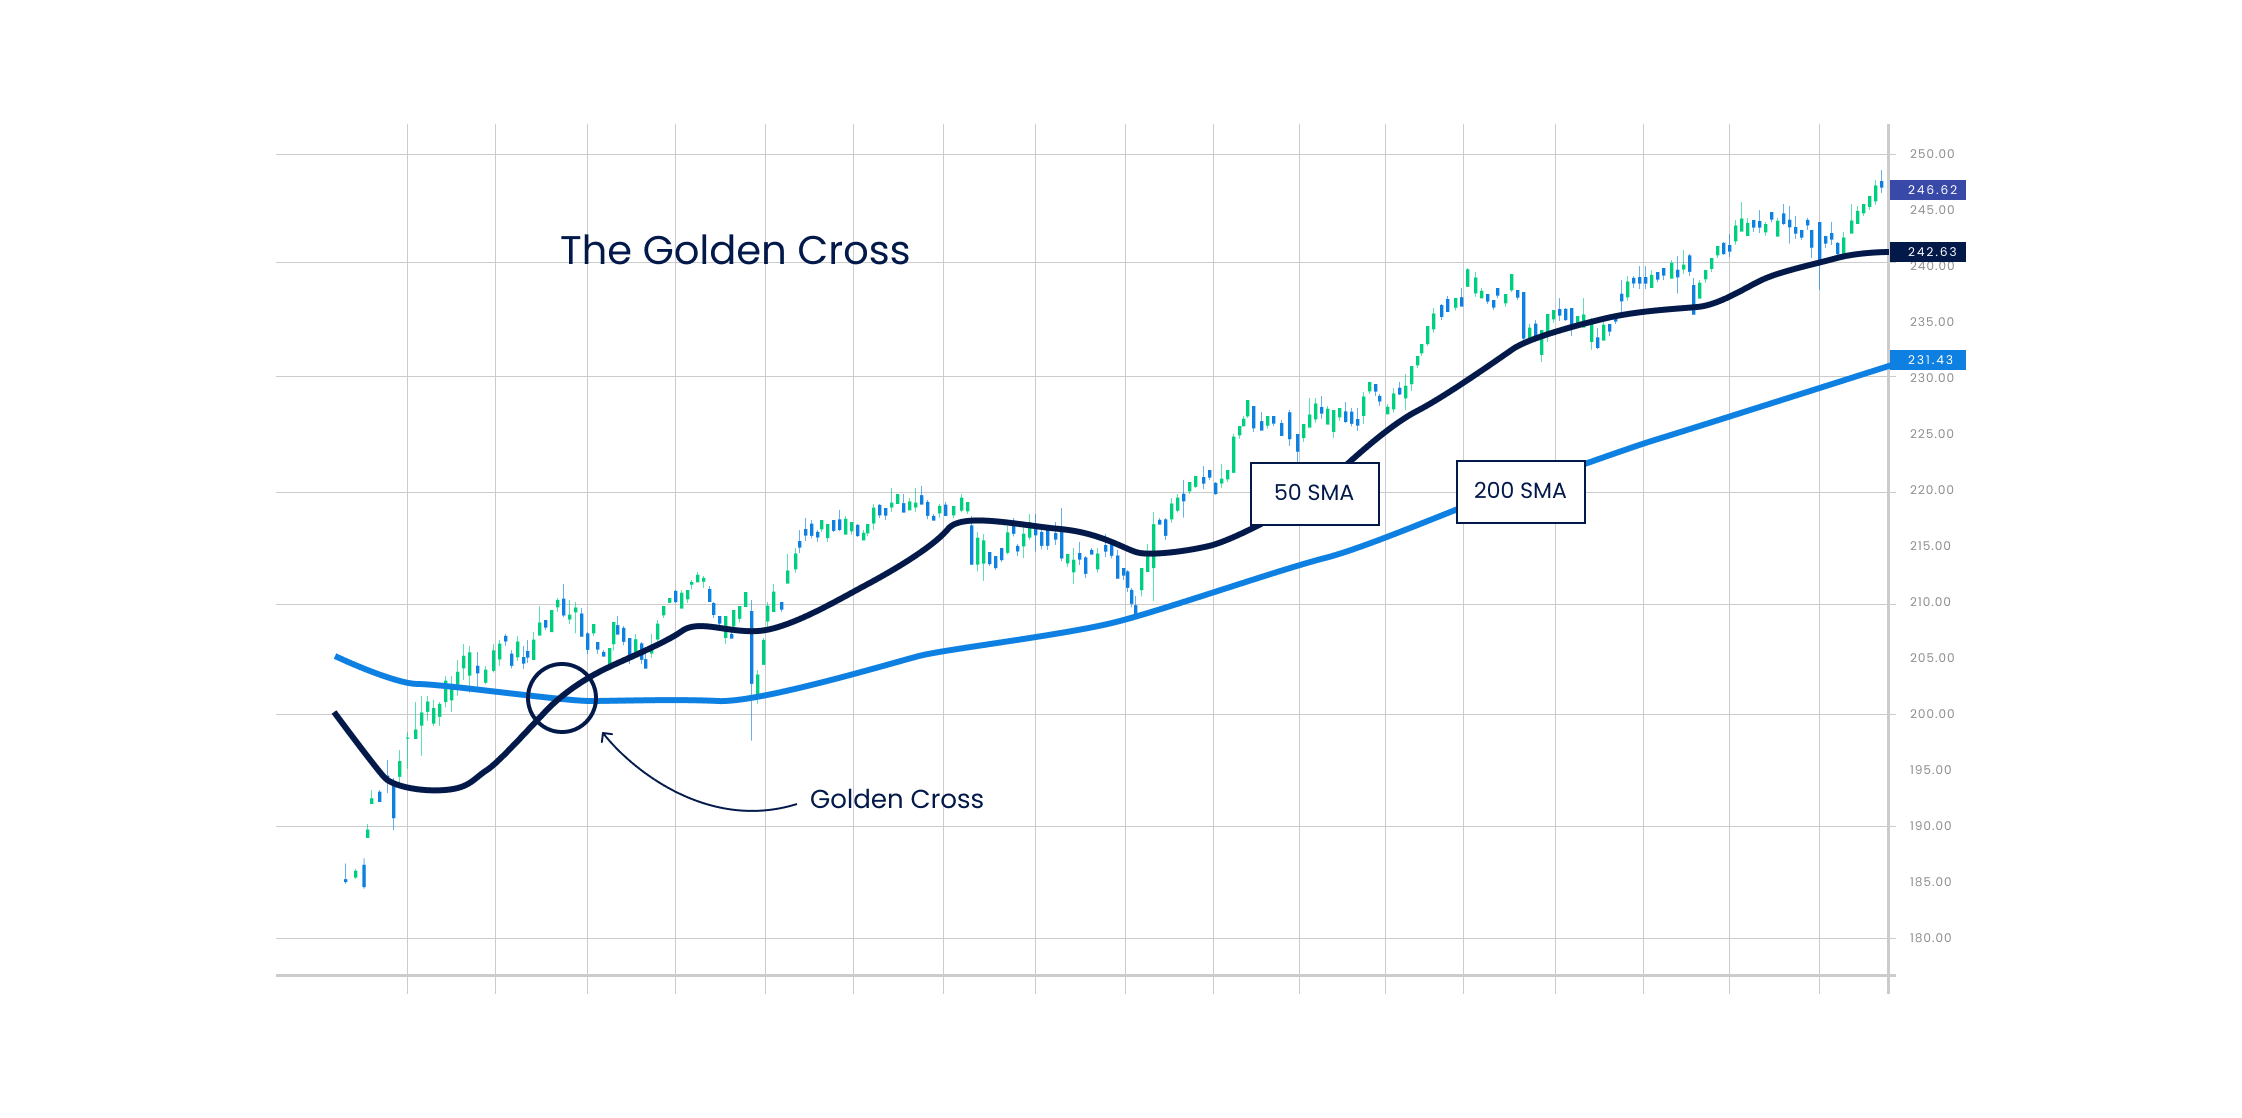
A Golden Cross occurs when the short-term moving average crosses the long-term moving average from above. It indicates an uptrend in the market and that the bulls (buyers) are taking over the bears (sellers). The Golden Cross occurs in three stages –
- It starts when an existing downtrend in the market comes to an end.
- The second stage consists of the short-term moving average crossing the long-term moving average from above.
- The final or third stage refers to an uptrend in the market that leads the currency pairs to trade higher.
A Death Cross is the exact opposite of a Golden Cross, which occurs when the short-term moving average crosses the long-term moving average from below. It indicates a downtrend in the market and that bears are taking over bulls. There are three stages to the Death Cross –
- It starts when an existing uptrend in the market comes to an end.
- The second stage is where the crossover happens.
- The third stage is when the downtrend in the market continues, leading the currency pair prices to trade lower.
What are short timeframe crossover signals?
Short timeframe crossover signals occur in a span of a few weeks or months only. The signals in the short timeframe are more frequent, volatile, and reactive to the latest price changes of the currency pairs.
Top Moving Average Trading Strategies
1. MA Crossover Strategy with Price Action
The MA Crossover Strategy with Price Action is a strategy that helps in finding the midpoint of a trend that provides traders with price signals about when to long or short a trade. The two Moving Averages that can be used in this crossover strategy are the 50- period (short term) moving average and the 200-period (long term) moving average. Whenever the 50-period MA crosses the 200-period MA from above, it indicates a market uptrend and signals traders to enter the market or go long to benefit from the uptrend. Whenever the 50-period MA crosses the 200-period MA from below, it indicates a market downtrend and signals traders to exit or go short to benefit from the falling markets.
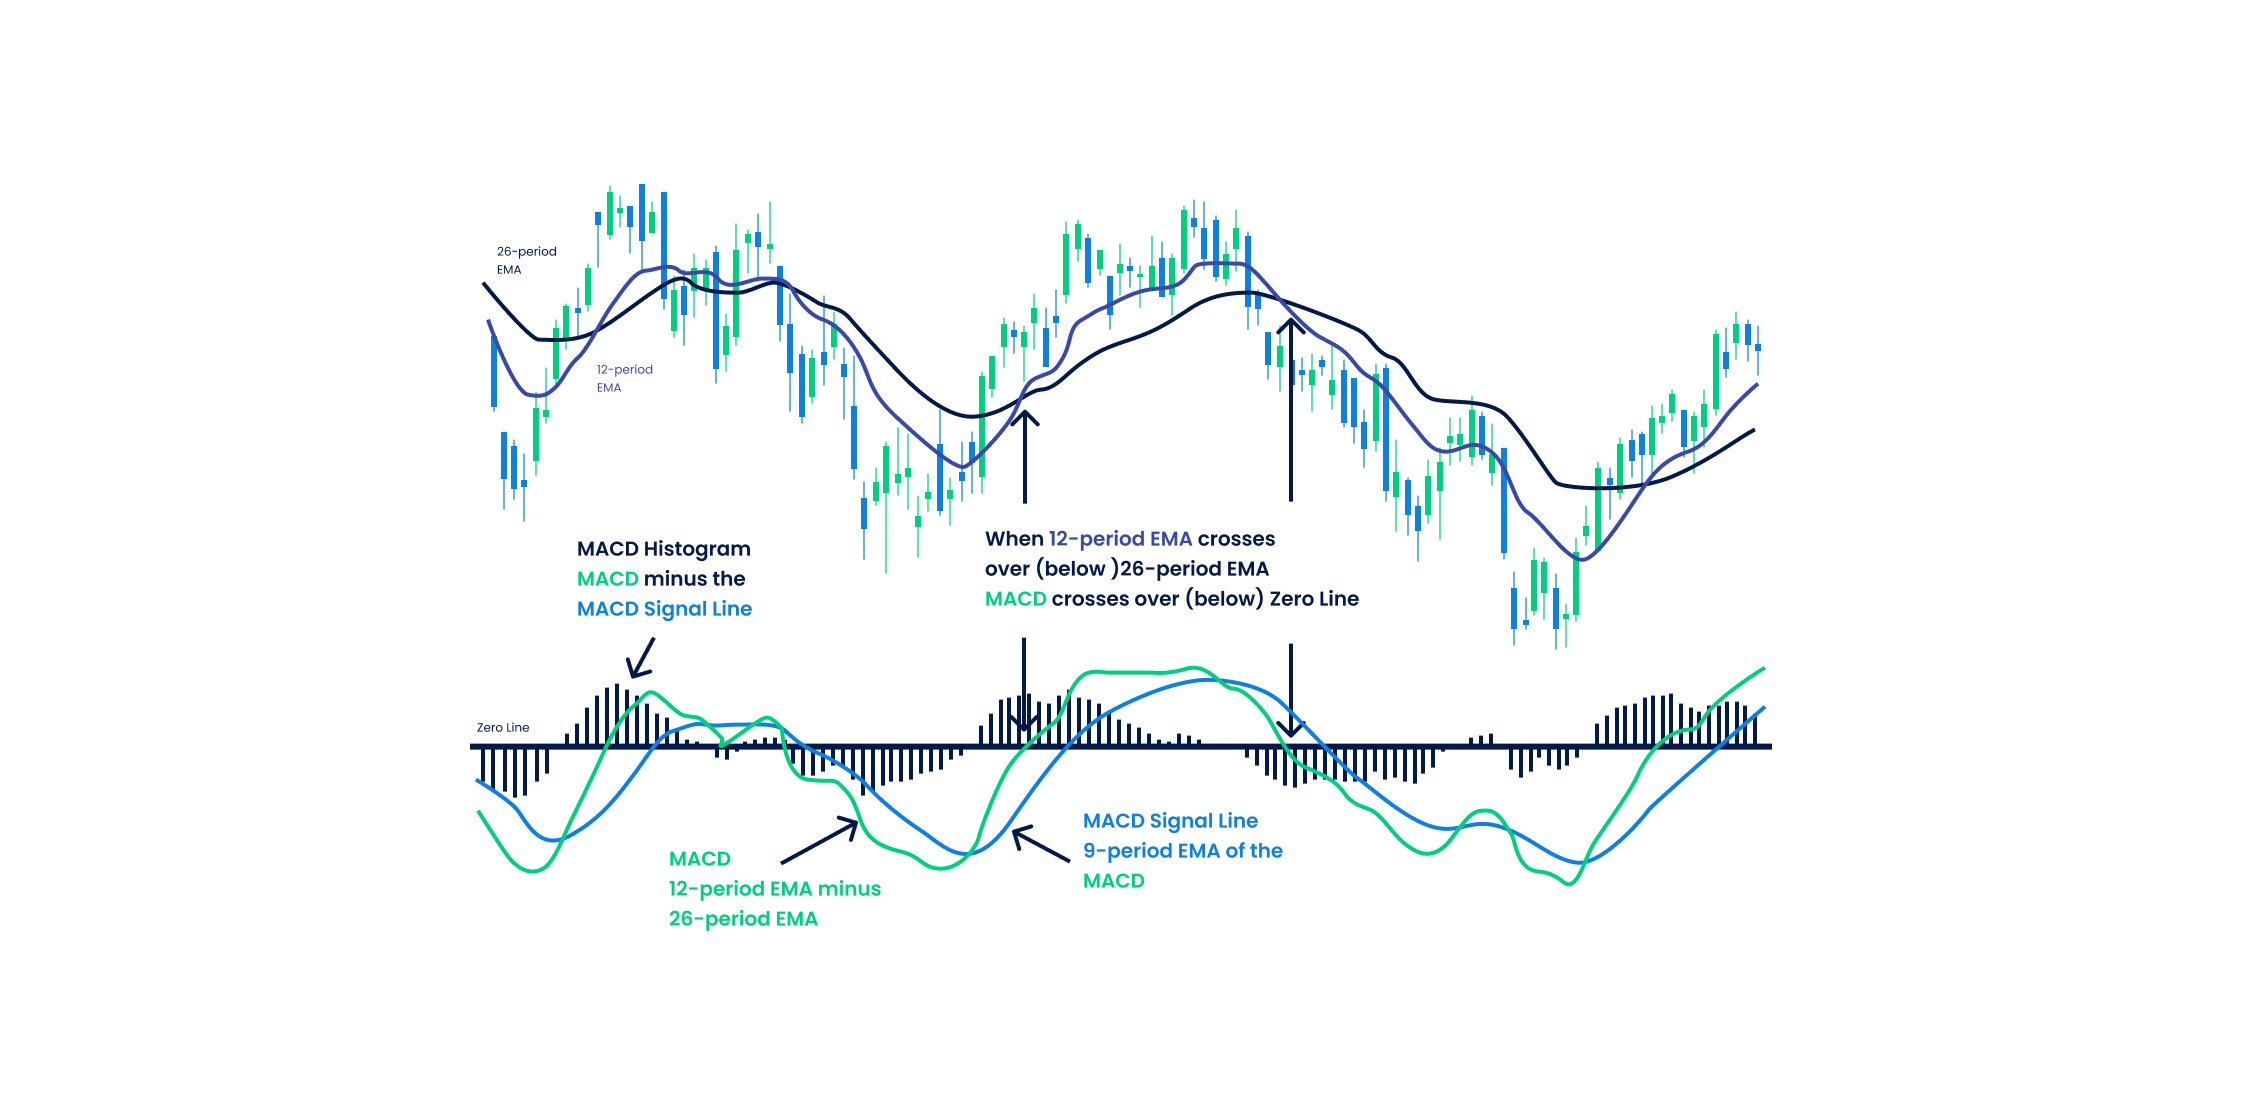
2. Moving Average Crossovers with the MACD Indicator
The best MA crossover strategy is the one combined with the MACD indicator for confirmed bullish or bearish signals. The Moving Average Convergence Divergence (MACD) helps in identifying if the markets are bullish or bearish, which in turn helps determine the ideal entry and exit price levels. MACD can be used with the Moving Average Cross Over by considering the 9-period moving average line as the short-term moving average and the 26-period moving average line as the long-term moving average.
- Traders reive a buy signal whenever the MACD line crosses the short-term moving average line from below.
- Traders receive a sell signal whenever the MACD line crosses the short-term moving average line from above.
Challenges with the moving average crossover trend
Moving average crossovers are extremely helpful for forex traders. However, in a consolidating market, moving average crossovers give various false signals. It can produce several signals that do not really indicate any trend in particular. It also implies that during such a situation, a trade does not experience an upward or downward bias in the currency pair, which could have led to significant profits.
Conclusion
Moving Average Crossovers signal potential entry and exit points. However, it should always be used with other chart patterns to rule out the chances of a false signal. Blueberry. is a forex trading platform that offers you access to advanced trading tools, tight spreads, and numerous guides to help you place successful trades and profit from them. Sign up for a live trading account or try a demo account.