

Moving Average is used in Forex trading to compare the current currency pair pricing and where it stands with respect to the current average pair prices. It sends buy and sell signals whenever the currency pair price moves closer to the Moving Average line. Traders can use this as a signal for a market reversal trend. Since Moving Averages are used to identify trend directions, they can help you exit the market as soon as a downtrend is about to occur and push you to enter the market before an uptrend. The impact of short-term price movements and fluctuations are offset with the Moving Average, so we get smooth currency pair price data.
What is a Moving Average?
The Moving Average is a technical indicator that represents the average closing currency pair price in the market over a defined period. It indicates the market momentum and analyses data through a series of currency pair prices.
How do you calculate the Moving Average?
The Moving Average can be calculated by adding currency pair prices over a specific period and dividing them by that same number. This is also known as the Simple Moving Average (SMA).
SMA Formula:
Summation of all the currency pair prices/Time over which the data were considered For example, let’s assume a 5-day SMA chart of USD/EUR gives the closing price of 1,1.2,1.5,1,1.3 = 6
Number of time periods: 5 Computation: 6/5 = 1.2 Hence, the SMA is 1.2
The 50-day Moving Average is a common choice for most traders. Similarly, the 200-day Moving Average is also considered to be a solid indicator of market trend reversals.
What is a Moving Average crossover?
A Moving Average crossover occurs whenever a fast MA (short period Movin g Average) crosses over a slow MA (longer period Moving Average). This indicates a trend reversal as a long period MA provides them with a strong support level.
Moving Averages you should know about:
-
Exponential Moving Average: The Exponential Moving Average or EMA is widely used to generate accurate MA prices. It weighs the recent currency pair prices more than the older ones. This is so that it is more responsive to the latest data prices and sensitive to the current market volatility. EMA Formula: EMA (today) = [value of the currency pair today*(smoothing)]+{EMA of yesterday*[1–(smoothing)]} Note: smoothing is a number derived by an algorithm that removes noise from the data set. It can also be known as the weight you give to the data set to ensure that current prices are given more importance. Formula to derive smoothing = [2/(total number of observations+1)] Yesterday’s EMA can be written as the SMA until that day. Suppose you want to use five days as the total number of observations for the EMA. To derive yesterday’s EMA, you can use the SMA until the 5th day. Considering our previous example of SMA, yesterday’s EMA will be 1.2. We can also assume that the closing price of USD/EUR is 2. The smoothing will be = [2/(5+1)] = 0.33. Finally, you can calculate the current EMA as (2*0.33)+1.2*(1-0.33)=1.21 Hence, the EMA is 1.21.
-
Double Exponential Moving Average: The Double Exponential Moving Average (DEMA) allocates even greater weight on the recent currency pair prices and gives more accurate results. This helps short-term traders spot trend reversals at the earliest possible time. The DEMA involves the least deviation. This makes it more sensitive to volatility in the market by using two EMAs instead of one. DEMA Formula: 2*EMA(ɳ)–EMA of EMA(ɳ) Where EMA(ɳ)=EMA of a specific period
-
Triple Exponential Moving Average : The Triple Exponential Moving Average (TEMA) reduces the lag of EMA. The difference between DEMA and TEMA is that the latter uses an EMA smoothed thrice as the original EMA. Hence, the TEMA stays closer to the currency pair prices than the DEMA. TEMA Formula: (3*first EMA)–(3*second EMA)+third EMA Where first EMA = EMA of the specific time Second EMA = EMA of the first EMA Third EMA = EMA of the second EMA
-
Weighted Moving Average: Traders use Weighted Moving Average (WMA) to speculate on market trend directions. Less weight is given on past currency pair prices, and more is given to the recent ones. Each point in the data is multiplied by a factor. Whenever prices move above the WMA, it signals an uptrend. However, when the prices are below the WMA, it indicates a downtrend. WMA Formula: (currency pair price 1*w1+currency pair price 2*w2+….+currency pair price ɳ*wɳ)/[ɳ*(ɳ+1)]/2 Where currency pair price 1,2,…ɳ= currency pair’s closing price that day W1, w2,…wɳ = the weight allocated to each currency pair price
How do you use a Moving Average in Forex?
Using MAs in confluence with other price action patterns is recommended to generate the most accurate figures. Here are the top three methods in which MAs can be used in the Forex market:
-
Support and resistance: The most common MAs that traders use are the 10-day MA, 20-day MA, 50-day MA, 100-day MA, and 200-day MA. These MAs can be used as resistance and support levels in a market. Some MAs carry more weight than others, like the 10-day, 20-day, and 50-day MA. Since they are more commonly used, the market reacts in its favour as more traders use the same level to enter or exit the market. Hence, they could act as the support and resistance levels.
-
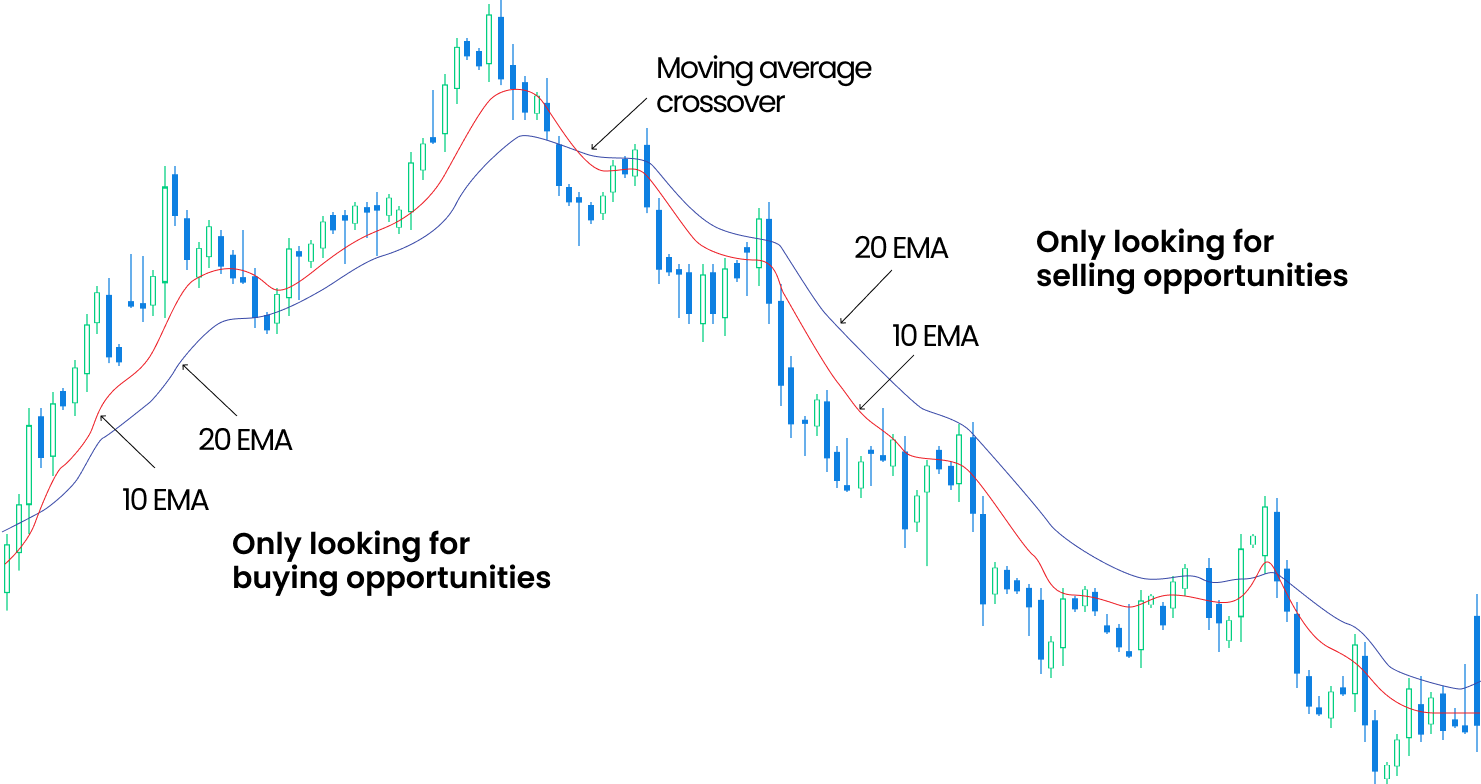
Trend analysis: Different MAs can be combined together to interpret the trend in the market. For example, you can combine the 10-day MA and 20-day MA to identify a trend. Let us assume that the AUD/USD daily chart shows buying opportunities when the 10-day MA is above the 20-day MA. Since the 10-day MA is following the currency pair prices more closely, it signals the market being in an uptrend when it is higher than the 20-day MA. However, once the 10-day MA is below the 20-day MA, it sends traders a signal for selling opportunities due to the downtrend.
-
Overextended markets: MAs also help identify overextended markets. Moving averages allow traders to trade a trend just in time. Once a market moves away from the MA price, price action traders usually wait for the currency pair price trend to normalise and return to the MA level before thinking about exiting the market.
Top Moving Average trading indicators
-
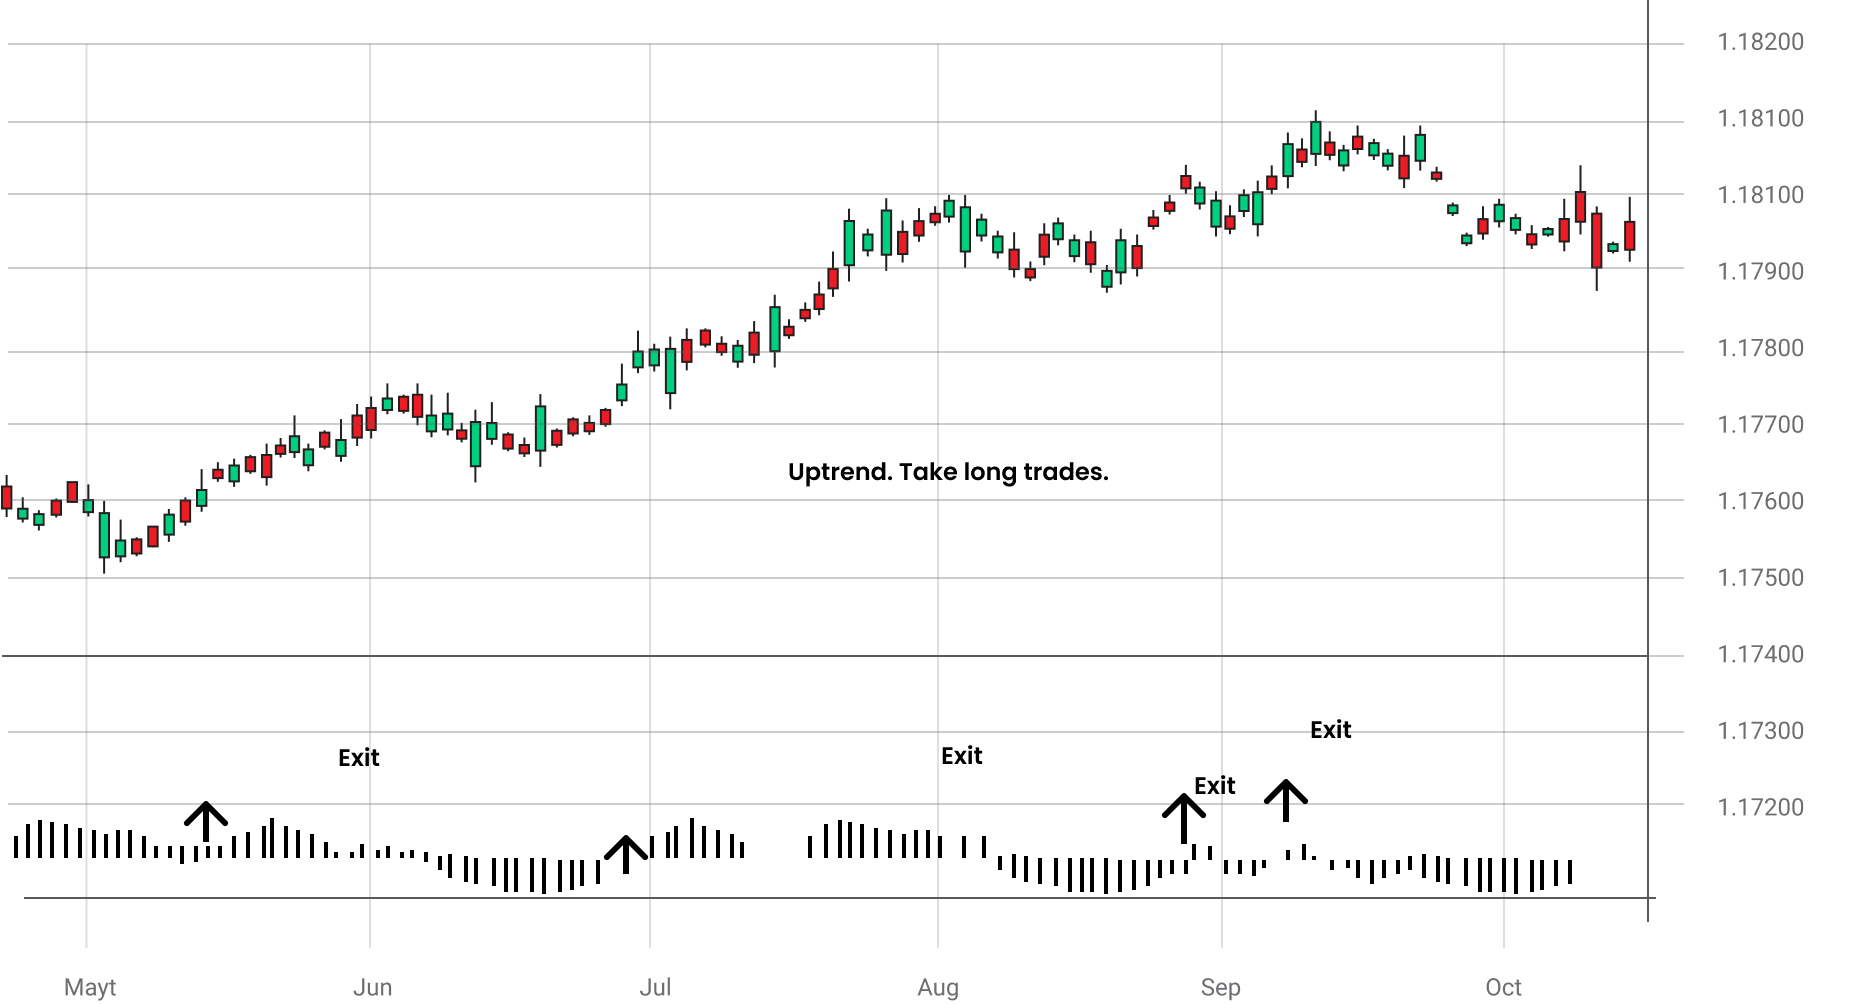
Moving Average Convergence Divergence (MACD): The MACD chart portrays the difference between a 26-day EMA and a 12-day EMA. It also plots a 9-day EMA as an overlay. With respect to the zero lines, a positive or negative relationship is identified. This relationship indicates the market trend and direction. Traders usually enter the market when the MACD crosses the signal line from below. However, when there is a downtrend, and the MACD is below the zero line, traders usually go short as soon as MACD crosses the signal line from below. To mitigate risk, traders use stop-loss orders below the recent low swing for long positions and above the recent swing high for short positions.
-
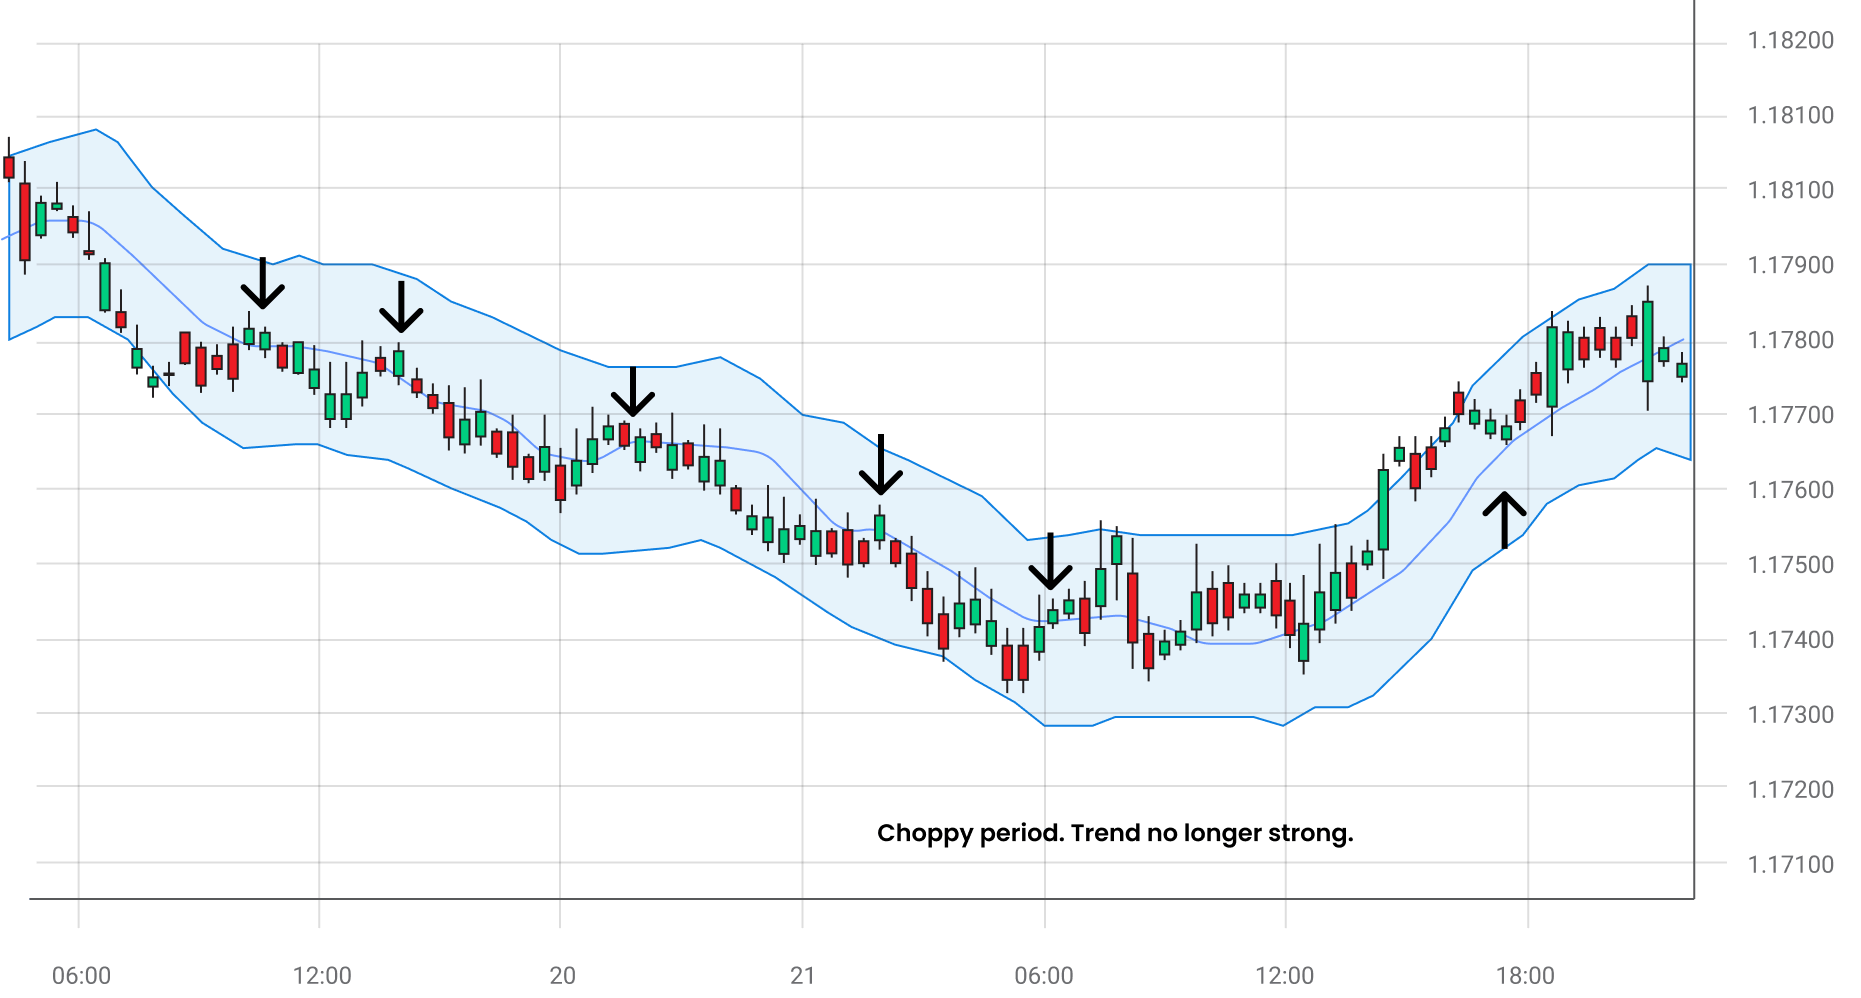
Moving Average envelope: The MA envelope uses envelopes based on percentages placed below and above the MA. Envelopes are most common between 10 to 100 days, and the percentage used for envelopes is from 1 to 10%. The percentage set changes daily, depending on market volatility. It is recommended to trade when you see a strong directional bias to the currency pair price. A strong downtrend signals traders to go short when the price reaches the MA and drops further. A stop-loss order can be placed above the recent swing high for short positions and vice versa for long positions.
-
Moving Average ribbon: The MA ribbon is commonly used in a trend reversal. You can formulate the ribbon based on a series of 8-day to 15-day EMAs plotted in the same chart. The MA ribbon indicates the trend’s strength and direction. The steeper the MA angle with higher separation, the stronger the trend. When the MAs come close and form a thick line, it is wise to move in favour of the trend. The stop-loss can be placed below the lowest point of the trending range if you are buying and vice versa if you are selling.
Read more about MA trading indicators here.
Maximise your trades with Moving Averages
Moving Average plays an important role in sending exit and entry signals to traders. With different Forex strategies and MA indicators combined, you can make the most out of your trades. Blueberry has an industry-standard trading platform that comes with tools and charts you can use together with your chosen MA indicators and strategies. Sign up for a live trading account or try a demo account.