

Elevate your trading skills with Blueberry Academy
Gain valuable insights and enhance your trading expertise with our comprehensive educational resources, tailored for traders at all levels.
View all
Advance
Expert
Intermediate
Intermediate
5 min read
Forex Margin and Leverage
03 Apr, 2025

Advance
5 min read
Forex Profit Calculator: Measuring Profits and Losses of Your Trades
03 Apr, 2025
Intermediate
8 min read
MT4 vs MT5: Which is Better?
27 Sep, 2024

Expert
3 min read
How to Use The Accelerator Oscillator For Forex Trading
20 Sep, 2024
Expert
5 min read
How to Use The Alligator Indicator in Forex Trading
20 Sep, 2024
Expert
5 min read
The Bearish Gartley Pattern
20 Sep, 2024

Expert
8 min read
Understanding the Forex ABCD Pattern
20 Sep, 2024
Expert
8 min read
What is the Hammer Candlestick Pattern?
20 Sep, 2024
Expert
6 min read
What is The Oscillator of Moving Average in Forex?
20 Sep, 2024

Expert
8 min read
Pennant Patterns: How to Trade Bearish and Bullish Pennants
19 Sep, 2024
Expert
8 min read
A Forex Trader’s Guide to Awesome Oscillator
18 Sep, 2024
Advance
0 min read
Average Directional Index: How to Use The Trend Strength Indicator?
18 Sep, 2024
Advance
8 min read
Bullish and Bearish Flag Patterns: What’s The Difference?
18 Sep, 2024
Advance
8 min read
Fundamental Analysis in Forex Trading Explained
18 Sep, 2024
Advance
8 min read
How to Ace Divergence Trading in Forex
18 Sep, 2024
Advance
8 min read
How to Trade With Double Tops and Bottoms in The Forex Market
18 Sep, 2024
Expert
5 min read
How to Use DeMarker Indicator For Forex Trading
18 Sep, 2024
Advance
8 min read
How to Use The Chaikin Money Flow Indicator
18 Sep, 2024
Advance
5 min read
How to Use The Keltner Channel For Forex Trading
18 Sep, 2024
Advance
8 min read
Leading vs Lagging Indicators: What’s The Difference?
18 Sep, 2024
Advance
8 min read
Managing Risk in 7 Steps: Understanding Forex Management
18 Sep, 2024
Advance
8 min read
MT5 Indicators Every Trader Should Know
18 Sep, 2024
Advance
8 min read
The Hanging Man Candlestick Pattern For Forex Trading
18 Sep, 2024
Advance
8 min read
Top Continuation Patterns
18 Sep, 2024
Advance
8 min read
Top Indicators for MT4
18 Sep, 2024
Advance
8 min read
Top MACD Trading Strategies
18 Sep, 2024

Advance
8 min read
Top Support and Resistance Indicators
18 Sep, 2024
Intermediate
5 min read
Understanding Forex Rollover Rates
18 Sep, 2024
Advance
10 min read
Understanding Market Gap and Slippage
18 Sep, 2024
Expert
5 min read
What are Bollinger Bands?
18 Sep, 2024
Advance
8 min read
What are Pivot Points in Forex
18 Sep, 2024
Advance
8 min read
What are Trendlines in Forex Trading?
18 Sep, 2024
Advance
8 min read
What are Volume Indicators (How to Use Them)
18 Sep, 2024
Expert
8 min read
What is Currency Correlation?
18 Sep, 2024
Advance
5 min read
What is Forex Spot Trading
18 Sep, 2024
Expert
5 min read
What is Money Flow Index?
18 Sep, 2024
Advance
8 min read
What is Slippage in Forex Trading?
18 Sep, 2024
Expert
8 min read
What is the Evening Star Candlestick Pattern?
18 Sep, 2024
Expert
8 min read
What is the Martingale Trading Strategy in Forex?
18 Sep, 2024
Advance
8 min read
What is the Tweezer Candlestick Formation
18 Sep, 2024
Advance
5 min read
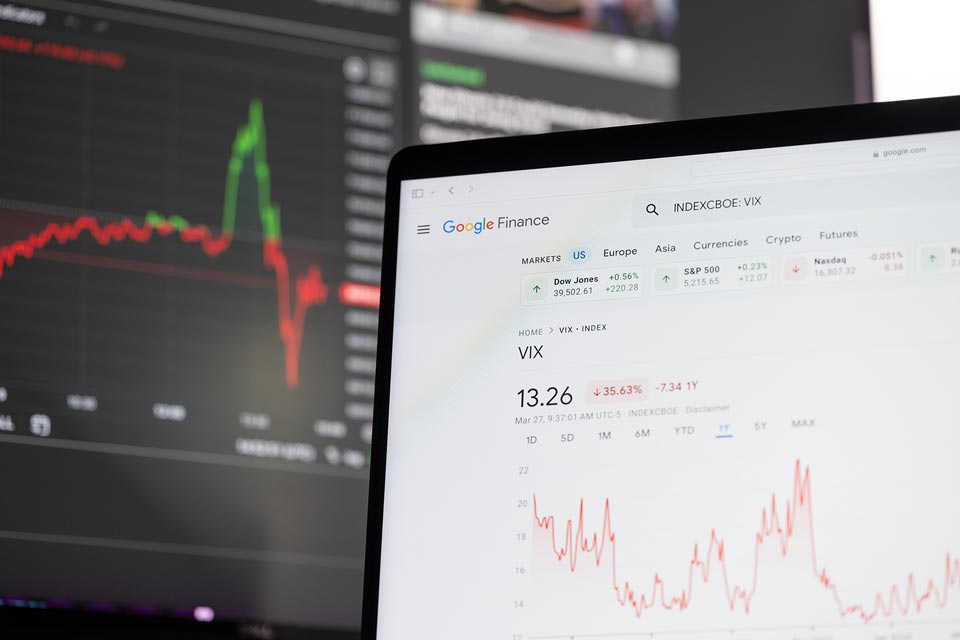
What is Volatility Index (VIX) and How Do You Trade It?
18 Sep, 2024
Advance
6 min read
Introduction to Order Types in Forex
18 Sep, 2024
Advance
7 min read
Top Forex Trading Strategies That Actually Work
18 Sep, 2024
Advance
5 min read
Top Low Spread Scalping Strategies For Forex Traders
18 Sep, 2024
Expert
5 min read
What are Forex Expert Advisors?
18 Sep, 2024
Advance
5 min read
What is Forex Currency Swap?
18 Sep, 2024
Expert
8 min read
A Step-by-Step Guide to Utilizing a No Stop-loss Trading Strategy in Forex
17 Sep, 2024

Expert
8 min read
Average True Range: What It Is How to Calculate It?
17 Sep, 2024
Expert
10 min read
Candlestick Patterns: Top Candlestick Charts Every Trader Should Know
17 Sep, 2024
Advance
8 min read
DeMarker Indicator
17 Sep, 2024
Advance
5 min read
Forex Trading on Weekends
17 Sep, 2024

Intermediate
5 min read
Hedging in Forex
17 Sep, 2024
Expert
8 min read
How Does Stochastic Indicator Work in Forex Trading?
17 Sep, 2024
Intermediate
5 min read
How is Forex Regulated?
17 Sep, 2024

Intermediate
5 min read
How to Calculate Forex Position Sizing
17 Sep, 2024
Expert
5 min read
How to Copy Trade With MetaTrader
17 Sep, 2024
Advance
8 min read
How to Find The Best Forex Trading Signals
17 Sep, 2024

Expert
8 min read
How to Identify Cup and Handle Pattern in Forex Trading
17 Sep, 2024

Intermediate
5 min read
How To Set a Stop Loss Order in Forex Trading
17 Sep, 2024
Intermediate
5 min read
How to Trade Forex for Beginners
17 Sep, 2024
Expert
8 min read
How to Trade Forex With NFP V-Shaped Reversal
17 Sep, 2024
Expert
5 min read
How To Trade The Gartley Pattern
17 Sep, 2024
Expert
8 min read
How to Trade With Multiple Time Frame Analysis in Forex
17 Sep, 2024
Expert
8 min read
How to Trade With The On Balance Volume Indicator
17 Sep, 2024
Expert
8 min read
How to Use Fibonacci Retracement in Forex Trading
17 Sep, 2024
Expert
5 min read
How to Use Martingale Strategy For Trading
17 Sep, 2024
Intermediate
10 min read
MetaTrader 4: The Complete Guide
17 Sep, 2024
Intermediate
8 min read
MetaTrader 5: The Complete Guide
17 Sep, 2024
Expert
8 min read
Moving Average Crossover
17 Sep, 2024
Intermediate
5 min read
PIP in Forex Trading
17 Sep, 2024
Advance
10 min read
Price Action Trading Strategy: The Ultimate Guide
17 Sep, 2024

Expert
8 min read
The Beginner’s Guide to MQL5
17 Sep, 2024
Expert
5 min read
The Bullish Three Drive Pattern
17 Sep, 2024

Expert
8 min read
Top Advanced Forex Trading Strategies You Should Know
17 Sep, 2024
Expert
5 min read
Top Fundamental Trading Strategies You Should Know
17 Sep, 2024
Expert
5 min read
Top Pullback Trading Strategies
17 Sep, 2024
Expert
8 min read
Understanding Andrew's Pitchfork Trading Strategy
17 Sep, 2024
Intermediate
8 min read
Understanding Forex Risk Management
17 Sep, 2024
Expert
5 min read
Using The Accumulation/Distribution Indicator to trade in Forex
17 Sep, 2024
Expert
8 min read
What are Ascending and Descending Triangle Patterns?
17 Sep, 2024
Expert
5 min read
What Are Bear and Bull Power Indicators?
17 Sep, 2024
Intermediate
5 min read
What is a Currency Pair in Forex?
17 Sep, 2024
Expert
5 min read
What is a Heikin Ashi Candlestick Chart Pattern?
17 Sep, 2024
Intermediate
8 min read
What is a Spread in Forex?
17 Sep, 2024
Expert
8 min read
What is Commodity Channel Index?
17 Sep, 2024
Intermediate
5 min read
What Is Gap Trading?
17 Sep, 2024
Intermediate
8 min read
What is Swing Trading?
17 Sep, 2024
Expert
8 min read
What is The Forex Linear Regression?
17 Sep, 2024
Expert
8 min read
What is The Ichimoku Kinko Hyo Indicator?
17 Sep, 2024
Expert
8 min read
What is the MACD Indicator?
17 Sep, 2024
Expert
8 min read
What is The Opening Range Breakout Strategy?
17 Sep, 2024
Expert
8 min read
What is the Parabolic SAR indicator?
17 Sep, 2024

Intermediate
5 min read
Habits of Successful Forex Traders
17 Sep, 2024

Intermediate
5 min read
Key Steps to Make Your First Trade in Forex
17 Sep, 2024
Advance
6 min read
The Donchian Channel Indicator
17 Sep, 2024
Expert
5 min read
Trading in Volatile Markets
17 Sep, 2024
Intermediate
5 min read
What is Forex?
17 Sep, 2024
Intermediate
5 min read
What is Margin Trading
17 Sep, 2024
Expert
7 min read
What is The Favourite Fib Fibonacci Retracement Strategy?
17 Sep, 2024

Intermediate
4 min read
Who Trades Forex?
17 Sep, 2024

Intermediate
3 min read
Why Trade Forex?
17 Sep, 2024
Advance
8 min read
5 Top ADX Trading Strategies
16 Sep, 2024

Advance
0 min read
8 Top Commodity Trading Strategies
16 Sep, 2024
Advance
8 min read
Bearish and Bullish Markets: What is The Difference?
16 Sep, 2024
Advance
5 min read
Breakout Trading and Fakeout Trading in Forex
16 Sep, 2024

Advance
5 min read
Buy Limit vs Sell Stop Orders in Forex
16 Sep, 2024

Advance
5 min read
Forex Trading Robots: How Do They Work?
16 Sep, 2024
Advance
8 min read
How to Add MT4 Indicators
16 Sep, 2024
Advance
5 min read
How to Identify a Trend in the Forex Market
16 Sep, 2024

Advance
8 min read
How to Install MT4: A Beginner's Guide
16 Sep, 2024
Advance
5 min read
How to Short Sell a Currency
16 Sep, 2024
Advance
5 min read
How to Trade Bullish and Bearish Divergences
16 Sep, 2024
Advance
8 min read
How to Trade With VWAP Indicator in Forex
16 Sep, 2024
Advance
5 min read
How to Use Elliott Wave Theory For Forex Trading?
16 Sep, 2024
Advance
5 min read
How to Use Forex Market Sentiment Indicators
16 Sep, 2024
Advance
3 min read
How to Use Gator Oscillator For Forex Trading
16 Sep, 2024
Expert
5 min read
How to Use Inside Bar Trading Strategy
16 Sep, 2024
Advance
5 min read
How to Use Relative Vigor Index in Forex
16 Sep, 2024
Advance
8 min read
How to Use The Bill Williams Indicator
16 Sep, 2024
Advance
3 min read
How to Use The Force Index Indicator in Forex?
16 Sep, 2024
Advance
5 min read
Introduction to Technical Analysis in Forex
16 Sep, 2024
Advance
5 min read
Market Order vs Limit Order: What’s The Difference?
16 Sep, 2024
Advance
5 min read
Moving Average: The Complete Guide
16 Sep, 2024
Advance
5 min read
Scalping vs Swing Trading: What's the Difference?
16 Sep, 2024

Intermediate
8 min read
Support and Resistance Levels
16 Sep, 2024
Advance
8 min read
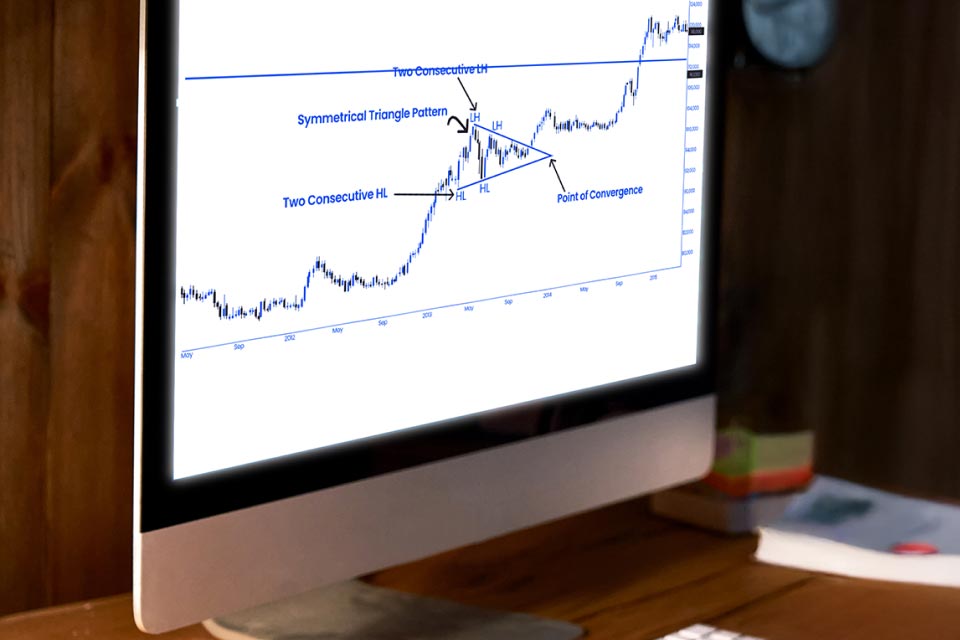
Symmetrical Triangle Pattern: Everything You Need to Know About This Forex Chart Pattern
16 Sep, 2024
Advance
8 min read
The Best Time Frame For Forex Trading
16 Sep, 2024
Advance
8 min read
The Ultimate Guide to Trading Trends in Forex
16 Sep, 2024
Advance
8 min read
Top Forex Volatility Indicators
16 Sep, 2024
Advance
8 min read
Top Momentum Indicators To Analyse Trend Strength
16 Sep, 2024
Advance
8 min read
Top Pivot Point Strategies
16 Sep, 2024
Advance
8 min read
Top Reversal Patterns For Forex Trading
16 Sep, 2024
Advance
8 min read
Top Trading Chart Patterns
16 Sep, 2024
Advance
8 min read
Understanding The Shooting Star Candlestick Pattern
16 Sep, 2024
Advance
8 min read
What are Falling and Rising Wedges?
16 Sep, 2024
Advance
8 min read
What Are Harmonic Price Patterns in Forex
16 Sep, 2024
Intermediate
5 min read
What are Long and Short Positions in Forex?
16 Sep, 2024
Advance
8 min read
What Are Momentum Indicators in Forex
16 Sep, 2024
Intermediate
8 min read
What is Doji Candle: How to Trade with Doji Candlestick Pattern
16 Sep, 2024
Expert
5 min read
What is High Wave Candlestick?
16 Sep, 2024
Advance
8 min read
What is Momentum Trading? Top Momentum Trading Strategies
16 Sep, 2024
Advance
8 min read
What is Morning Star Indicator?
16 Sep, 2024
Advance
8 min read
What is PIP in Forex?
16 Sep, 2024
Advance
8 min read
What is Scalping in Forex?
16 Sep, 2024
Expert
8 min read
What is the Bullish Engulfing Candlestick?
16 Sep, 2024
Advance
7 min read
What is The Exponential Moving Average
16 Sep, 2024
Advance
8 min read
What is Volume Trading Strategy
16 Sep, 2024
Advance
5 min read
How To Trade Forex With Japanese Candlesticks?
16 Sep, 2024
Intermediate
5 min read
Leverage in Forex
16 Sep, 2024

Advance
6 min read
Technical Trading Strategies for Day Traders
16 Sep, 2024
Intermediate
4 min read
Tips for Forex Trading for Beginners
16 Sep, 2024
Advance
5 min read
Top Technical Indicators in Forex
16 Sep, 2024
Advance
6 min read
Using Orders to Manage Risk in Forex
16 Sep, 2024
Advance
7 min read
What are Wide Ranging Bars?
16 Sep, 2024
Intermediate
4 min read
When Can You Trade Forex?
16 Sep, 2024

Advance
0 min read
Using the Heikin Ashi Candlestick Pattern
01 Jan, 0001
Page 1 of 1