What is Volatility Index (VIX) and How Do You Trade It?
The volatility index (VIX), also known as the fear index, is one of the metrics that traders use to measure market fear, stress, and risks. It is the benchmark that lets traders quantify a market's volatility expectations. A higher VIX means that the level of market fear is quite high. This is why there is a sharp increase in the VIX immediately after a market crash. An increase in VIX reflects a drop in the SP500 prices, indicating the right time to enter the market. Similarly, when VIX falls and SP500 prices increase, it signals traders to sell or exit the market.
What is the volatility index (VIX)?
The volatility index is created by the Chicago Board Options Exchange (CBOE). It is a real-time indicator of measuring predicted price fluctuations in the SP500 index options. It is always derived from the prices of SP500 index options with a short-term expiry date and generate volatility projections for the next 30 days. The VIX is also known as the measure of implied volatility because it predicts price changes instead of statistical analyses of historical trends. The predictions are based on a betting format where experienced traders bet on the expected future performance of foreign securities in the SP500.
Why trade the VIX?
VIX is a popular choice among traders as it helps them analyse different markets, diversify and hedge their portfolios, and speculate on price movements. You can link several instruments like Forex, Share CFDs, Gold and Commodities with VIX. That means that any indication of a market possibly crashing would strengthen the trader's outlook in other markets when trading with VIX. However, if a particular market is booming, it could warn traders of other ones potentially falling. Taking a position on the VIX allows you to balance assets in your portfolio by hedging the market exposure. For example, you have a long position on an asset related to SP500. Even though there are some long-term prospects, you choose to cut down on your exposure to short-term volatility. So, you open a position on VIX. Trading the VIX allows you to balance your assets by covering potential losses to cover short-term profits.

How to trade the VIX?
Many securities are based on CBOE VIX pricing, giving traders the benefit of low and high volatility situations. The easiest way to invest in VIX is through exchange-traded funds (ETFs) based on VIX futures. Traders can buy or sell VIX ETFs like usual stocks. Most traders invest in products with a maturity period of 30 days since VIX ETFs are risky. This means that most traders don’t hold positions in the long term. Here’s how you can trade the VIX:
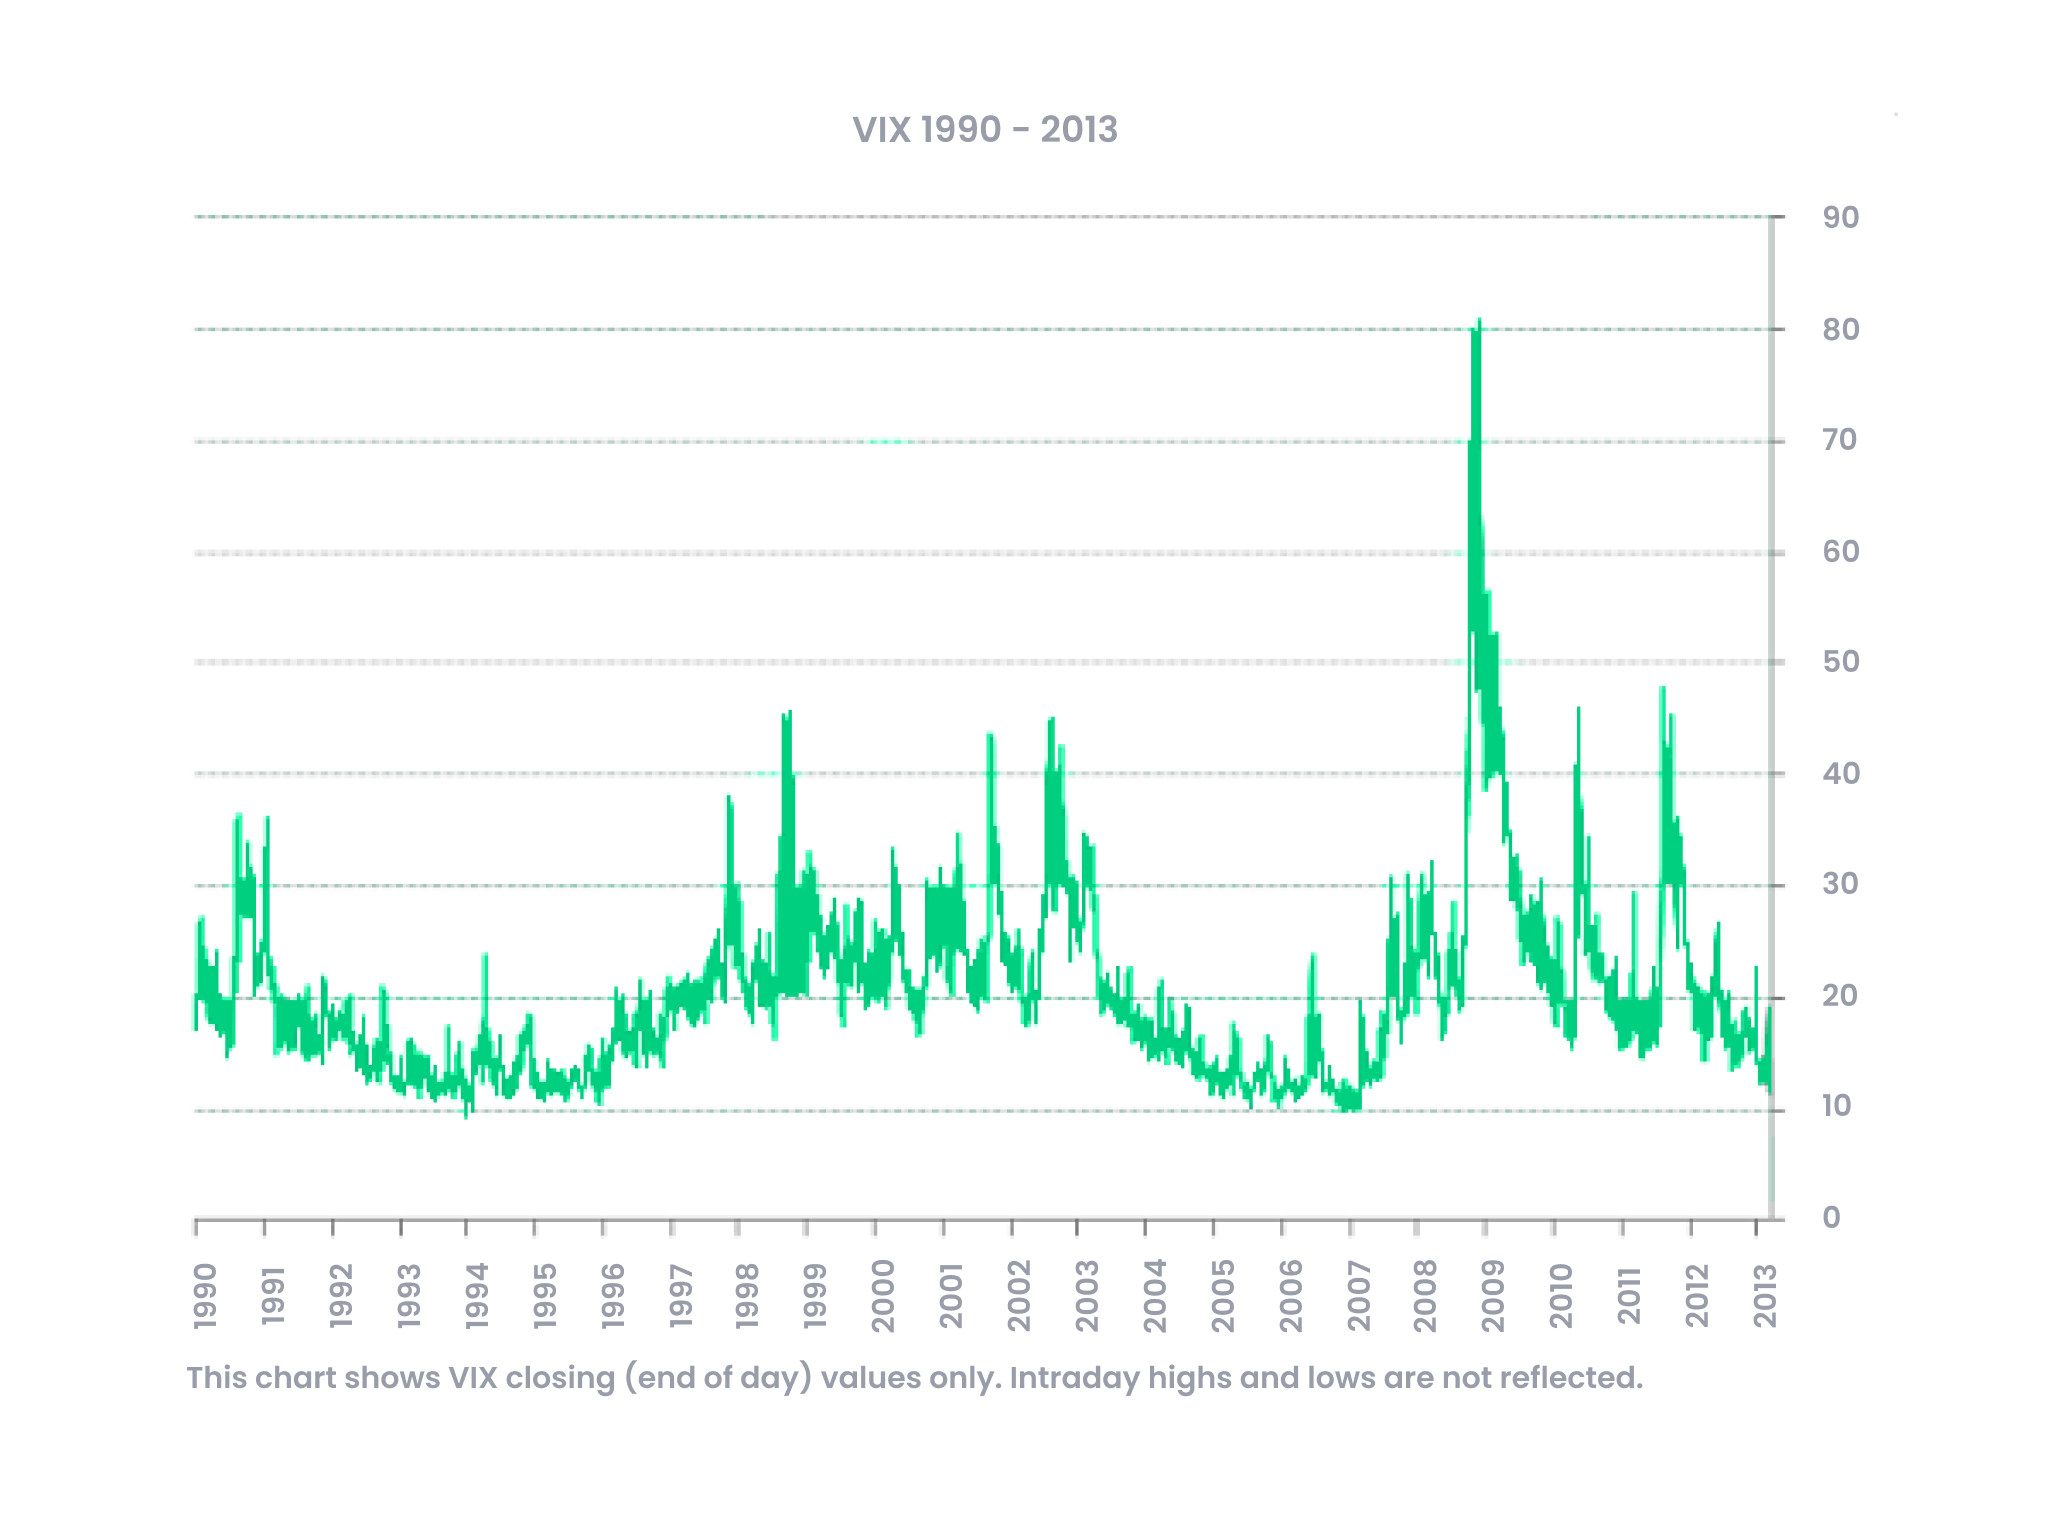
- Learn how VIX works: Learning how VIX works and studying past VIX charts will help you understand the changing prices over the years.
- Decide if you want to go long or short: Going long may be a good move if you believe the VIX will rise. If the VIX is expected to decrease, traders usually take a short position.
- Open an account: You can consider opening a demo account first if you are not confident enough to trade the VIX in a live market.
Take advantage of the market volatility with VIX
The VIX enables you to trade with market volatility and benefit from rising and falling markets. Going long in times of stress and financial instability may result in profit. At the same time, going short in an economically sound and low-interest rate market could prove to be beneficial.
Start trading with a Blueberry Markets account today.
Frequently Asked Questions
What is the Volatility 75 Index?
The volatility 75 index measures the volatility of SP500 securities. A reading above 20 means that the market is fearful, which brings higher volatility. Hence, volatility 75 is often considered a risky and unstable market.
What is the Volatility 10 Index?
The volatility 10 index represents low volatility in the market, which means low VIX. This also shows that there is increased certainty, economic stability, and low investor fear.
How do I find the Volatility Index?
VIX can be calculated in real-time by using the live prices of SP500 futures and options. It expires within 23 and 37 days.
Is a high VIX good or bad?
A high VIX means the volatility in the market is high, which depicts market fear. This can be good if you buy VIX when it is high, then go short as soon as it is low.
What is considered a high VIX?
When the VIX reading is above 20, it is considered a period of high volatility. As soon as the reading crosses 30, the markets are considered at their most elevated fear gauge with an unsettled situation.
Recommended Topics
-
Top Pivot Point Strategies
Pivot point analysis can predict not only price movements but also help time entries and exits correctly to develop a risk management strategy.
-
How to Use The Bill Williams Indicator
Bill Williams Indicator is helpful in analysing trending markets, reversals and momentum.
-
How to Use Relative Vigor Index in Forex
The Relative Vigor Index (RVI) is a technical analysis indicator that helps measure a trend’s strength in forex trading.
-
Technical Trading Strategies for Day Traders
Technical trading strategies for day traders include technical analysis tools to identify short-term trading opportunities in the market.
-
How to Use The Force Index Indicator in Forex?
The Force Index indicator combines the currency pair’s price and volume to determine the power of bulls and bears in the market.
-
The Ultimate Guide to Trading Trends in Forex
Trading trends in forex provides you with opportunities to identify the strong market direction and enter an order accordingly.
-
MT5 Indicators Every Trader Should Know
MT5 is a forex and stock trading platform that enables traders to place automatic orders.
-
What is Volume Trading Strategy
Volume trading in forex is all about trading currency pairs with high buying or selling pressure.
-
Top Low Spread Scalping Strategies For Forex Traders
Scalping strategies allow traders to leverage on the small price changes in the forex market to turn the trends in their favour.
-
What is Forex Currency Swap?
Forex currency swap helps reduce foreign borrowing costs and mitigate exchange rate risks.
-
What is Forex Spot Trading
With forex spot trading, one can make significant short-term profits by trading at prevailing prices.
-
How to Short Sell a Currency
Short selling enables traders to place lucrative forex orders even in a falling market.
-
How to Use The Chaikin Money Flow Indicator
The Chaikin Money Flow indicator provides future market direction by analysing the strength of the market trend and underlying buying or selling pressures.
-
What is Momentum Trading? Top Momentum Trading Strategies
Momentum trading leverages market volatility to the trader’s advantage by identifying the strength of the market’s current trend.
-
How to Trade With VWAP Indicator in Forex
The Volume Weighted Average Price (VWAP) helps eliminate any unwanted price fluctuations during the trading period.
-
5 Top ADX Trading Strategies
The Average Directional Movement Index (ADX) strategy measures the forex market’s overall strength.
-
How to Identify a Trend in the Forex Market
Identifying market trends in forex is also helpful in understanding if your trading strategy is going as per plan and where you can improve.
-
Forex Trading Robots: How Do They Work?
Forex trading robots make multitasking possible by processing multiple conditions like order entries/exits and entering stop loss orders automatically.
-
What Are Momentum Indicators in Forex
Momentum indicators measure how strong the price change is in the currency pairs.
-
How to Use Gator Oscillator For Forex Trading
Gator Oscillator helps in identifying a trending or consolidating market.
-
What is The Exponential Moving Average
Exponential Moving Average (EMA) helps in understanding the market’s trend direction.
-
Top Forex Volatility Indicators
Forex volatility defines the risk an investor takes in the market. The higher the volatility, the greater the risk and the higher the potential returns.
-
How to Use Forex Market Sentiment Indicators
Sentiment indicators in the forex market indicate extremely volatile market conditions.
-
How to Use The Hanging Man Candlestick Pattern For Forex Trading
The Hanging Man Candlestick pattern provides downtrend reversal signals, which helps traders place sell or short orders to profit off falling markets.
-
How to Add MT4 Indicators
MetaTrader 4 comes with several built-in and custom indicators to boost your trading strategy.
-
Top MACD Trading Strategies
Moving Average Convergence Divergence (MACD) strategies enable traders to measure market momentum and trend strength.
-
Top Indicators for MT4
MT4 indicators help analyse forecasted currency pair prices and place exit or entry orders accordingly.
-
How to Trade Bullish and Bearish Divergences
Bullish and bearish divergences enable you to trade market reversals.
-
Top Support and Resistance Indicators
Support and Resistance indicators identify price points on the forex chart where the markets can potentially reverse.
-
What is The Donchian Channel Indicator
The Donchian Channel indicator can determine volatility and potential breakout signals in the market.
-
How to Install MT4: A Beginner's Guide
MetaTrader 4 (MT4) is a powerful forex trading platform with a user-friendly interface and advanced analytical tools for automating trading.
-
What are Trendlines in Forex Trading?
Trendlines in forex provide clear market signals for placing long or short orders.
-
Market Order vs Limit Order
Market and Limit orders help execute automatic trading transactions, as per your trading preferences.
-
Bearish and Bullish Markets
In the trading world, it is essential to be aware of the bull and bear market trends because they define the direction of the market
-
How to Read Trading Charts
Trading forex live charts can help identify ongoing market trends, which can help you place successful traders.
-
Top Reversal Patterns For Forex Trading
Reversal patterns provide traders with price levels at which the market can potentially reverse.
-
How to Find The Best Forex Trading Signals
Forex trading signals are important market triggers that provide traders with ideal entry and exit price levels in the market.
-
Top Forex Trading Strategies That Actually Work
Trading in forex, you will come across several forex trading strategies -- some more complex than the others. It is immensely crucial to start forex trading with the right strategy.
-
Scalping vs Swing Trading: What’s the Difference?
Every forex trader has a different purpose, objective, time constraints, and investment capital. The right forex trading style for you depends on your main trading goals and requirements.
-
What are Volume Indicators
Volume in the forex market can be used to determine the upcoming market trends. Volume indicators are forex trading indicators that can identify if the volume for a particular currency pair is high or low, providing traders with market continuation and reversal signals
-
Shooting Star Candlestick Pattern
The Shooting Star Candlestick Pattern can identify bearish market reversals and provide traders with ideal price levels to short or exit the trade.
-
Top Trading Chart Patterns
Predicting future currency pair prices help in confirming market continuation and reversal signals.
-
What is Slippage in Forex Trading?
Slippages occur when a currency pair order is executed at a price different from the set market order price.
-
Buy limit vs Sell Stop Orders in Forex
Placing buy limit and sell stop orders help employ a price control strategy on forex trades. Let's take a look at buy limit vs sell stop orders.
-
The Best Time Frame For Forex Trading
A time frame is a designated time period where forex trading takes place. Time frames can be measured in minutes, hours, days, weeks, months and years.
-
Top Technical Indicators in Forex
Technical indicators are a market direction signal based on the current and historical price movement of a currency pair that provides traders with future price expectations
-
Top Continuation Patterns
A continuation pattern indicates if the current market trend is going to continue in the same direction or not
-
How to Ace Divergence Trading in Forex
The forex market is all about timing your trades well. Divergences give traders a market reversal signal right before a price trend changes
-
How To Trade Forex With Japanese Candlesticks?
A Japanese Candlestick is a technical analysis tool used to analyze the currency pair’s price movement in the forex market.
-
Top Momentum Indicators To Analyse Trend Strength
Momentum indicators are technical analysis tools that determine in which direction the market is headed and how strong or weak the ongoing trend is
-
Types of Moving Averages Every Trader Should Know
Moving Average is a technical indicator which averages out currency pair prices in a specific time period in order to accurately identify market trend reversals and support-resistance levels.
-
8 Popular Intraday Trading Indicators
Intraday Trading Indicators help place successful short-term trade orders in the forex market.
-
What is the Tweezer Candlestick Formation?
The Tweezer Candlestick formation is a reversal pattern that indicates either a market top (strong uptrend) or market bottom (strong downtrend)
-
Average Directional Index
The ADX is a strength indicator that measures how strong or weak a particular market trend is.
-
How to Use Elliott Wave Theory For Forex Trading?
The Elliott Wave Theory analyses a currency pair’s long-term price movement in the forex market.
-
What are Pivot Points in Forex
Pivot Points help traders identify market reversals. With Pivot Points, traders can predict the support and resistance levels of a currency pair to make entry and exit decisions.
-
Keltner Channel
Keltner Channel is a technical indicator that provides traders with strong continuation signals and trend directions by assessing a currency pair's price volatility.
-
Leading vs Lagging Indicators
Leading and lagging indicators help traders measure the future and current performance of a currency pair, respectively. These indicators can help make successful trading decisions.
-
What is Relative Strength Index?
Relative Strength Index (RSI) helps traders understand how frequently the currency pair prices change in the forex market to predict the future market prices.
-
Wide Ranging Bars
Wide Ranging Bars are strong momentum indicators that help traders understand the market direction and identify ideal entry and exit points.
-
Harmonic Price Patterns in Forex
Harmonic Price Patterns allow traders to predict future price movements and trend reversals to make ideal entry and exit decisions in the Forex market.
-
Double tops and bottoms
Double Tops and Double Bottoms chart patterns help traders identify solid bullish and bearish trend reversals in the Forex market, and in turn, find the ideal market entry and exit points.
-
Falling and Rising Wedges
When you are trading currency pairs in the Forex market, it is essential to know when the market can possibly reverse. The Falling and Rising Wedges pattern help identify market reversal signals and accurate market entry and exit points.
-
Forex Scalping Strategy
Scalping refers to trading currency pairs in the Forex market based on real-time analysis. With Forex scalping, you hold a position for a very short period and close once you see a profit opportunity.
-
Symmetrical Triangle Pattern
Symmetrical Triangle Patterns help identify market breakdowns (price fall) and breakouts (price rise), and in turn, help you plot the entry and exit prices for profitable Forex trading.
-
Introduction to Technical Analysis in Forex
Technical analysis in Forex trading provides you with significant market trends, reversals and fluctuations and in turn helps you long and short term trades.
-
Trading breakouts and fakeouts
Breakout and fakeout trading enable traders to take positions in rising and falling markets.
-
Fundamental Analysis in Forex Trading Explained
Fundamental analysis in Forex trading is one of the several methods you can use to determine the relative security and intrinsic value of a nation’s currency.
-
8 Top Commodity Trading Strategies
Commodity trading is one of the best ways to diversify your portfolio and protect yourself from losses incurred due to inflation.
-
What is a Doji Candlestick?
The Doji Candlestick is a pattern used in technical analyses of trend reversals in a market.
-
Moving Average: The Complete Guide
Moving Average is used in Forex trading to compare the current currency pair pricing and where it stands with respect to the current average pair prices.
-
Forex Profit Calculator
On average, a Forex trader can make anywhere between 5 to 15% of the initial amount they invested in the market.
-
Understanding markets gaps and slippage
The foreign exchange rate reveals valuable details about particular currencies a trader wishes to trade-in.
-
What is a pip in forex?
When trading in the Forex market, you need to have a close eye on two currencies at the same time. PIP helps you denote the change in a currency pair’s value.
-
Introduction to Order Types in Forex
Forex has different order types which allow traders to automate entering and exiting positions.
-
Using orders to manage risk
Forex risk management includes a robust set of rules and regulations that protect you against Forex's negative impacts.
-
Managing risk in 7 steps
Risk management in Forex is essential to individuals, groups of individuals, and organizations since it enables them to implement measures that help mitigate Forex risk and its negative impact.
-
Bullish and Bearish Flag Patterns
Blueberry Markets discusses why it is essential to study the bullish and bearish flag patterns in Forex. Learn more.
Advanced
Master risk management and
become an expert forex trader.
Move on to the advanced course.
Guide to Forex
Trading indicators.
Enter your details to get a copy of our
free eBook
Start a risk free
demo account
News & Analysis
Catch up on what you might
have missed in the market.