

Symmetrical Triangle Patterns help identify market breakdowns (price fall) and breakouts (price rise), and in turn, help you plot the entry and exit prices for profitable Forex trading. In this article, we look at how you can trade with the Symmetrical Triangle Pattern to maximize trade opportunities.
What is a Symmetrical Triangle Pattern?
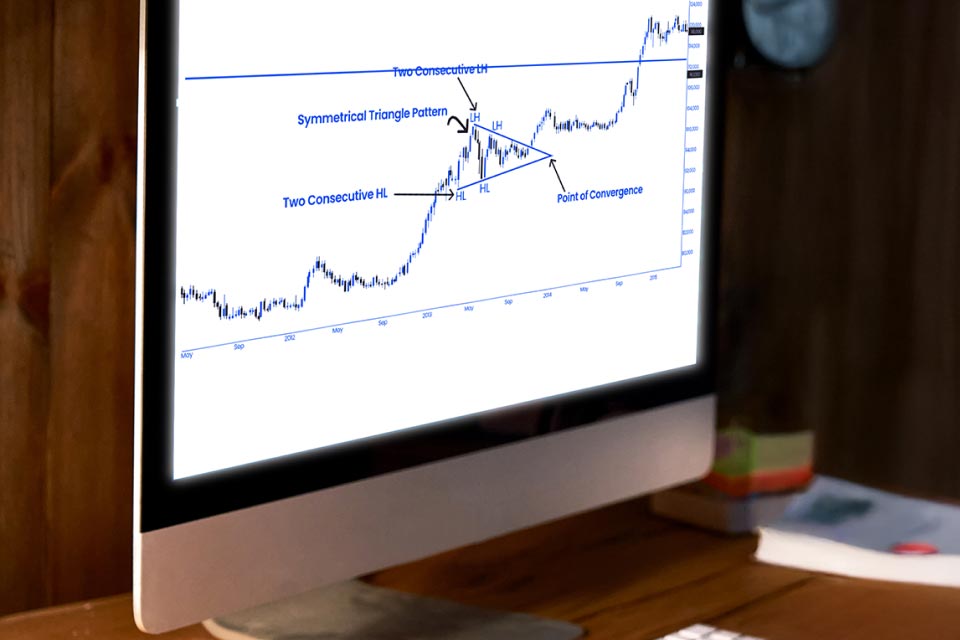
Symmetrical Triangle chart patterns occur when a currency pair’s price gets consolidated in a way that generates two converging lines that both have equal or similar slopes. In other words, it represents a period of consolidation right before the currency pair price is forced to breakdown or breakout.
This can lead to two types of Symmetrical Triangle patterns:
Bullish Symmetrical Triangle Pattern
It indicates a continuing bullish trend which is identified by a continued upward movement in the market after the triangle forms. This suggests that the prices will rise in the future, sending traders a signal to place more buy orders in the market to maximize trade opportunities.
Bearish Symmetrical Triangle Pattern
It indicates a continuing bearish trend which is identified by a continued downward movement in the market after the triangle form. This suggests that the prices will fall in the future, sending traders a signal to place more sell orders in the market to minimise losses.
It is important to note that for Symmetrical Triangle patterns, the stop-loss is usually placed right below the breakout point. For instance, if the currency pair breaks out at $10, then the traders would put a stop-loss order right below $10.

An example of Symmetrical Triangle Pattern
For example, a Symmetrical Triangle Pattern for a currency pair USD/EUR may start at $100 and increase to $150 before the price starts falling in the future. Breakout in this position can be anywhere between $100-$150.
Let us consider that the currency pair breaks out at $120, with a price target of $170 In the future. In this case, the stop-loss order can be placed right below the breakout point, which is $120, to minimise losses.
- The lower trendline of the triangle in the Forex chart indicates support levels. This sends traders a buying signal as the market is expected to change its direction and take an uptrend
- The upper trendline of the triangle in the Forex chart indicates resistance levels. This sends traders a selling signal as the market is expected to change its direction and take a downtrend
How to trade with a Symmetrical Triangle Pattern
1. Identify lower highs and higher lows
You can locate these higher lows and lower highs by studying the Forex market chart. Any sharp increase in the currency pair price is the high price point, and a sharp decrease in the currency pair price is the low price point.

2. Connect the points
Once you have found your two higher lows and lower highs, connect these two price points (high and low) for both the high and low currency pair prices to get an ascending trendline and descending trendline. Once you connect both these lines, you will see a triangle-shaped figure in the chart.
3. Check the current market movement
Since the Symmetrical Triangle Pattern is a continuation pattern and sends continuing market signals, you need to identify the previous market movement. Once you identify the market movement before the triangle formation, it gives you a rough idea of the existing movement in the market. For example, let's assume, you witness a bullish trend in the market. This chart pattern will then help you identify the breakout direction. Traders are suggested to trade in the same direction of the market to make significant profits.
- In case there is a bullish trend, traders receive a buy signal to profit from the increasing prices
- In case there is a bearish trend, traders receive a sell signal to protect themselves from the falling market

4. Wait for a breakout or breakdown
The Symmetrical Triangle Pattern helps confirm the breakout or breakdown in the market through a candlestick pattern, either closing above the Symmetrical Triangle’s trendline or below it. When the breakout occurs above the trendlines, it sends traders a buy signal with an expectation of a price increase in the market In case there is a bearish breakout, which means the price closes below the downside trendline, it sends traders a signal to place sell orders and exit the market due to the expected fall in the prices.

5. Place take profit and stop-loss orders
The Symmetrical Triangle Pattern sends traders the signal to place orders equal to the height of the triangle. The height of the triangle is the distance between the highest point and the lowest point.

Similarly, stop-loss orders for a buy trade can be placed right below the low price point before a breakout occurs. This helps traders minimise their losses if the market moves against them.
Trade the Symmetrical Triangle Pattern to identify market entries and exits
With the Symmetrical Triangle Pattern, you can trade Forex market consolidations and place successful entry and exit orders by waiting for the breakdowns or breakouts. Blueberry makes it easier for you to ace Forex trading and identify chart patterns with a seamless trading experience, tight spreads, and a wide range of tools. You can sign up for a live trading account to get started or try our demo account to experiment with different trading strategies.