The Bearish Gartley Pattern
The Bearish Gartley pattern was introduced in 1935, by H.M. Gartley in his book, “Profits in the Stock Market”. The pattern helps Forex traders in identifying higher probabilities of selling opportunities. Hence, it gives the trader the favorable exit point for a long position that benefits them. If you are looking for a favorable risk-reward ratio, the Bearish Gartley pattern can help you manage risks effectively.
What is the Gartley Pattern
The Gartley pattern, in general, is a harmonic pattern that depends on the Fibonacci ratios and numbers. A Fibonacci number is an integer in the infinite sequence, with the first two terms being 1 and each succeeding term being the sum of the previous two numbers. These numbers themselves determine the Fibonacci ratios. The Gartley pattern can either be a Bullish Gartley pattern or a Bearish Gartley pattern in Forex trading. The Gartley pattern assists traders in identifying high and low reactions which gives them favorable buy and sell opportunities that define the accurate entry and exit levels in the Forex market. Since it is a highly traded pattern, it also enables traders to understand low-risk opportunities seamlessly. Traders use the Gartley pattern to highlight support and resistance levels in the Forex market. At the support level, the prices stop falling, and at the resistance level, the prices stop increasing. The pattern provides a broad overview of where the currency prices will go in the long term, giving the traders the right direction to trade-in.
How to draw a Gartley pattern
Depending on various points with a general price movement, the Gartley patterns are mainly used for Bullish trends that experience a Bearish retracement, or overall Bearish trends that experience a Bullish retracement. Every swing in this chart conforms to a particular Fibonacci level. Here is how we can structure the Bearish Gartley pattern:
X to A
Every Gartley movement begins from point X, followed by a point called A. There is no specific rule to identify the leg of X to point A. In a Bearish Gartley pattern, the first leg is identified when the price falls from point X towards point A, also called the most extended leg in the entire pattern.
A to B
At point A, Fibonacci sets off to become relevant, and the distance that is between point A followed by point B should be somewhere around the distance from point X to point A. B shall always be lower than point X. Otherwise, the pattern remains invalid.
B to C
The price swing again falls from point B to point C, with a retracement that is not below point A.
C to D
Extending the leg of B to point C, we come to a new point called D. This point D shall be higher than point B but lower than point X.
A to D
Once the pattern is completed as we reach point D, it is vital for traders to measure the total movement from point A to point D. The movement gives traders the total change in the price till now. In this pattern, XA is a Bearish line, AB is bullish, BC is again Bearish, and CD is bullish.

What is the Bearish Gartley pattern?
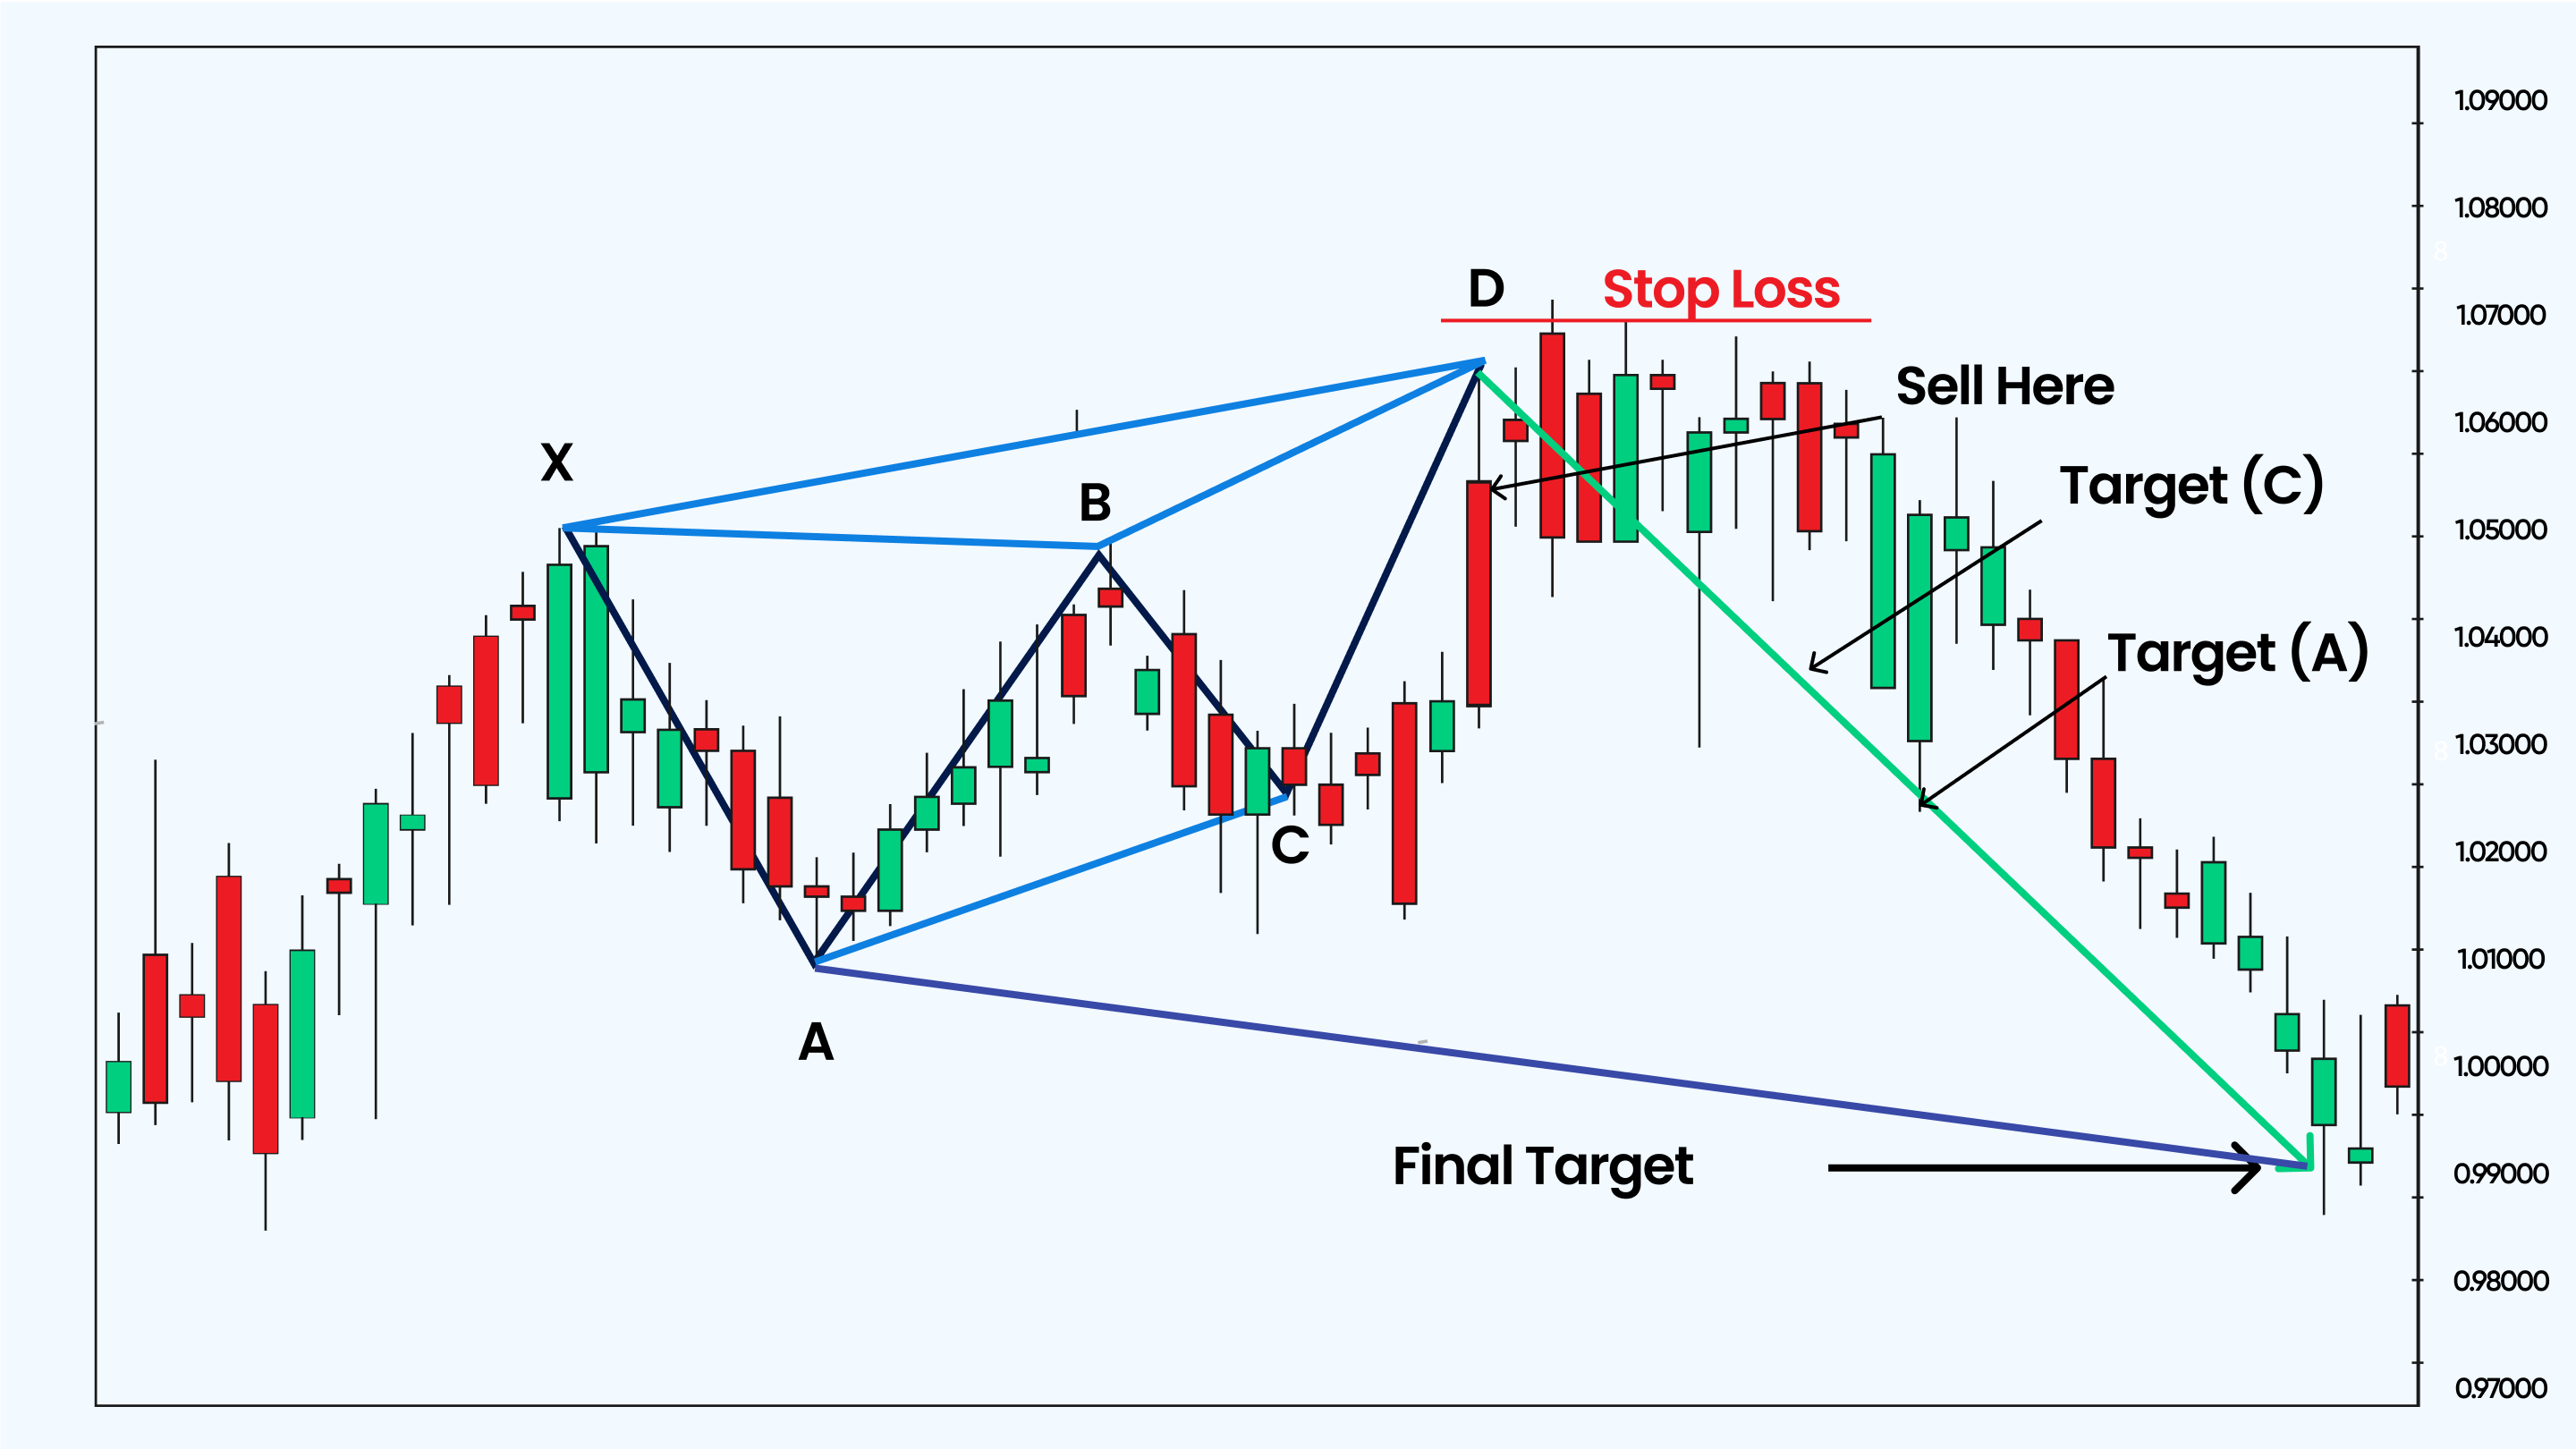
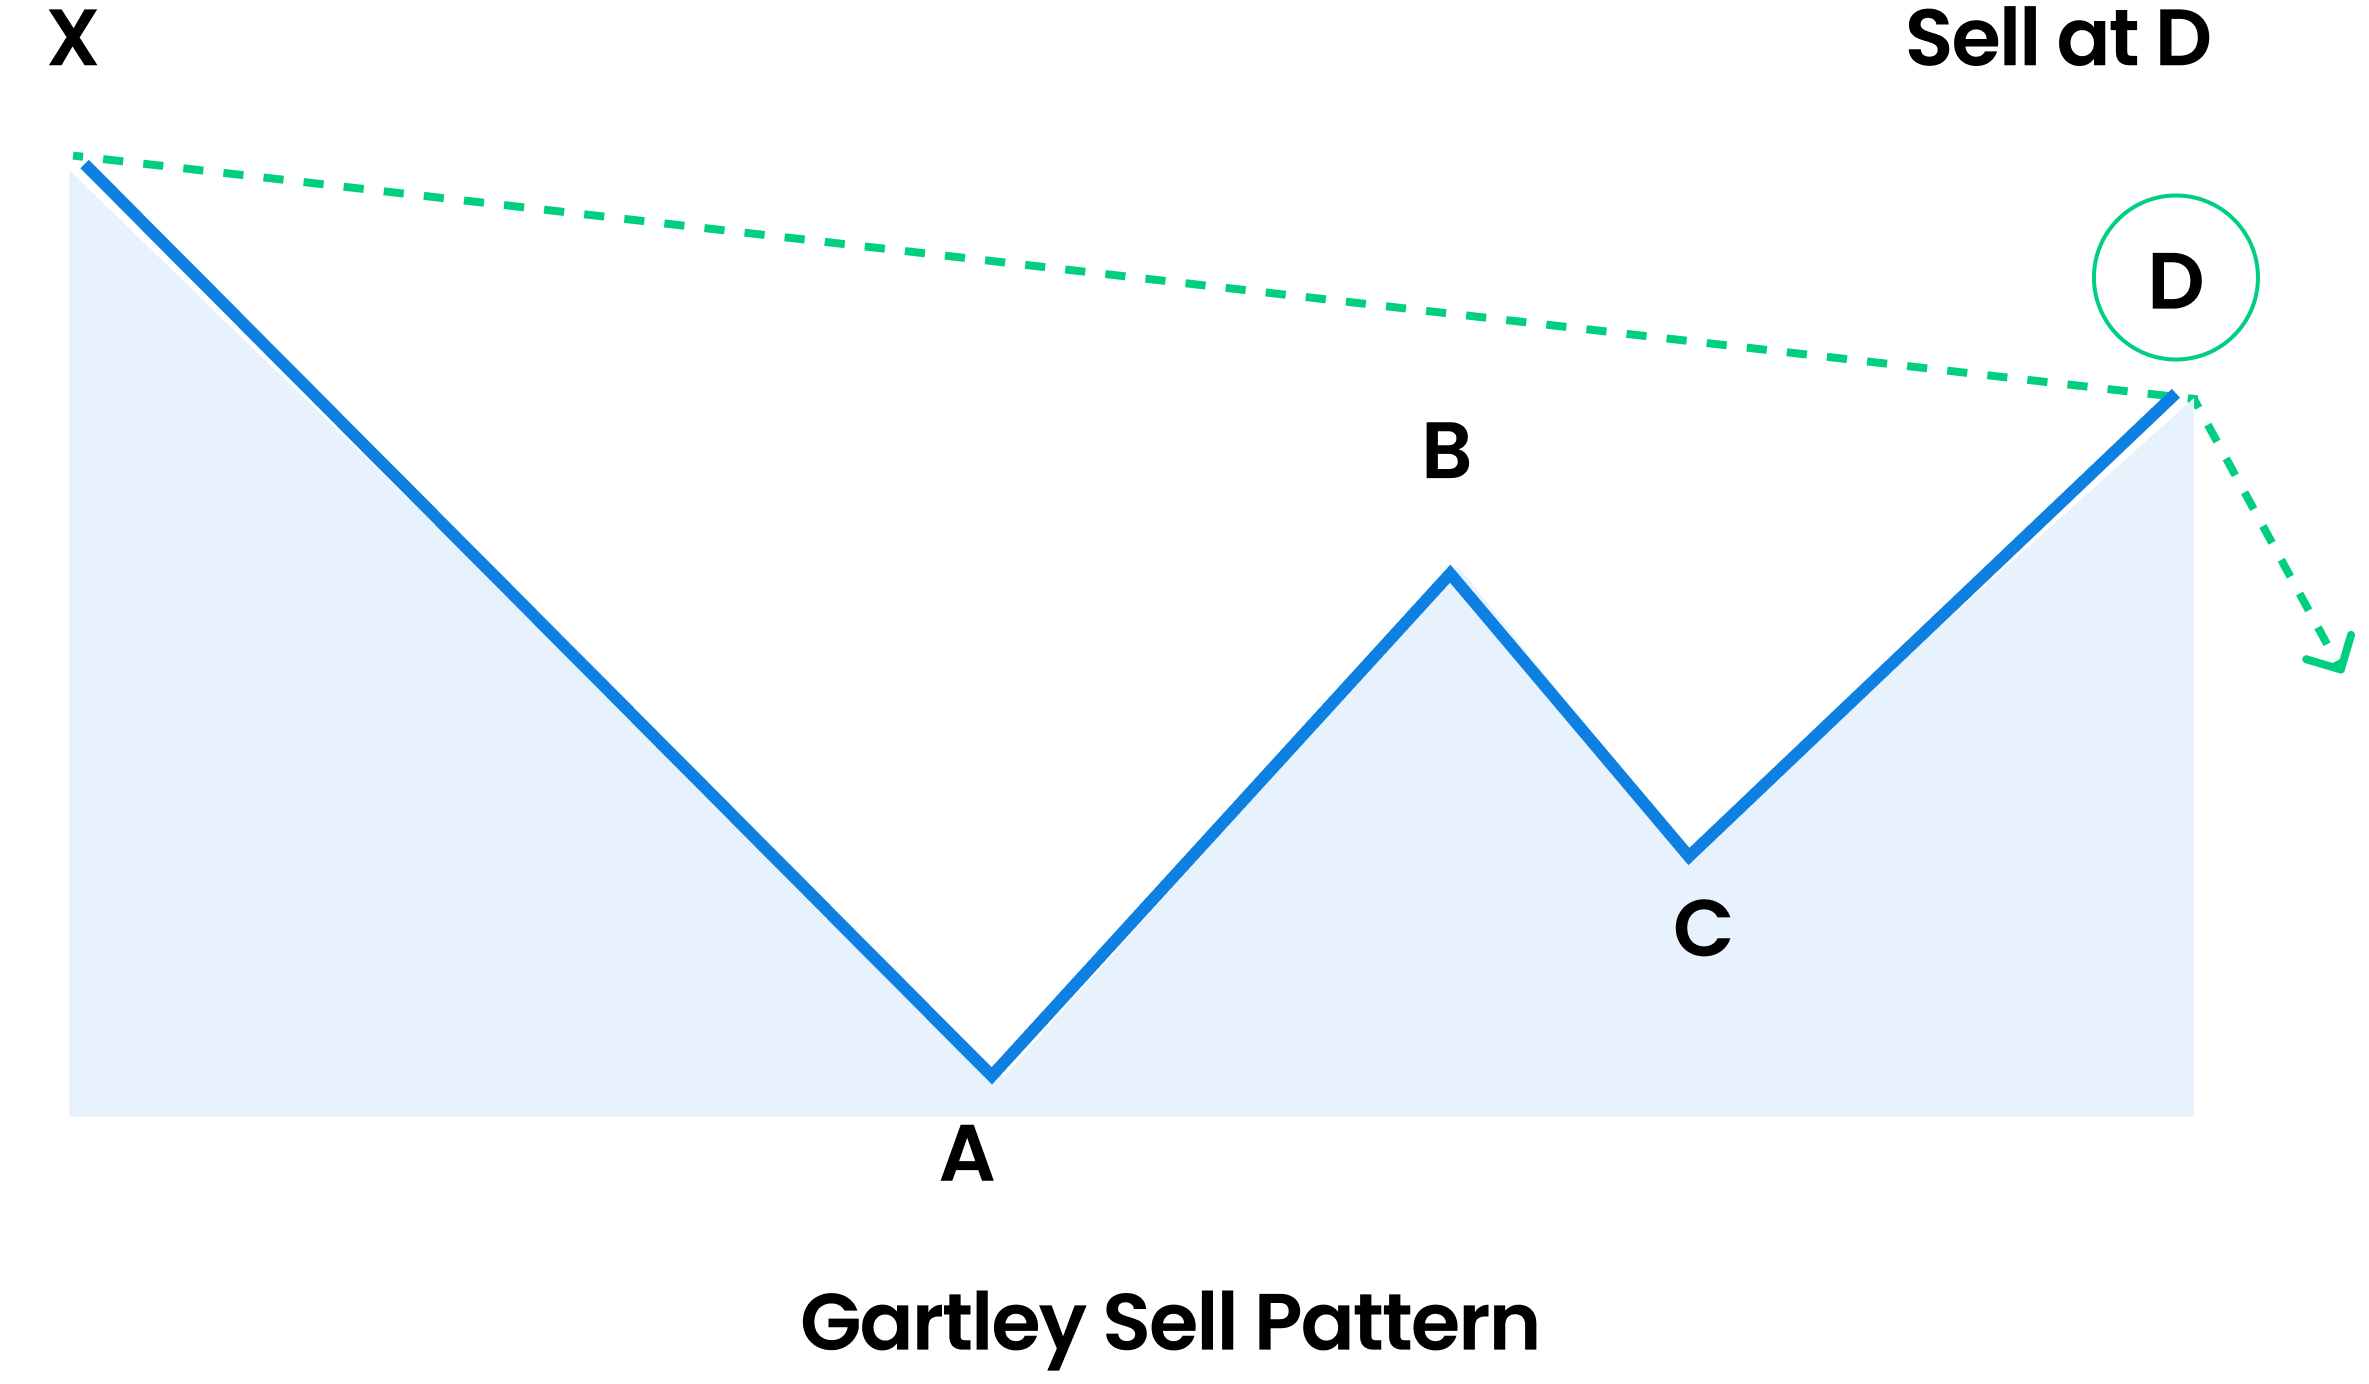
The Bearish Gartley pattern starts at a higher point, coming to a lower price swing. As mentioned above, it gives high selling opportunities to traders and helps them identify the right exit point in the Forex market. In contrast, the Bullish Gartley point starts with a low price swing, followed by a higher price swing. The Bullish Gartley pattern provides the traders with high buying opportunities and helps them identify accurate entry points in the Forex market. The Bearish Gartley pattern contains four consecutive price swings and is represented as a geometric pattern depicting the letter ‘W.’ It is always preceded by a significantly high point on the chart that we call X. The chart expectation is a price reversal, following the CD point, implying that prices will start falling from point D. AB shall always be equal to CD as the graph completes, which also means that the Bearish Gartley helps traders identify exit and entry or sell and buy points in the Forex market. A market reversal takes place from point B, also known as the Fibonacci retracement. It is used by traders to find risk and reward ratios while trading a trend. The trader ultimately receives the selling point in this chart pattern at point D.

How to trade in a Bearish Gartley pattern
The first and foremost step is to confirm whether the Gartley pattern you are identifying is valid or invalid. The next step is to recognize the four price moves on the chart, which are responsive to their Fibonacci levels. You can label the price swings as A, B, C, D, and X to estimate the total pattern size clearly. A trader places a sell order at point D since they identify or recognize that the market is going to fall further. In the Bearish Gartley pattern, the trader trades to the short side.
Bearish Gartley pattern stop-loss
A stop-loss order is recommended to protect yourself from unexpected price swings. A Bearish Gartley trade stop-loss is found above point D of the pattern. Once a Bearish Gartley trade is opened and the trader books a stop-loss order, they will have to wait for the price to swing in their favor. When it does, the trader needs to decide how long they wish to remain in the trade. Generally, it is recommended that the trader should enter or exit a full position only after point D and scale-out later, at different points. You can still keep a small part of the trade open if the price movements are strong enough. Trend lines, candle patterns, and more can be used with the Gartley pattern to find the correct entry/exit points which are near to accurate. However, you can stay in the trade for as long as possible if the price movement doesn’t show any signs of interruptions.
Final words
The Bearish Gartley pattern is the pattern that gives traders favorable exit/sell opportunities and it is an important pattern to consider when you are looking for more profit. Whether you are new to Forex trader or you are an experience trader, Blueberry Markets can offer a seamless Forex trading experience with top-notch support, transparent information, and easily manageable trade accounts.
Recommended Topics
-
Guide to Utilizing a No Stop-loss Trading Strategy in Forex
Stop-loss orders can sometimes make a trade order restrictive, which could eventually lead traders to get out of a trade prematurely due to a false market signal.
-
How to Copy Trade With MetaTrader
Copy trading provides a useful way for beginner level traders to learn from experienced traders.
-
What are Forex Expert Advisors?
Forex Expert Advisors (EAs) enable the automation of forex trading.
-
How to Use The Accumulation/Distribution Indictor in Forex
The Accumulation/Distribution (A/D) indicator can determine buying and selling pressures of a currency pair as it helps identify the relationship between the currency pair's price and volume.
-
What is Commodity Channel Index?
The Commodity Channel Index (CCI) is a technical indicator that can identify overbought or oversold levels in market conditions as well as potential trend reversals and trade signals.
-
Top Fundamental Trading Strategies You Should Know
Fundamental trading strategies are popular among traders who want to make informed investment decisions based on real-world data and events rather than solely on technical analysis.
-
How to Use Martingale Strategy For Trading
The Martingale strategy acts as a popular high-risk trading strategy used in various financial markets including Forex and stocks.
-
What is The Forex Linear Regression?
Forex linear regression enables you to predict future price movements by comparing the current and historical currency pair prices.
-
Top Advanced Forex Trading Strategies You Should Know
Advanced forex trading strategies are perfect for experienced forex traders.
-
What is The Oscillator of Moving Average in Forex?
The Oscillator of Moving Average (OsMA) is a technical indicator that helps in determining a trend’s strength in the forex market.
-
What Are Bear and Bull Power Indicators?
Bear and bull power indicators in forex measure the power of bears (sellers) and bulls (buyers) to identify ideal entry points.
-
How to Trade With The On Balance Volume Indicator
The On Balance Volume (OBV) indicator analyses the forex price momentum to measure the market’s buying and selling pressure.
-
How to Use The Alligator Indicator in Forex Trading
The Alligator indicator can identify market trends and determine ideal entry and exit points based on the trend’s strength.
-
How to Use Inside Bar Trading Strategy
Inside bar trading offers ideal stop-loss positions and helps identify strong breakout levels.
-
What is the Martingale Trading Strategy in Forex?
The Martingale trading strategy increases the possibility of winning a trade in the forex market.
-
How to Use The Forex Arbitrage Trading Strategy
Forex arbitrage trading strategy allows you to profit from the difference in currency pair prices offered by different forex brokers.
-
The Beginner’s Guide to MQL5
MetaTrader, as a platform, has built-in functions that assist in technical analysis and trade management while also allowing traders to develop their own indicators and trading strategies.
-
How to Use DeMarker Indicator For Forex Trading
Every trader needs to know precisely when to enter or exit a forex market.
-
How to Use The Accelerator Oscillator For Forex Trading
The Accelerator Oscillator indicator helps detect different trading values that protect traders from entering bad trades.
-
A Forex Trader’s Guide to Awesome Oscillator
When you understand market momentum, you can better identify market reversals.
-
What is Money Flow Index?
The Money Flow Index can analyse the volume and price of currency pairs in the market.
-
What is The Ichimoku Kinko Hyo Indicator?
The Ichimoku Kinko Hyo indicator provides traders with the market’s current momentum, direction and trend strength.
-
Top Pullback Trading Strategies
Pullback trading strategies provide traders with ideal entry points to trade along with the existing trend.
-
What is High Wave Candlestick?
The High Wave Candlestick pattern occurs in a highly fluctuating market and provides traders with entry and exit levels in the current trend.
-
What is the Parabolic SAR indicator?
Identifying market trends becomes easier with the Parabolic SAR indicator as it provides the ideal entry and exit signals in strong trending markets.
-
What is Currency Correlation?
Currency correlations help trade multiple currencies in the forex market by identifying the market trends of each currency pair.
-
Price Action Trading Strategy
A Price Action Trading Strategy helps find ideal entry and exit points depending on expert opinions, news announcements, or technical indicators.
-
Average True Range
Average True Range (ATR) helps in identifying how much a currency pair price has fluctuated. This, in turn, helps traders confirm price levels at which they can enter or exit the market and place stop-loss orders according to the market volatility.
-
Moving Average Crossover
The Moving Average Crossover is a valuable tool to find the middle price-point of a trend in forex trading. When currency prices crossover their current moving averages, it helps traders identify the favorable buying or selling points for the currency.
-
What is the Bullish Engulfing Candlestick?
Bullish Engulfing Candlesticks helps in identifying an uptrend reversal in the market. This candlestick pattern stands out because a trader does not need to wait until the entire pattern is completed to enter a trade.
-
How To Trade The Gartley Pattern
The Gartley pattern helps identify price breakouts and signals where the currency pairs are headed. The pattern is also widely used in the forex market to determine strong support and resistance levels.
-
How to Trade Forex With NFP V-Shaped Reversal
A Non Farm Payroll (NFP) V-shaped reversal refers to a sudden increase or decrease in the currency pair prices right after an NFP report is released.
-
Candlestick Patterns: Top Candlestick Charts Every Trader Should Know
Candlestick patterns depict the price movement of assets in a graphical manner. Candlestick patterns also enable traders to predict market behaviour.
-
What is the Evening Star Candlestick Pattern?
Evening Star Candlestick Patterns help traders identify ideal exit levels in the forex market by signalling a slowed upward momentum and strengthened downward momentum.
-
How to Use Ichimoku Cloud in Forex?
The Ichimoku Cloud provides a clear market trend direction to the traders and helps them make market decisions accordingly.
-
Pennants Pattern: How to trade bearish and bullish pennants
Pennant Patterns work as a continuation signal in the forex market and help identify the ideal entry and exit price points
-
How to Trade Forex With Renko Charts
Renko Chart is a technical indicator that provides strong market trend directions by filtering out minor price movements
-
What are Ascending and Descending Triangle Patterns?
The Ascending and Descending Triangle Patterns confirm continued trends in the forex market.
-
How to Identify Cup and Handle Pattern in Forex Trading
The Cup and Handle Pattern is a technical price chart that forms the shape of a Cup and a Handle, which indicates a bullish reversal signal.
-
What is the Head and Shoulders pattern?
The Head and Shoulders pattern is a trend reversal indicator that predicts bullish to bearish and bearish to bullish reversals in the forex market.
-
What is the Hammer Candlestick Pattern?
Hammer Candlesticks enable traders to identify potential market reversal points, determine the ideal time to enter the market and place buy or sell orders accordingly.
-
What is The Opening Range Breakout Strategy
The Opening Range Breakout (ORB) Strategy involves taking forex positions when the currency pair prices break below or above the previous day's high or low
-
Morning Star Indicator
The Morning Star Indicator helps identify strong trend reversals in the forex market and enables you to take trade position entry decisions accordingly.
-
How Does Stochastic Indicator Work in Forex Trading?
Stochastic Indicator helps traders identify overbought and oversold market conditions that substantially lead to market reversals.
-
Favourite Fib Fibonacci Retracement
Fibonacci retracement strategies help traders identify the market's support and resistance levels, trend reversal points, and entry and exit decisions.
-
Heikin Ashi Candlestick Pattern
The Heikin Ashi Candlestick pattern is almost the same as the traditional candlesticks, with one big difference—the former is an averaged out version of the latter.
-
Multiple Time Frame Analysis in Forex
By monitoring different currency pairs in different time frames, you can make your Forex trades more successful and profitable.
-
What are Bollinger Bands?
The Bollinger bands can help identify overbought and oversold market conditions, protecting you against placing any orders that could lead to losses.
-
Andrew's Pitchfork Trading Strategy
Andrew's Pitchfork is a Forex trading strategy that can predict protracted market swings and help you in identifying potential market trends that can indicate potential exit and entry points.
-
Fibonacci Retracement
Fibonacci retracements are one of the most popular methods for predicting currency prices in the Forex market. Predicting upward or downward market movement can help traders with accurate price analysis for exiting or entering the market.
-
Trading in Volatile Markets
Forex volatility is the measure of how frequently a currency's value changes. A currency either has high volatility or low volatility depending on how much its value deviates from its average value.
-
The ABCD pattern
One of the most classic chart patterns, the Forex ABCD pattern represents the perfect harmony between price and time.
-
The Bullish 3 Drive pattern
The Bullish Three Drive pattern in Forex trading is a rare pattern that gives traders information about the Forex market's potential at its most Bearish point, and in turn, suggests probabilities for a market reversal.
-
What is the MACD Indicator?
The Moving Average Convergence Divergence (MACD) indicator helps traders quickly identify short-term trend directions and reversals in the forex markets. You can use the MACD indicator to determine a currency pair price trend's severity and measure its price's momentum and even identify the bearish and bullish movements in the currency pair prices.
Guide to Forex
Trading indicators.
Enter your details to get a copy of our
free eBook
Start a risk free
demo account
News & Analysis
Catch up on what you might
have missed in the market.