

Fibonacci retracements are one of the most popular methods for predicting currency prices in the Forex market. Predicting upward or downward market movement can help traders with accurate price analysis for exiting or entering the market.
The Fibonacci analysis equips you with the insight you can use in trading the volatile market. In this article, we discuss everything you should know about Fibonacci retracement in Forex trading.
The following information is provided solely for educational purposes and does not constitute personal advice or a recommendation to trade margin FX/CFDs.
KEY TAKEAWAYS:
-
What it does: Fibonacci retracement identifies potential support and resistance levels where price may reverse during pullbacks in trending markets
-
Common levels: 23.6%, 38.2%, 50%, 61.8%, and 78.6% — with 61.8% (the golden ratio) being most significant
-
How to use: Identify swing highs and lows, apply the Fibonacci tool to draw horizontal lines, then watch for price reactions at these levels
-
Best practice: Always combine Fibonacci levels with other technical indicators like moving averages, RSI, or volume for confirmation — never trade Fibonacci levels in isolation
Key Fibonacci Levels and Their Significance
Understanding what each Fibonacci level represents helps you make better trading decisions. Here's how traders interpret each retracement percentage:
|
Level |
Percentage |
Significance |
Trading Application |
|
Starting Point |
0.0% |
Beginning of the measured move |
Reference point for trend start |
|
Shallow Retracement |
23.6% |
Minor pullback, strong trend |
Quick entries in powerful trends |
|
Moderate Retracement |
38.2% |
Common retracement level |
Balance between risk and opportunity |
|
Half Retracement |
50.0% |
Psychological midpoint |
Not a true Fibonacci ratio but widely watched |
|
Golden Ratio |
61.8% |
Most reliable level |
Primary reversal zone, highest probability |
|
Deep Retracement |
78.6% |
Significant pullback |
Last chance before trend invalidation |
|
Complete Retracement |
100.0% |
Full return to starting point |
Potential trend reversal signal |
The 61.8% level, known as the golden ratio, deserves special attention. This mathematical constant appears throughout nature and financial markets, making it the most respected Fibonacci level among professional traders.
Understanding Fibonacci Extensions
While Fibonacci retracements help you identify entry points during pullbacks, Fibonacci extensions project potential price targets when the trend resumes. Think of retracements as "where to get in" and extensions as "where to get out."
How Extensions Differ from Retracements
Extensions measure beyond the original price move to forecast where the next trend leg might end. After a currency pair completes a retracement and resumes its primary trend, extension levels help you set realistic profit targets.
Common Fibonacci Extension Levels
The most widely used extension levels are:
-
127.2% - First extension target, conservative profit taking
-
161.8% - Primary extension target, the golden ratio extended
-
200.0% - Psychological level, double the original move
-
261.8% - Aggressive target for strong trending markets
Practical Extension Example
Let's say EUR/USD rises from 1.0800 to 1.1200 (a 400-pip move), then retraces to 1.0950. If the uptrend resumes, extension levels would be:
-
127.2% extension: 1.1200 + (400 × 0.272) = 1.1309
-
161.8% extension: 1.1200 + (400 × 0.618) = 1.1447
-
261.8% extension: 1.1200 + (400 × 1.618) = 1.1847
Traders often place partial profit orders at the 127.2% level, then let remaining positions run toward 161.8% or higher, depending on trend strength and market conditions.
Quick Reference: Retracements vs. Extensions
|
Aspect |
Fibonacci Retracements |
Fibonacci Extensions |
|
Purpose |
Identify potential entry points during pullbacks |
Project profit targets during trend continuation |
|
Key Levels |
23.6%, 38.2%, 50%, 61.8%, 78.6% |
127.2%, 161.8%, 200%, 261.8% |
|
Direction |
Measure against the trend (counter-trend movement) |
Measure with the trend (trend continuation) |
|
Use Case |
Buying dips in uptrends, selling rallies in downtrends |
Setting take-profit levels and price targets |
|
When to Apply |
After identifying a completed trend move |
After price resumes from a retracement level |
|
Risk Level |
Entry strategy tool |
Exit strategy tool |
How to Use Fibonacci Retracement in Forex Trading
Applying Fibonacci retracements effectively requires a systematic approach. Here's a practical framework for integrating these levels into your forex trading strategy.
Entry Strategy for Uptrends
When a currency pair is in an established uptrend, use Fibonacci retracements to identify optimal buy entry points during pullbacks:
-
Identify the trend: Confirm the uptrend with higher highs and higher lows on your chart
-
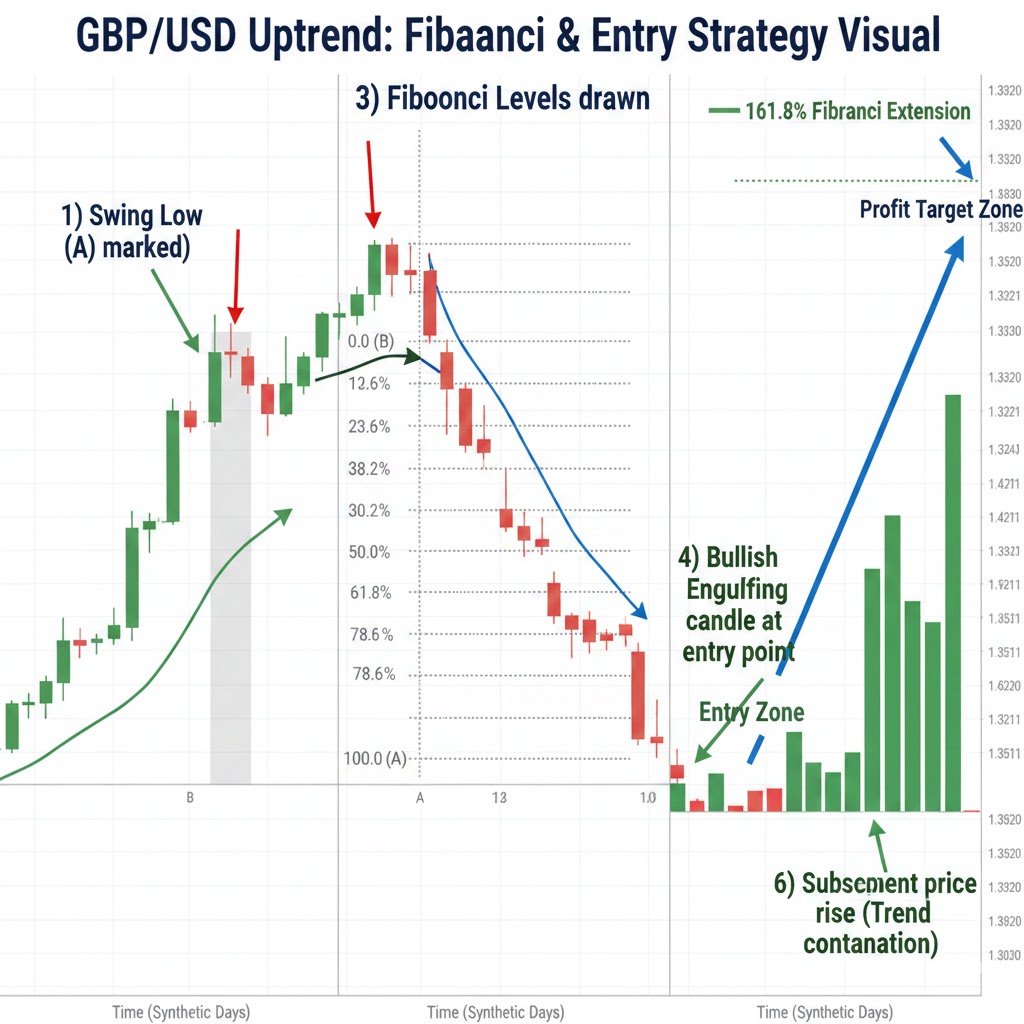
Mark swing points: Place Fibonacci tool from the swing low (bottom) to swing high (top)
-
Watch for retracement: Wait for price to pull back toward a Fibonacci level
-
Look for confluence: Check if the retracement level aligns with previous support, moving averages, or round numbers
-
Confirm reversal signals: Wait for bullish candlestick patterns (engulfing, hammer, morning star) or momentum indicators showing oversold conditions
-
Enter the trade: Place buy orders when confirmation appears at the 38.2%, 50%, or 61.8% retracement level
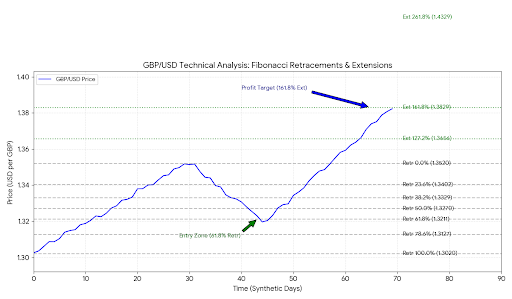
For example, if GBP/USD rises from 1.2500 to 1.2900, the 61.8% retracement level sits at 1.2653. A bullish engulfing candle forming at this level with increasing volume would signal a high-probability entry.
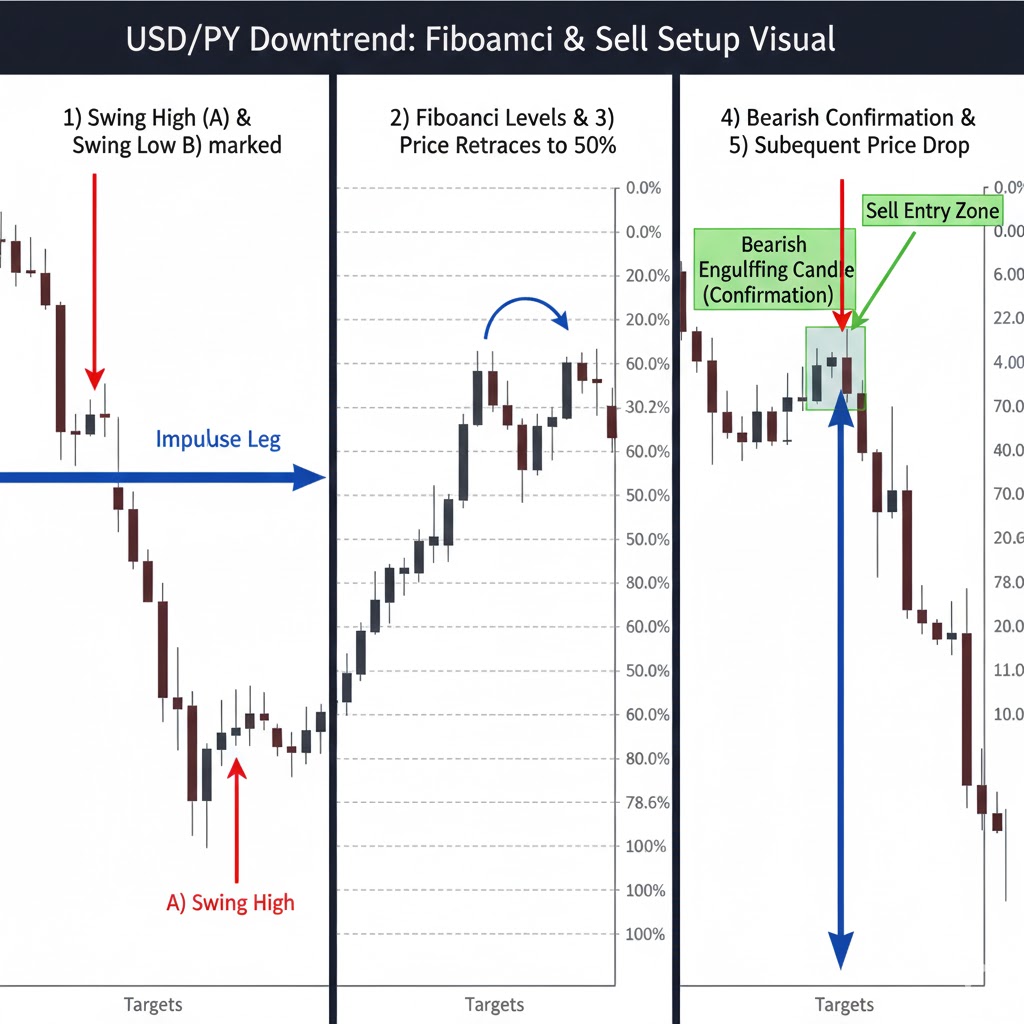
Entry Strategy for Downtrends
In downtrends, the process reverses:
-
Confirm the downtrend: Look for lower highs and lower lows
-
Draw Fibonacci: Place tool from swing high (top) to swing low (bottom)
-
Wait for throwback: Price should rally toward a resistance level
-
Seek confluence: Check alignment with previous resistance or other technical factors
-
Confirm bearish signals: Look for bearish reversal patterns or overbought RSI readings
-
Enter short: Sell when confirmation appears at key retracement levels
Stop-Loss Placement Rules
Protecting your capital is crucial when trading Fibonacci levels:
-
For long trades: Place stops 10-20 pips below the next Fibonacci level (e.g., if entering at 50%, stop below 61.8%)
-
For short trades: Place stops 10-20 pips above the next Fibonacci level
-
Conservative approach: Use the 100% level (original swing point) as your ultimate stop-loss
-
Consider volatility: Wider stops for volatile pairs like GBP/JPY, tighter for EUR/USD
Profit-Taking Strategy
Use a systematic approach to secure gains:
-
First target: Previous swing high (in uptrends) or swing low (in downtrends)
-
Second target: Fibonacci extensions at 127.2% or 161.8%
-
Scaling out: Take 50% profit at the first target, let the remainder run toward extensions
-
Trailing stops: Move stops to break-even once price moves 50% toward your target
Combining Fibonacci with Other Technical Indicators
Fibonacci retracements work best when combined with other technical tools. Using multiple confirmation signals dramatically improves your trading accuracy and helps you avoid false signals.
Fibonacci + Moving Averages
Moving averages create powerful confluence zones when they align with Fibonacci levels. If the 50-period moving average sits near the 61.8% retracement level, this double support significantly increases the probability of a bounce.
How to apply: Plot the 50-day and 200-day moving averages on your chart. When a Fibonacci level coincides with a moving average, treat this as a high-priority zone. For instance, if EUR/USD retraces to 1.0850 where both the 61.8% Fibonacci level and the 50-day MA converge, this represents a strong support area worth trading.
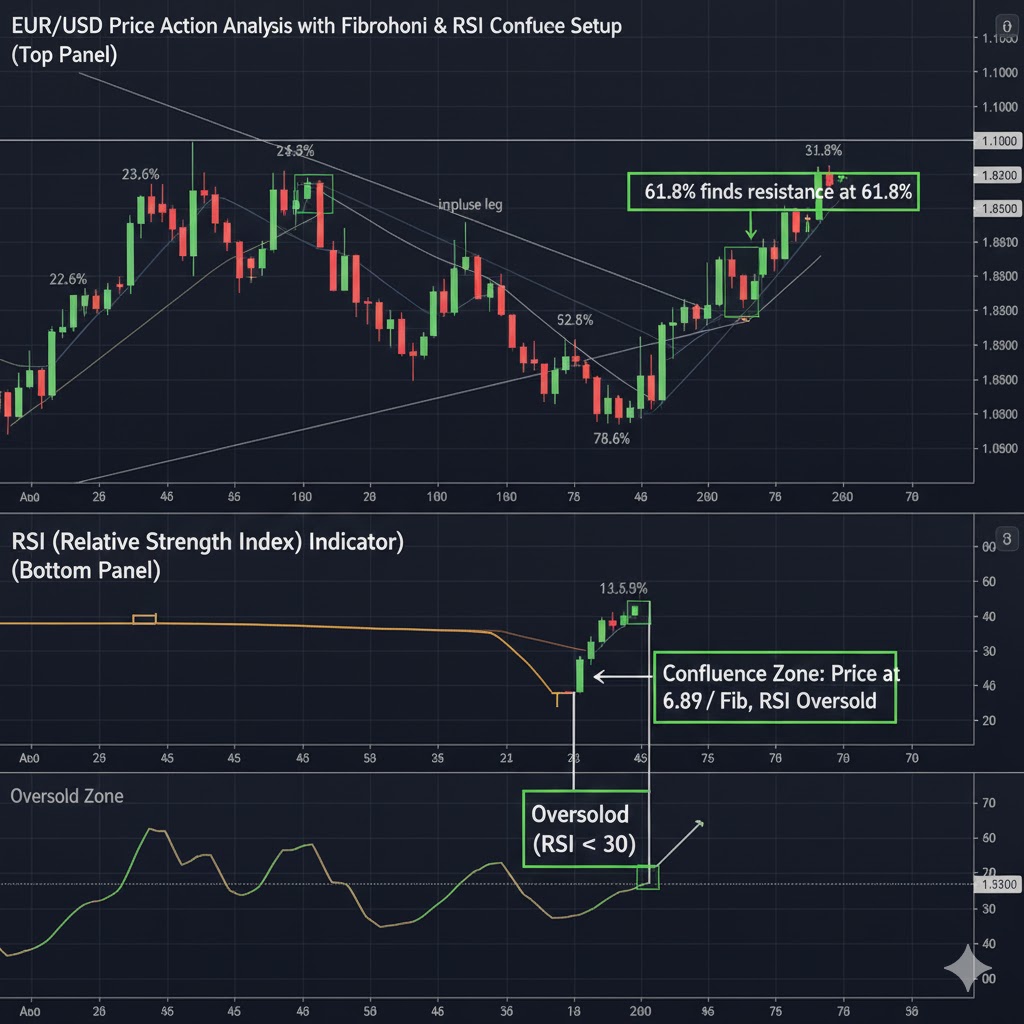
Fibonacci + Relative Strength Index (RSI)
RSI helps confirm whether a Fibonacci level presents a genuine reversal opportunity. The combination addresses a key Fibonacci weakness: timing.
How to apply: When price reaches a Fibonacci retracement level, check the RSI. In uptrends, look for RSI readings below 30 (oversold) at support levels. In downtrends, look for RSI above 70 (overbought) at resistance levels. If GBP/JPY retraces to the 50% Fibonacci level and RSI shows 28, the convergence of technical support and oversold conditions strengthens the buy signal.
Fibonacci + Volume Analysis
Volume validates whether market participants are actually responding to a Fibonacci level or if it's merely a coincidental price touch.
How to apply: Watch for volume spikes when price approaches Fibonacci levels. Increasing volume during a bounce off a retracement level confirms genuine buying or selling interest. Declining volume suggests weak conviction and possible failure of the level.
Fibonacci + Support and Resistance Zones
Historical support and resistance areas carry psychological weight. When these align with Fibonacci levels, you've found institutional-grade trading zones.
How to apply: Mark major support and resistance levels from previous price action. If the 61.8% Fibonacci level matches a previous swing low that acted as support three times before, this "triple confluence" creates a compelling trading opportunity.
Multi-Indicator Confirmation Checklist
Before entering a trade based on a Fibonacci level, verify:
-
✓ Price has reached a key Fibonacci level (38.2%, 50%, or 61.8%)
-
✓ At least one additional technical indicator confirms the signal
-
✓ Volume supports the anticipated price direction
-
✓ No major news events scheduled within the next 4 hours
-
✓ Risk-reward ratio exceeds 1:2
Limitations and Risks of Fibonacci Retracement
While Fibonacci retracements offer valuable insights, understanding their limitations prevents costly mistakes. No technical tool predicts market movements with certainty, and Fibonacci analysis has specific weaknesses you need to recognize.
Fibonacci Levels Are Not Foolproof
Price doesn't always respect Fibonacci levels. Markets can blow through what appears to be strong support or resistance without hesitation, especially during high-impact news events or when institutional money enters aggressively. A seemingly perfect 61.8% retracement setup can fail instantly if a central bank announcement surprises the market.
Subjectivity in Swing Point Selection
Different traders identify different swing highs and lows, leading to different Fibonacci levels on the same chart. This subjectivity means your 61.8% level might be another trader's 50% level. The solution: focus on recent, obvious swing points that most market participants would recognize — typically the most extreme price points over the past 20-50 candles.
False Signals and Breakouts
Price often "tests" Fibonacci levels before either bouncing or breaking through completely. These false signals can trigger stop-losses prematurely. A currency pair might briefly penetrate the 78.6% level by 15 pips, hit your stop-loss, then reverse violently in your originally intended direction. This common scenario is why combining Fibonacci with other confirmation tools matters.
Market Condition Dependency
Fibonacci retracements work best in clearly trending markets. In choppy, range-bound conditions, retracement levels become unreliable as price whipsaws back and forth without conviction. Before applying Fibonacci analysis, confirm you're in a trending market using tools like ADX (Average Directional Index) — readings above 25 indicate sufficient trend strength.
Confirmation Bias Risk
Traders often see what they want to see. If you're bullish on EUR/USD, you might force Fibonacci levels onto the chart to justify a trade you already wanted to take. Combat this by having predefined rules: "I only trade Fibonacci levels when RSI confirms and volume exceeds the 20-period average."
Critical Reminder: Fibonacci retracements identify zones of potential support and resistance, not guaranteed reversal points. Always use proper risk management, never risk more than 1-2% of your account per trade, and require confirmation from additional technical indicators before entering positions.
Frequently Asked Questions
1. What is the most accurate Fibonacci retracement level?
The 61.8% level, known as the golden ratio, is statistically the most reliable Fibonacci retracement level. This level represents a deep retracement that often precedes strong trend continuations. Professional traders prioritize the 61.8% level because it balances two factors: it provides enough of a pullback to offer favorable entry prices while still indicating the primary trend remains intact. That said, "accuracy" depends on market context. In strong trending markets, you might see bounces at shallower levels like 38.2%. In volatile or uncertain markets, price may need to test the 78.6% level before reversing. The key is recognizing that no single level works 100% of the time — which is precisely why combining Fibonacci with other indicators improves your success rate.
2. Should I use Fibonacci retracement in ranging or sideways markets?
No, Fibonacci retracements perform poorly in ranging markets. These levels are designed to identify pullback opportunities within established trends, so they require clear directional movement to be effective. In range-bound markets, price oscillates between horizontal support and resistance without trending, making Fibonacci levels largely irrelevant. Instead, when markets are ranging, focus on horizontal support and resistance levels, oscillators like Stochastic or RSI, and range-trading strategies. Before applying Fibonacci analysis, confirm you're in a trending market using tools like moving averages (price consistently above/below) or the ADX indicator (readings above 25).
3. How do I know if I've drawn my Fibonacci retracement correctly?
Valid Fibonacci retracements require clear, significant swing points. To verify you've drawn it correctly, check these criteria: First, your swing high and swing low should be obvious extremes that most traders would identify — typically the highest high and lowest low over at least 20-30 candles. Second, there should be clear price movement between these points (at least 100 pips for major pairs, more for volatile pairs). Third, other traders should be watching the same levels — you can verify this by checking if your Fibonacci levels align with areas where price action shows indecision (doji candles, increased volume, wicks). Finally, your Fibonacci levels should coincide with other technical factors like round numbers, previous support/resistance, or moving averages. If your 61.8% level sits at 1.0850 while a previous support level exists at 1.0855, you've likely drawn it correctly.
4. What's the difference between Fibonacci retracements and Fibonacci extensions?
Fibonacci retracements measure pullbacks against the trend and help you identify entry points, while Fibonacci extensions project price targets beyond the original move and help you identify exit points. Think of it this way: retracements answer "where should I buy during this dip?" and extensions answer "where should I take profit as the trend continues?" Retracements use levels like 38.2%, 50%, and 61.8% measured from the recent high back toward the recent low. Extensions use levels like 127.2%, 161.8%, and 261.8% measured beyond the original high. In practice, you use retracements to enter trades during corrections and extensions to set profit targets when the trend resumes. Both tools work together as part of a complete trading strategy.
5. Can Fibonacci retracement predict exact price reversals?
No, Fibonacci retracements identify probability zones, not exact reversal points. Price might bounce several pips before or after a Fibonacci level, or it might consolidate around the level before deciding direction. Fibonacci analysis works on the principle that many traders watch these levels, creating self-fulfilling prophecies where enough buying or selling pressure accumulates to influence price — but this isn't guaranteed. This is why professional traders never enter positions the moment price touches a Fibonacci level. Instead, they wait for confirmation signals: bullish candlestick patterns at support levels, RSI showing oversold readings, volume increases indicating genuine interest, or alignment with other technical factors. Fibonacci levels are best viewed as "zones of interest" roughly 10-20 pips wide, not precise lines in the sand.
6. Why should I combine Fibonacci with other indicators instead of trading it alone?
Trading Fibonacci levels in isolation leads to frequent false signals because price often tests levels multiple times before committing to a direction. Other technical indicators provide the confirmation you need to distinguish between a genuine reversal and a temporary pause. For example, you might see price reach the 61.8% level, but without RSI showing oversold conditions or a bullish engulfing candle pattern, you can't determine if buyers are actually stepping in or if price will continue falling. The combination of multiple technical signals dramatically improves your win rate. Consider this: a Fibonacci level alone might offer a 50-55% success rate, but when combined with RSI confirmation and volume validation, that success rate can jump to 65-70%. Professional traders typically require at least two or three confirming factors before entering a trade based on Fibonacci levels.
Master Fibonacci Retracement Through Practice and Discipline
Fibonacci retracement levels offer a powerful framework for identifying high-probability entry and exit points in the forex market. When you combine the 61.8% golden ratio with other technical indicators and proper risk management, you gain a systematic approach to trading that removes emotion from your decisions.
Remember these core principles: Fibonacci works best in clearly trending markets, not sideways chop. Always wait for confirmation signals before entering trades — a Fibonacci level alone isn't enough justification. Use extensions to set realistic profit targets rather than guessing where trends might end. And most importantly, acknowledge the limitations: Fibonacci levels indicate zones of potential support and resistance, not guaranteed reversal points.
The path forward is practice. Start by identifying Fibonacci levels on historical charts and observing how price behaved at each level. Then move to a demo account where you can test strategies without risking real capital. Track your trades, noting which Fibonacci levels produced the best results and which indicator combinations provided the most reliable confirmation signals.
With consistent practice and disciplined application, Fibonacci retracements become an invaluable tool in your technical analysis arsenal, helping you trade with greater confidence and precision in the dynamic forex market.