The Bullish Three Drive Pattern
The Bullish Three Drive pattern in Forex trading is a rare pattern that gives traders information about the Forex market’s potential at its most Bearish point, and in turn, suggests probabilities for a market reversal. The pattern also provides excellent risk-reward ratios for the traders to manage their risks efficiently. The Bullish trend triggers buying opportunities and provides traders with favorable entry points in the Forex market.
What is the three drive pattern?
The three-drive pattern is a harmonic formation that tells traders the possibility of the market reversing with a prolonged price trend. It can help identify both buying and selling opportunities for the traders in the market. It is a powerful chart pattern because it covers not only quantitative aspects of a currency’s price movement but also its qualitative outlook. It helps traders understand the competitive advantage of the currencies that they wish to trade in. The pattern recognizes more significant retracements of the currency’s price and outlines projections to ensure that traders place successful trades in the Forex market. It offers an excellent risk and reward ratio for the traders and suggests the market’s potential at its most bearish phase. By this, we mean that it contains a higher probability for market reversal when the currency prices move against the trader’s will.
What is the Bullish Three Drive pattern
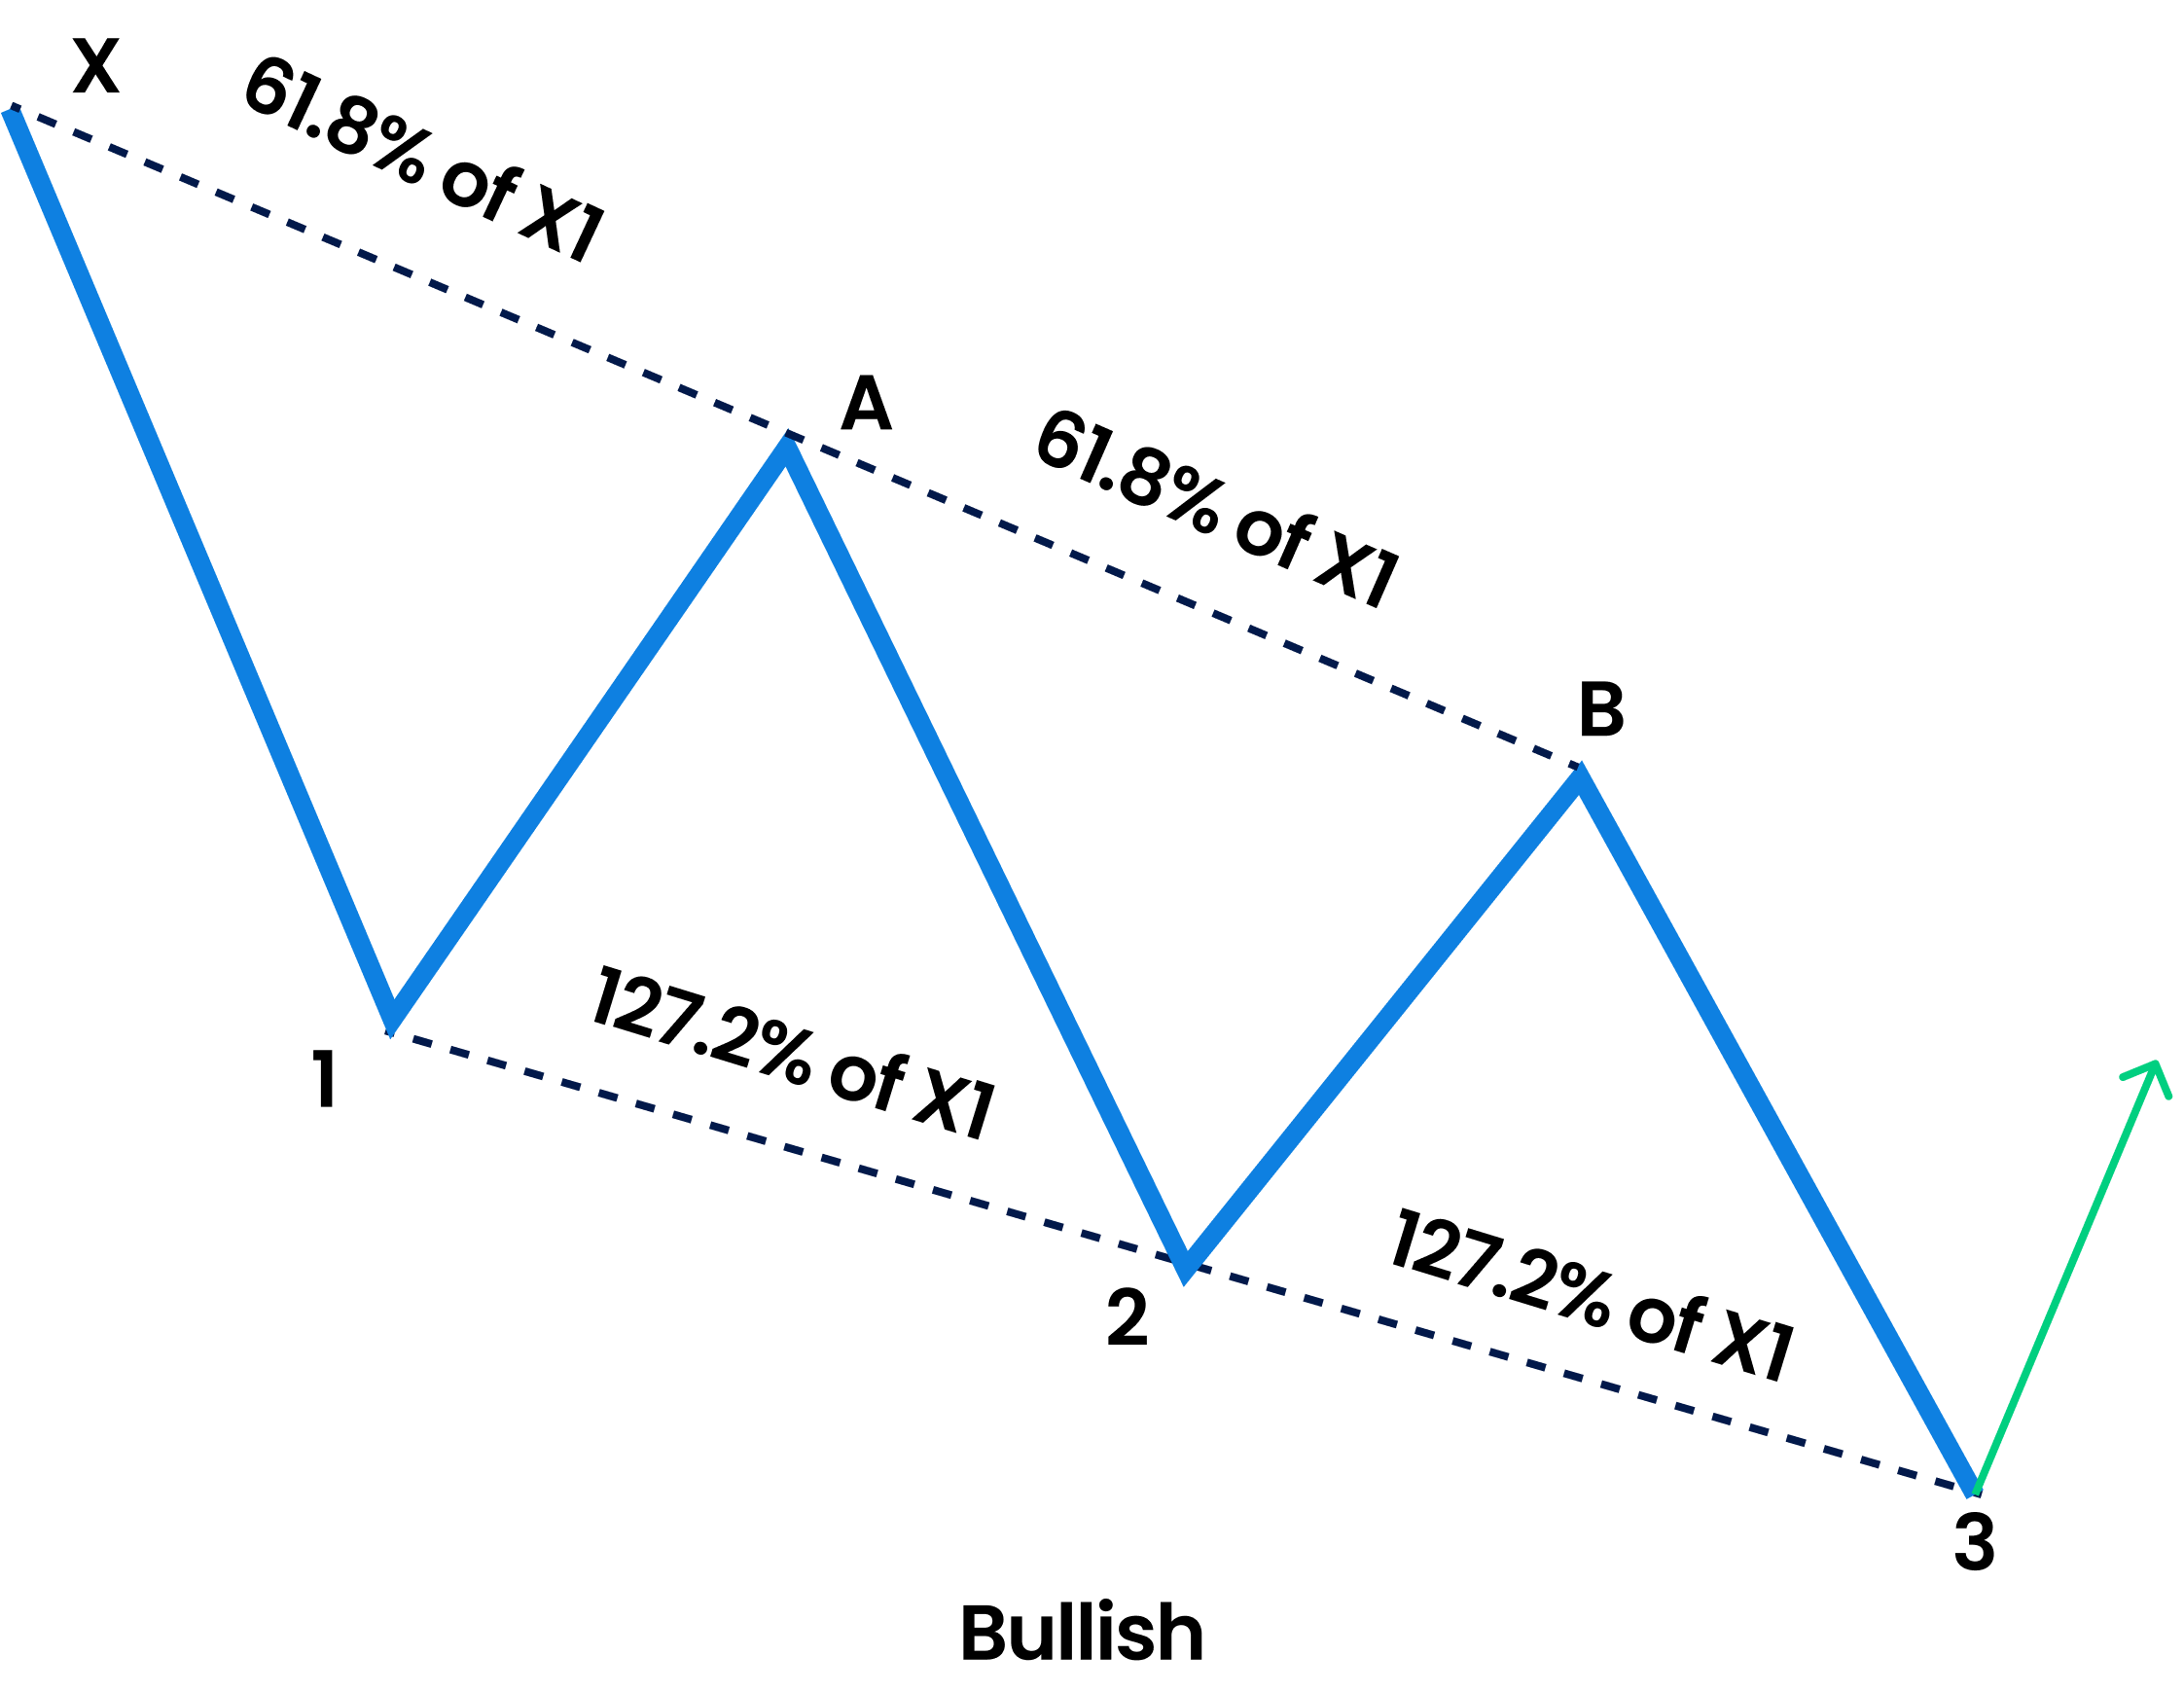
The Bullish Three Drive pattern is used to identify the best buying opportunities in the Forex market for traders. As the name suggests, the Bullish Three Drive pattern has three pushes in the upward direction. It begins with the first move being a bearish swing. The push is followed by a higher retracement to 61.8% level of the first move, giving a point A. The price then turns lower and moves to the second push/drive, completing into 1.27% extension of the first move. After that, the price then goes higher again. It goes to the 61.5% retracement of the second push and gives us point B. The last and final push is a lower one, with the price trading and falling to 1.27% extension of the second push, giving the third push that completes the pattern. At the final point, this zone is called the buying zone for the traders. It is a comparatively rare pattern that considers symmetry as a basis and is formed by two connecting Bullish ABCD patterns followed by a Bullish butterfly pattern. A close cousin of the Bullish Three Drive pattern is the Bullish ABCD pattern, which can also be called the two drive pattern because of how it appears with only two price swings. However, prices reverse more after three moves. Hence, the Bullish Three Drive pattern is considered more precise when we talk about market reversals.

Recognizing the Three Drive pattern
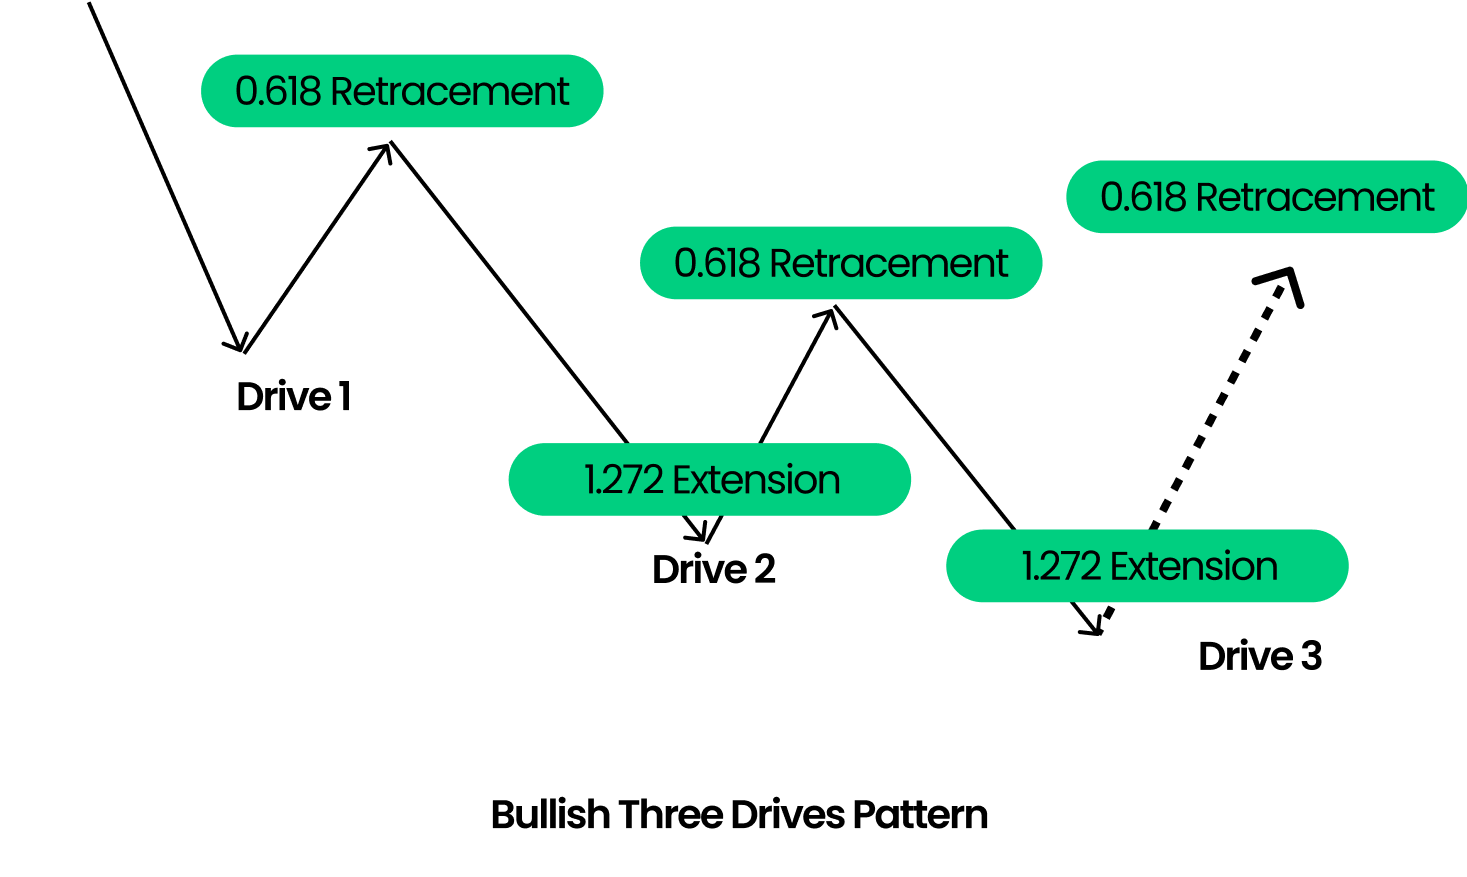
The Three Drive pattern can be formed either at the top of a rally or the bottom of a substantial decline. Since it is a reversal pattern, it always emerges after a strong trend is already established. The Bullish Three Drive pattern is formed by a series of three consecutive higher highs. Each of these highs is measured through the Fibonacci retracement and extension levels. The appropriate levels used in a Three Drive pattern are 0.618% retracement and 1.272% Fibonacci extension.
Recognizing the Three Drive pattern
Traders use the Gartley pattern to highlight support and resistance levels in the Forex market. At the support level, the prices stop falling, and at the resistance level, the prices stop increasing. The pattern provides a broad overview of where the currency prices will go in the long term, giving the traders the right direction to trade-in.
How to draw a Gartley pattern
The Three Drive pattern rules –
- Point A should always be a 61.8% or 0.618 retracement of the first drive.
- Point B should be the same level of retracement as mentioned above of the second drive.
- The second drive should always be an extension of 1.272 or 127.2% of point A.
- The third drive should always be an extension of the same level as mentioned above, point B.
The image attached below shows the graphical view of the three drive pattern and its required Fibonacci retracement and extension points.

Traditionally, a trader can exit or enter the market by closing the trade at the 61.8% retracement level of the entire pattern. Another way they can do it is by setting two targets. The first target in a Bullish three drive trend can be the low swing seen at the start of the pattern. The second target is the low swing seen at the beginning of the second drive. These two targets offer the best combination of winning rate and a favorable risk-reward ratio that enable traders to maximize their profits and minimize their risks.
Trading the Three Drive pattern
A trader can formulate a fully functional trading strategy using a Three Drive pattern. The model can be applied to the Forex market, including an entry mechanism, a confirmation zone, and the risk containment element, also known as stop loss. Identifying an established trend is the first step in a trading setup with the three drive pattern. The Relative Strength Index is essentially incorporated, and a reading of 70 or above is required during a Bullish three drive pattern. This validates an overbought market condition. Once this is confirmed, the trader can execute their entry in the final stages of the last drive or the third price swing. A limit order entry is placed at 127.2% of the Fibonacci extension level.
Placing stop loss
Immediately place a stop order as the buy order is executed. The stop loss is set at 161% Fibonacci extension level of the third drive. This acts as a hidden resistance in an uptrend and provides support following the pattern in the downtrend.
Taking profit
To take a profit, however, the first point is at the start of drive three. The final profit is taken at the beginning of drive two. With this, a trader has a completely functioning trading strategy backed by the three drive pattern.
How can the Three Drive pattern help traders?
The Three Drive pattern depends both on price and time. However, since it is a rare trend to occur, traders should not force themselves to identify it. If the traders do not see it in a chart, it is simply best not to trade it at all. It tells the traders about the market reversal, which occurs after the completion of the third drive. However, some conservative traders look for more confirmation about the price reversal. The targets can be set according to their wish but are generally best suited when placed beyond the last retracement level, as shown by the three drive pattern. The pattern’s non-availability results into a continuation in the previously dominant movement, implying that if the market has been continuously falling, it is more likely that the prices will keep declining. On the other hand, if the prices have previously been increasing, and there is no three drive pattern in the chart, more chances are that the prices will keep on increasing.
Final words
The Three Drive pattern uses chart patterns and technical retracement levels, enabling traders to understand market reversals and benefit from the same. Since it is a rare emerging pattern, it can be easily spotted if it exists in the chart. Blueberry Markets is a Forex trading platform that makes the entire process as easy as clicking a few buttons. Whether you are a seasoned trader or a beginner in the Forex world, you are bound to make successful traders with our help.
Recommended Topics
-
Guide to Utilizing a No Stop-loss Trading Strategy in Forex
Stop-loss orders can sometimes make a trade order restrictive, which could eventually lead traders to get out of a trade prematurely due to a false market signal.
-
How to Copy Trade With MetaTrader
Copy trading provides a useful way for beginner level traders to learn from experienced traders.
-
What are Forex Expert Advisors?
Forex Expert Advisors (EAs) enable the automation of forex trading.
-
How to Use The Accumulation/Distribution Indictor in Forex
The Accumulation/Distribution (A/D) indicator can determine buying and selling pressures of a currency pair as it helps identify the relationship between the currency pair's price and volume.
-
What is Commodity Channel Index?
The Commodity Channel Index (CCI) is a technical indicator that can identify overbought or oversold levels in market conditions as well as potential trend reversals and trade signals.
-
Top Fundamental Trading Strategies You Should Know
Fundamental trading strategies are popular among traders who want to make informed investment decisions based on real-world data and events rather than solely on technical analysis.
-
How to Use Martingale Strategy For Trading
The Martingale strategy acts as a popular high-risk trading strategy used in various financial markets including Forex and stocks.
-
What is The Forex Linear Regression?
Forex linear regression enables you to predict future price movements by comparing the current and historical currency pair prices.
-
Top Advanced Forex Trading Strategies You Should Know
Advanced forex trading strategies are perfect for experienced forex traders.
-
What is The Oscillator of Moving Average in Forex?
The Oscillator of Moving Average (OsMA) is a technical indicator that helps in determining a trend’s strength in the forex market.
-
What Are Bear and Bull Power Indicators?
Bear and bull power indicators in forex measure the power of bears (sellers) and bulls (buyers) to identify ideal entry points.
-
How to Trade With The On Balance Volume Indicator
The On Balance Volume (OBV) indicator analyses the forex price momentum to measure the market’s buying and selling pressure.
-
How to Use The Alligator Indicator in Forex Trading
The Alligator indicator can identify market trends and determine ideal entry and exit points based on the trend’s strength.
-
How to Use Inside Bar Trading Strategy
Inside bar trading offers ideal stop-loss positions and helps identify strong breakout levels.
-
What is the Martingale Trading Strategy in Forex?
The Martingale trading strategy increases the possibility of winning a trade in the forex market.
-
How to Use The Forex Arbitrage Trading Strategy
Forex arbitrage trading strategy allows you to profit from the difference in currency pair prices offered by different forex brokers.
-
The Beginner’s Guide to MQL5
MetaTrader, as a platform, has built-in functions that assist in technical analysis and trade management while also allowing traders to develop their own indicators and trading strategies.
-
How to Use DeMarker Indicator For Forex Trading
Every trader needs to know precisely when to enter or exit a forex market.
-
How to Use The Accelerator Oscillator For Forex Trading
The Accelerator Oscillator indicator helps detect different trading values that protect traders from entering bad trades.
-
A Forex Trader’s Guide to Awesome Oscillator
When you understand market momentum, you can better identify market reversals.
-
What is Money Flow Index?
The Money Flow Index can analyse the volume and price of currency pairs in the market.
-
What is The Ichimoku Kinko Hyo Indicator?
The Ichimoku Kinko Hyo indicator provides traders with the market’s current momentum, direction and trend strength.
-
Top Pullback Trading Strategies
Pullback trading strategies provide traders with ideal entry points to trade along with the existing trend.
-
What is High Wave Candlestick?
The High Wave Candlestick pattern occurs in a highly fluctuating market and provides traders with entry and exit levels in the current trend.
-
What is the Parabolic SAR indicator?
Identifying market trends becomes easier with the Parabolic SAR indicator as it provides the ideal entry and exit signals in strong trending markets.
-
What is Currency Correlation?
Currency correlations help trade multiple currencies in the forex market by identifying the market trends of each currency pair.
-
Price Action Trading Strategy
A Price Action Trading Strategy helps find ideal entry and exit points depending on expert opinions, news announcements, or technical indicators.
-
Average True Range
Average True Range (ATR) helps in identifying how much a currency pair price has fluctuated. This, in turn, helps traders confirm price levels at which they can enter or exit the market and place stop-loss orders according to the market volatility.
-
Moving Average Crossover
The Moving Average Crossover is a valuable tool to find the middle price-point of a trend in forex trading. When currency prices crossover their current moving averages, it helps traders identify the favorable buying or selling points for the currency.
-
What is the Bullish Engulfing Candlestick?
Bullish Engulfing Candlesticks helps in identifying an uptrend reversal in the market. This candlestick pattern stands out because a trader does not need to wait until the entire pattern is completed to enter a trade.
-
How To Trade The Gartley Pattern
The Gartley pattern helps identify price breakouts and signals where the currency pairs are headed. The pattern is also widely used in the forex market to determine strong support and resistance levels.
-
How to Trade Forex With NFP V-Shaped Reversal
A Non Farm Payroll (NFP) V-shaped reversal refers to a sudden increase or decrease in the currency pair prices right after an NFP report is released.
-
Candlestick Patterns: Top Candlestick Charts Every Trader Should Know
Candlestick patterns depict the price movement of assets in a graphical manner. Candlestick patterns also enable traders to predict market behaviour.
-
What is the Evening Star Candlestick Pattern?
Evening Star Candlestick Patterns help traders identify ideal exit levels in the forex market by signalling a slowed upward momentum and strengthened downward momentum.
-
How to Use Ichimoku Cloud in Forex?
The Ichimoku Cloud provides a clear market trend direction to the traders and helps them make market decisions accordingly.
-
Pennants Pattern: How to trade bearish and bullish pennants
Pennant Patterns work as a continuation signal in the forex market and help identify the ideal entry and exit price points
-
How to Trade Forex With Renko Charts
Renko Chart is a technical indicator that provides strong market trend directions by filtering out minor price movements
-
What are Ascending and Descending Triangle Patterns?
The Ascending and Descending Triangle Patterns confirm continued trends in the forex market.
-
How to Identify Cup and Handle Pattern in Forex Trading
The Cup and Handle Pattern is a technical price chart that forms the shape of a Cup and a Handle, which indicates a bullish reversal signal.
-
What is the Head and Shoulders pattern?
The Head and Shoulders pattern is a trend reversal indicator that predicts bullish to bearish and bearish to bullish reversals in the forex market.
-
What is the Hammer Candlestick Pattern?
Hammer Candlesticks enable traders to identify potential market reversal points, determine the ideal time to enter the market and place buy or sell orders accordingly.
-
What is The Opening Range Breakout Strategy
The Opening Range Breakout (ORB) Strategy involves taking forex positions when the currency pair prices break below or above the previous day's high or low
-
Morning Star Indicator
The Morning Star Indicator helps identify strong trend reversals in the forex market and enables you to take trade position entry decisions accordingly.
-
How Does Stochastic Indicator Work in Forex Trading?
Stochastic Indicator helps traders identify overbought and oversold market conditions that substantially lead to market reversals.
-
Favourite Fib Fibonacci Retracement
Fibonacci retracement strategies help traders identify the market's support and resistance levels, trend reversal points, and entry and exit decisions.
-
Heikin Ashi Candlestick Pattern
The Heikin Ashi Candlestick pattern is almost the same as the traditional candlesticks, with one big difference—the former is an averaged out version of the latter.
-
Multiple Time Frame Analysis in Forex
By monitoring different currency pairs in different time frames, you can make your Forex trades more successful and profitable.
-
What are Bollinger Bands?
The Bollinger bands can help identify overbought and oversold market conditions, protecting you against placing any orders that could lead to losses.
-
Andrew's Pitchfork Trading Strategy
Andrew's Pitchfork is a Forex trading strategy that can predict protracted market swings and help you in identifying potential market trends that can indicate potential exit and entry points.
-
Fibonacci Retracement
Fibonacci retracements are one of the most popular methods for predicting currency prices in the Forex market. Predicting upward or downward market movement can help traders with accurate price analysis for exiting or entering the market.
-
Trading in Volatile Markets
Forex volatility is the measure of how frequently a currency's value changes. A currency either has high volatility or low volatility depending on how much its value deviates from its average value.
-
The ABCD pattern
One of the most classic chart patterns, the Forex ABCD pattern represents the perfect harmony between price and time.
-
The Bearish Gartley Pattern
The Bearish Gartley pattern was introduced in 1935, by H.M. Gartley in his book, “Profits in the Stock Market”. The pattern helps Forex traders in identifying higher probabilities of selling opportunities.
-
What is the MACD Indicator?
The Moving Average Convergence Divergence (MACD) indicator helps traders quickly identify short-term trend directions and reversals in the forex markets. You can use the MACD indicator to determine a currency pair price trend's severity and measure its price's momentum and even identify the bearish and bullish movements in the currency pair prices.
Guide to Forex
Trading indicators.
Enter your details to get a copy of our
free eBook
Start a risk free
demo account
News & Analysis
Catch up on what you might
have missed in the market.