


A Price Action Trading Strategy is a popular approach used by traders to analyze and make trading decisions based on a financial asset's price movement. It entails analyzing market price movements, identifying patterns, and applying this knowledge to determine the best entry and exit points. In this guide, we will go over the steps involved in putting a price action trading strategy into action.
What is Price Action Trading?
Price Action Trading is a strategy based on a currency pair’s price movement instead of indicators or technical analysis.
- When the currency pair prices start increasing, it indicates that more and more traders are buying the pair. Price Action traders assess how aggressive the buying is and enter or long the market accordingly.
- When the currency pair prices start decreasing, it indicates that more and more traders are selling the pair. Price Action traders assess how aggressive the selling is and exit or short the market accordingly.
Benefits of Price Action Trading
Here are the top benefits of price action trading strategies:
- Price action trading is a simple strategy that does not rely on complicated technical indicators or other sophisticated analysis tools. Instead, it focuses on analyzing an asset's price movements, which is something that any trader can learn.
- Price action signals are more reliable and consistent than other types of signals because they are based on real-time price movements rather than lagging indicators. Because of this consistency, traders can make more informed decisions about when to enter and exit a trade.
- Price action trading is versatile because it can be used on any financial instrument, including stocks, forex, commodities, and cryptocurrencies. Because of its versatility, it is appropriate for traders with a variety of preferences and trading styles.
- To effectively manage their risk, price action traders frequently employ techniques such as stop-loss orders and position sizing. These actions can assist traders in minimizing losses.
While price action trading strategy is simple, versatile, reliable and can be learned and used by multiple types of traders, it involves margin trading non the less, which is high risk.
How to read price action in forex?
Reading a price action in forex involves analysing the two significant waves in any currency pair’s forex chart.
- Trending waves that follow a strong trend or momentum in either an upward or downward direction. They signal traders to go long during an uptrend wave or short during a downtrend wave.
- Pullback waves refer to the temporary change in the prices against the current direction. During an uptrend, the currency pair prices pull back in the downward direction after recent highs, and during a downtrend, pullbacks occur with a temporary increase in the prices after recent lows.
By monitoring these waves along with the swing highs and lows of a currency pair, you can identify the market's direction. When the market is trending upward, the currency pair prices make higher highs and higher lows. But, when the market is trending downwards, the currency pair price makes lower highs and lower lows.
- A continuous uptrend signals traders to enter long positions.
- A continuous downtrend signals traders to enter short positions.
*This is an example only to enhance a consumer's understanding of the strategy being described above and is not to be taken as Blueberry providing personal advice.
Top price action trading patterns
Continuation patterns
Price action continuation patterns like triangles, pennants and flags occur during a strong trend and continue in the same direction thereafter.
- If the currency pair is trending upwards, the price action patterns signal that currency pair prices can break higher due to the continued uptrend.
- If the currency pair is trending downwards, it signals that currency pair prices can break out lower due to the continued downtrend.
Reversal patterns
Price action reversal patterns like wedges, double top and bottom, and head and shoulders patterns occur when an opposite trend follows an uptrend or downtrend. When the currency pair is in an uptrend making higher highs and higher lows, then the recent low supported by a low swing high signals a trend reversal. When the currency pair is in a downtrend, making lower lows and lower highs, then the recent swing high supported by a high swing low signals an uptrend reversal.
The top price action trading strategies
Pin bar pattern
The pin bar pattern is a candlestick pattern with a long lower or upper wick. which indicates either the low price or the high price being rejected. The pattern suggests that the currency pair price moves in the opposite direction in the presence of the wick.
- If there is a long lower wick, the low price is rejected and there is a bullish reversal.
- If there is a long upper wick, the high price is rejected, and a bearish reversal is expected.
Inside bar pattern
The inside bar pattern is also a reversal pattern which consists of two candlesticks, where the inner bar is smaller in size than the outer bar. The inner bar always falls between the currency pair's high price and low price range. It gives traders ideal entry and exit points before a market reversal.
- If the first candlestick is bullish, it indicates a bearish reversal.
- If the first candlestick is bearish, it indicates a bullish reversal.
Breakout entry pattern
The breakout entry pattern refers to the price action that occurs right after a price hike or sudden price dip in the currency pair. It suggests that as a currency pair price spikes high, a retracement will occur, and the currency pair will either move below its support or above its resistance line. This allows traders to long the trade during an uptrend or short it during a downtrend.
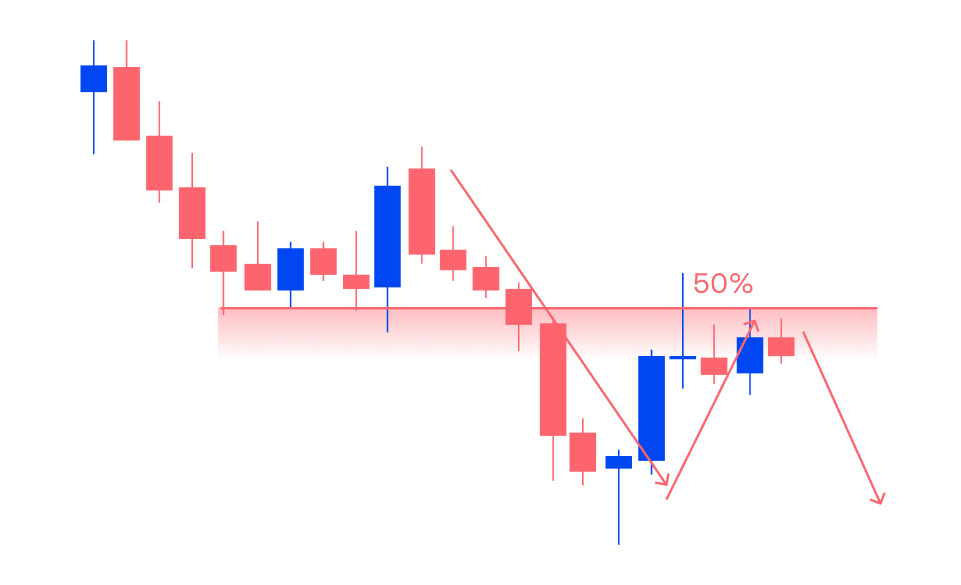
Trend following retracement entry
The trend-following retracement entry is an existing trend-following approach that provides you with ideal entry price levels. It identifies the overall market trend, waits for the prices to retrace in the current trend's direction, and enables you to place an order once the trend is confirmed. Price retracement is a temporary reversal in the current market trend. If there is a current downtrend, you place a short order at the low of the retracement price level. On the other hand, during a current uptrend, you place a long order at the high of the retracement price level with an expectation of market continuation. The stop loss order can be placed below the low of the retracement level when entering a trader, and take profits can be placed at recent swing highs or near the resistance line.
This graph has been recreated from the original source. Please note this image is a representation only and is not provided as general or personal advice.
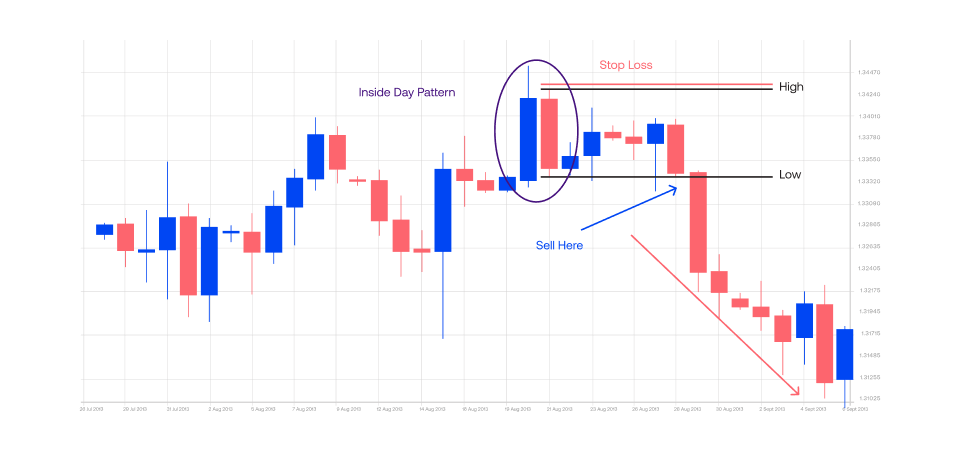
Inside bar
The inside bar strategy consists of two bars, where the second bar (inside bar) is always smaller than the first bar (mother bar). This strategy helps traders trade a breakout price level in trending markets and acts as a reversal signal. When a series of higher highs and higher lows are formed on the chart with an inside bar formation, it indicates a downtrend reversal. At this point, you can enter a short position right when the currency pair price breaks below the low of the inside bar. On the other hand, when a series of lower lows and lower highs are formed on the price chart, followed by an inside bar pattern, it indicates a bullish/uptrend reversal. At this point, you can enter a long position right when the currency pair price breaks above the high of the inside bar.
This graph has been recreated from the original source. Please note this image is a representation only and is not provided as general or personal advice.
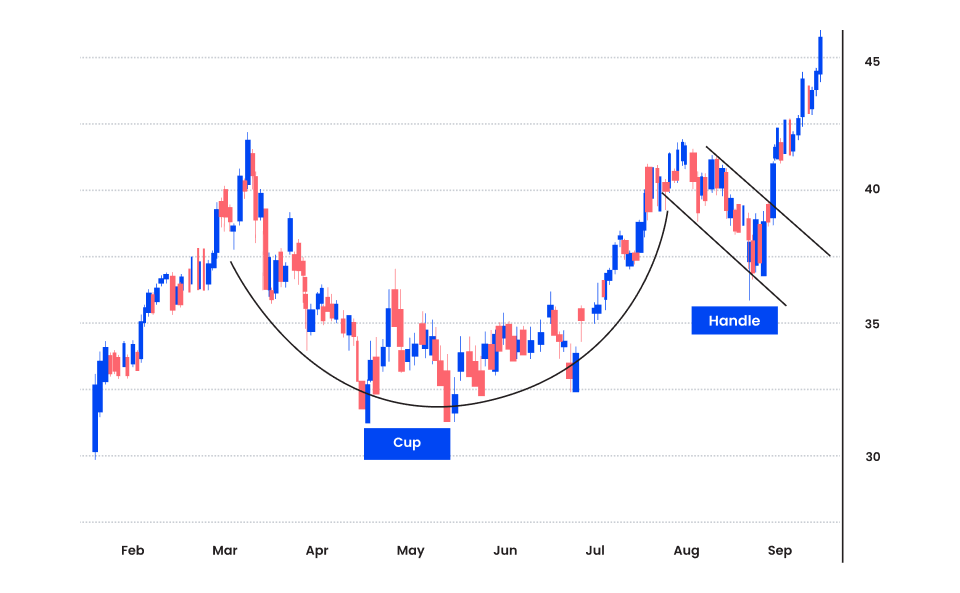
Cup and handle
The cup and handle strategy helps traders identify a market reversal and trade against the current trend. During a bullish reversal, it is formed by a steep rise in currency pair prices that is followed by a continuous drop in the prices, finally retracing back to the uptrend with rising prices. At this point, you can place a long order at the low of the handle or when the price breaks out from the resistance level. The stop loss order can be placed just below the low of the handle. On the other hand, during a bearish reversal, the pattern is formed by a steep fall in currency pair prices that is followed by a continuous rise in prices, finally retracing back to the downtrend with falling prices. At this point, you can place a short order at the high of the handle or when the price breaks below the support level. The stop loss order can be placed just above the high of the handle.
This graph has been recreated from the original source. Please note this image is a representation only and is not provided as general or personal advice.
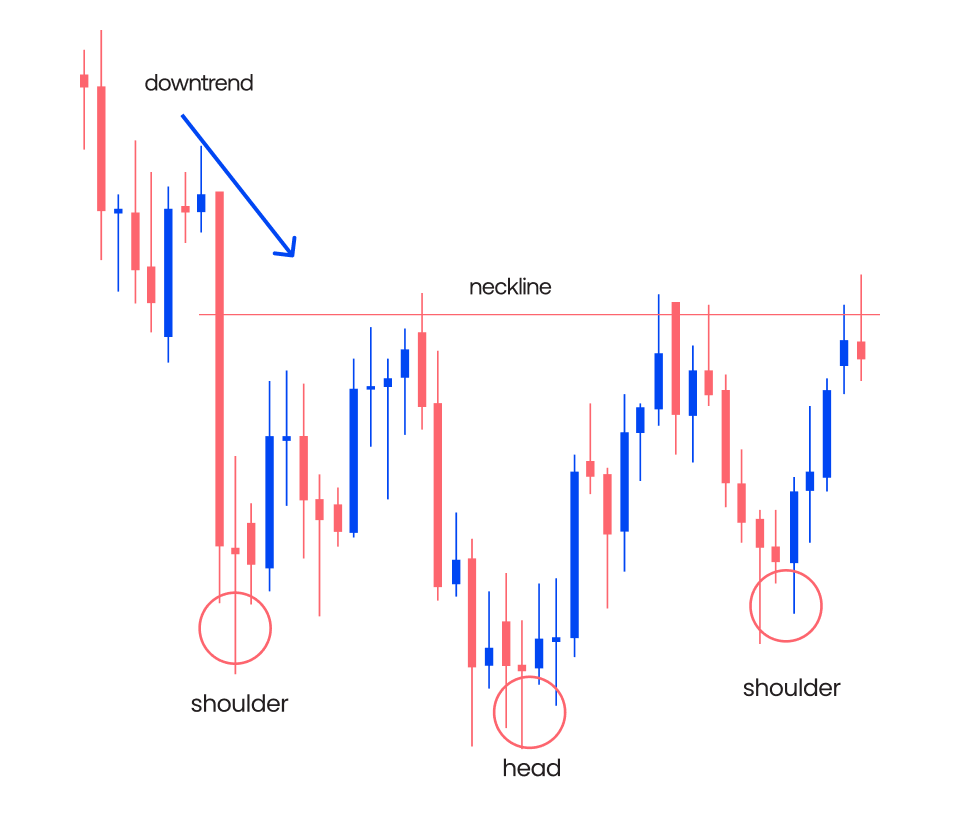
Inverse head and shoulders
An inverse head and shoulders strategy is used to indicate a bullish reversal, signalling that the downtrend is going to end and the uptrend will begin. The pattern consists of three elements:
- Left shoulder: This is the first part of the pattern, and it's characterized by a price high followed by a pullback.
- Head: This is the second part of the pattern, and it's characterized by a higher price high followed by a larger pullback.
- Right shoulder: This is the third and final part of the pattern, and it's characterized by a lower price high followed by a pullback that is similar in size to the left shoulder.
When the currency pair price breaks below the head and shoulder's neckline, also known as the support level connecting the price lows of the left and right shoulders, it signals a short entry order. You can set the stop loss above the right shoulder to minimise trade risk.
This graph has been recreated from the original source. Please note this image is a representation only and is not provided as general or personal advice.
Island Reversal
The island reversal price action trading strategy is used to signal potential trend reversals. It occurs when the currency pair prices gap up or down, leaving a gap in the price chart followed by another gap in the opposite direction. A price gap up or down is a situation when the currency pair's opening price is significantly higher or lower than the previous day's closing price – creating a gap between the candlesticks. When the currency pair price breaks out of the current market price range in the direction of the first gap, enter a long position as it indicates an uptrend reversal. On the other hand, if the price breaks out to the downside of the current market range, it indicates a downtrend reversal, signalling you to enter a short trade. A stop-loss order can be placed right below the current market range when entering a long position and above this range when entering a short position.
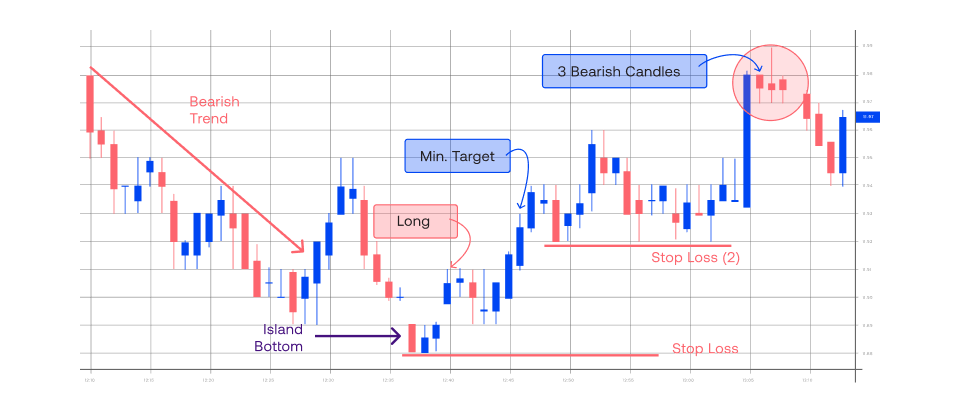
This graph has been recreated from the original source. Please note this image is a representation only and is not provided as general or personal advice.
False breakout
In a false breakout, a currency pair appears to break through a key level of support or resistance but then reverses and moves in the opposite direction. To trade with this strategy, identify either a support or resistance level and wait for the current market prices to break below or above these levels. When the price breaks through and quickly reverses in the opposite direction (which means it breaks below the support level but starts increasing thereafter or breaks above the resistance level and starts falling thereafter), it indicates a false breakout. You can enter a long trade when the price breaks below the support level but quickly retraces, indicating a bullish reversal. You can enter a short trade when the price breaks above the resistance level but quickly retraces, indicating a bearish reversal. The stop-loss orders can be placed below the false breakout level when entering a long trade and above the false breakout level when entering a short trade.
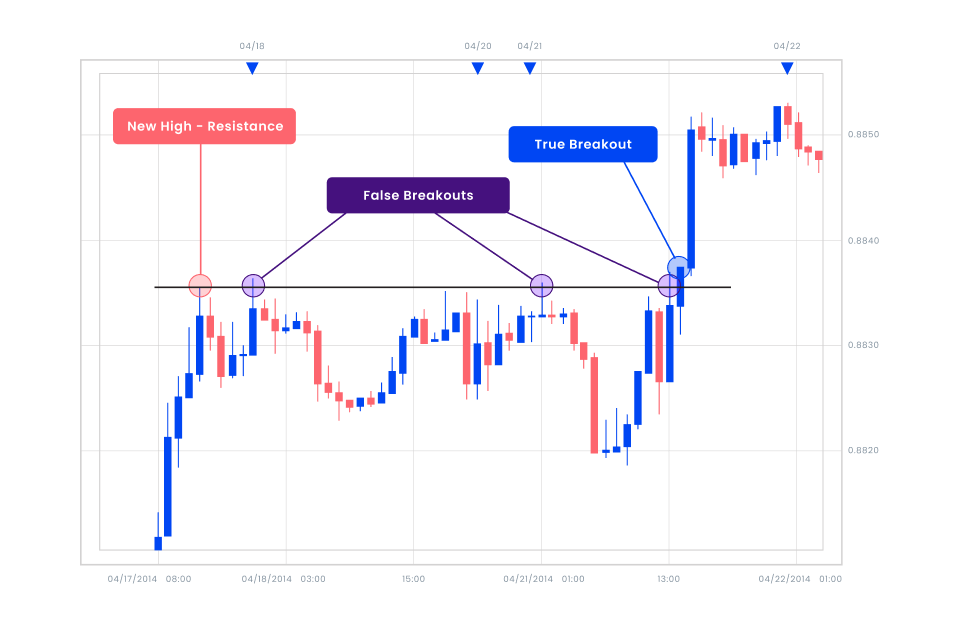
This graph has been recreated from the original source. Please note this image is a representation only and is not provided as general or personal advice.
How to trade with price action trading strategy
Choose a forex pair
In the price action trading strategy, select a major currency pair (such as EUR/USD, GBP/USD, USD/JPY) for better liquidity and tighter spreads. Traders must also consider their risk tolerance. More volatile pairs offer greater gain potential but also carry higher risk.
Select a timeframe
Based on one’s trading style, a timeframe can be chosen from daily, 4-hour, or 1-hour charts. Choose a timeframe that aligns with one’s risk tolerance as well.
Identify key levels
Look for horizontal price levels where the price has previously turned around. These levels often act as barriers to price movement. Draw trendlines connecting a series of higher highs and higher lows (uptrend) or lower highs and lower lows (downtrend).
Learn candlestick patterns
Consider candlestick patterns such as doji, hammer, shooting star, and engulfing patterns that signal potential reversals. Pin bars, inside bars, and three white soldiers can also be used in this strategy to indicate a continuation of the existing trend.
Develop a trading plan
Define specific criteria for entering a trade, such as a breakout from a range, a reversal pattern, or a price reaching a support or resistance level. Also determine when to take gains or exit a losing trade, using stop-loss orders and gain targets.
Develop a risk management plan
Implement a risk management strategy, including position sizing and stop-loss orders to limit potential losses.
Practice backtesting
Use historical data to test your trading strategy and identify its accuracy. Make necessary adjustments to the strategy based on backtesting results.
Start trading
Apply the strategy knowledge to real-time price action, looking for trading opportunities that align with your strategy. Ensure to practice discipline and avoid impulsive trading decisions.
- When a price reaches a strong support or resistance level, it may be a good time to enter a trade in the opposite direction of the trend.
- Place stop-loss orders below (for long positions) or above (for short positions) the recent low or high to limit potential losses.
- If the price starts to show signs of a reversal, such as a change in candlestick patterns or a break of a key support or resistance level, consider exiting the trade.
- If a price breaks above a long-term resistance level, it could signal a bullish trend. Enter a long position.
- If a price breaks below a long-term support level, it could signal a bearish trend. Enter a short position.
- After a strong uptrend, the price might pull back. If it retraces to a previous support level, consider entering a long position.
- After a strong downtrend, the price might pull back. If it retraces to a previous resistance level, consider entering a short position.
*This is an example only to enhance a consumer's understanding of the strategy being described above and is not to be taken as Blueberry providing personal advice.
Indicators for price action trading
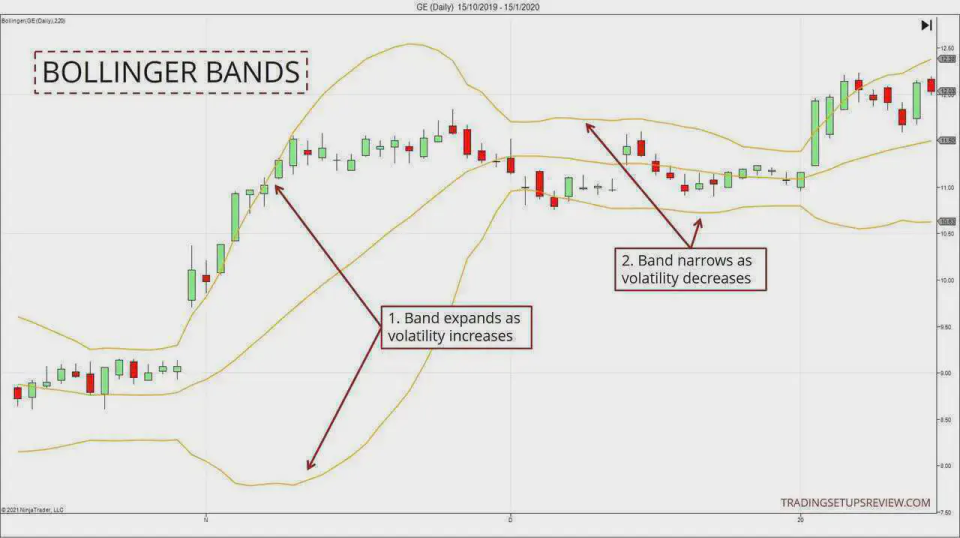
Bollinger bands
Bollinger Bands consist of three lines: a middle band (usually a simple moving average) and two outer bands (set at a standard deviation above and below the middle band). When price breaks above the upper band, it signals a strong bullish trend. Conversely, breaking below the lower band suggests a strong bearish trend. When the price bounces off the upper or lower band, it may indicate a potential reversal.
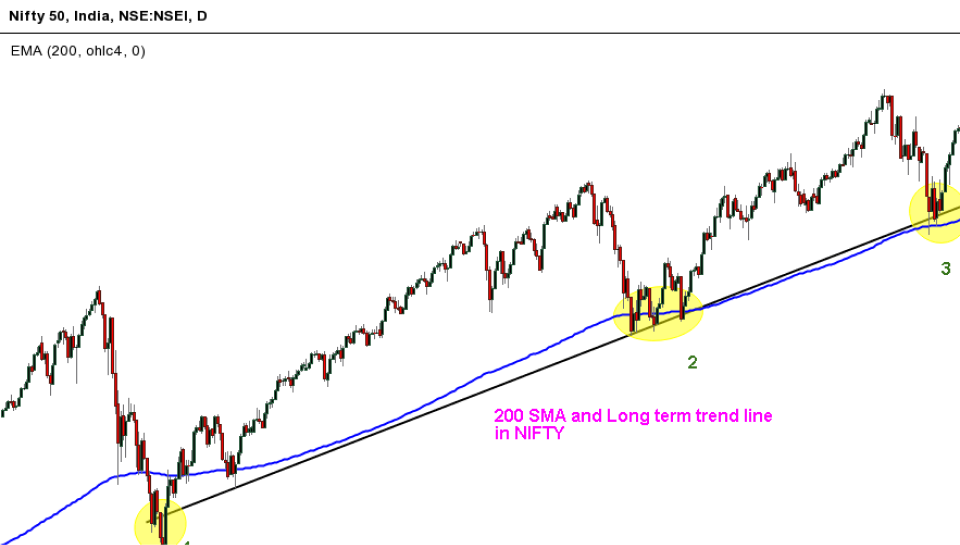
Moving averages
Moving averages smooth out price fluctuations, creating a trend line. When a shorter-term moving average crosses a longer-term moving average, it can signal a trend change. Moving averages can also act as support or resistance levels. When the price tests a moving average and bounces off, it may indicate a potential reversal.
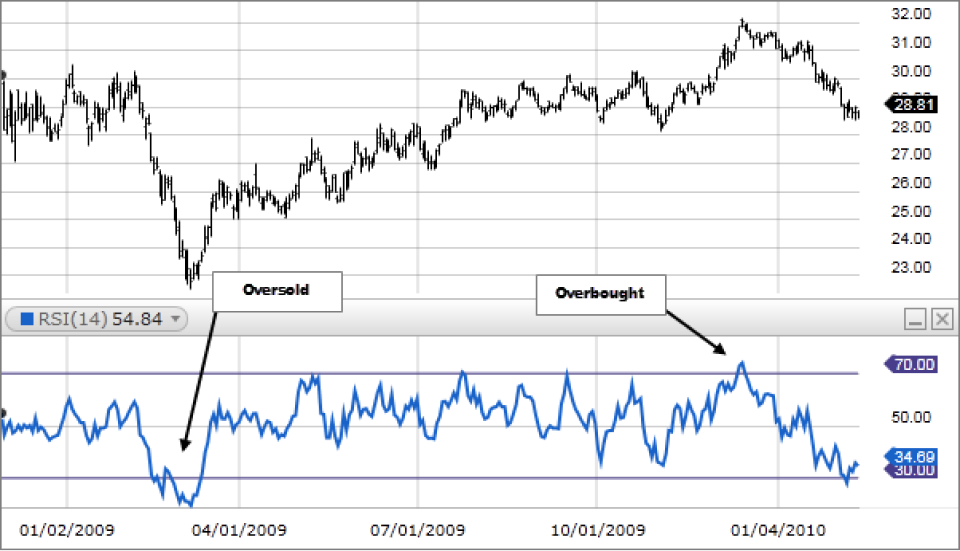
Relative strength index
RSI measures the speed and change of price movements. It ranges from 0 to 100, with readings above 70 often indicating overbought conditions and below 30 indicating oversold conditions. When the price and RSI move in opposite directions, it can signal a potential reversal.
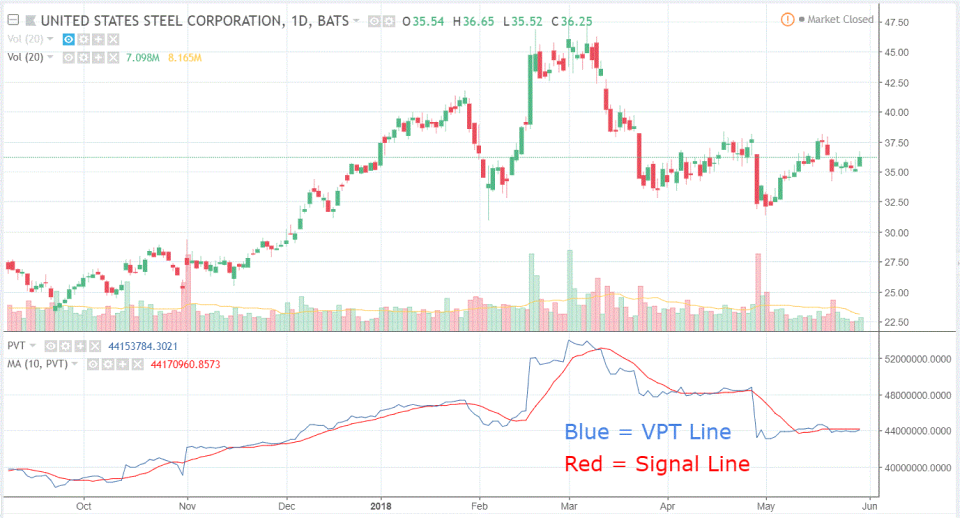
Volume indicators
Volume indicators measure the amount of trading activity. Examples include On-Balance Volume (OBV) and Accumulation/Distribution Index (ADI). Increasing volume during a price move can confirm the strength of the trend. However, if price is making new highs or lows, but volume is not, it may indicate a weakening trend.
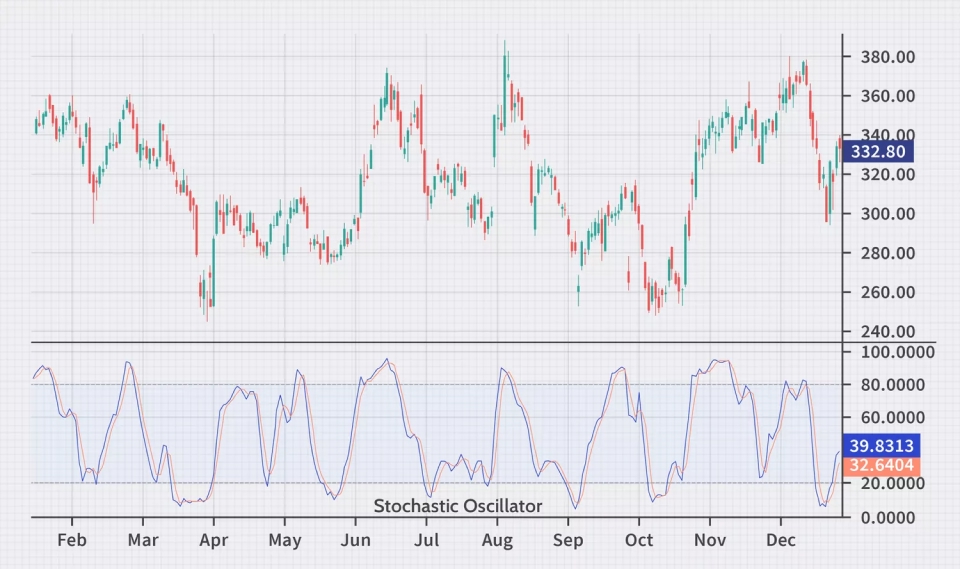
Stochastic oscillator
The Stochastic Oscillator measures the position of a closing price relative to its high-low range over a specific period. Readings above 80 or below 20 suggest overbought or oversold conditions, respectively. If the price and Stochastic Oscillator move in opposite directions, it may indicate a divergence.
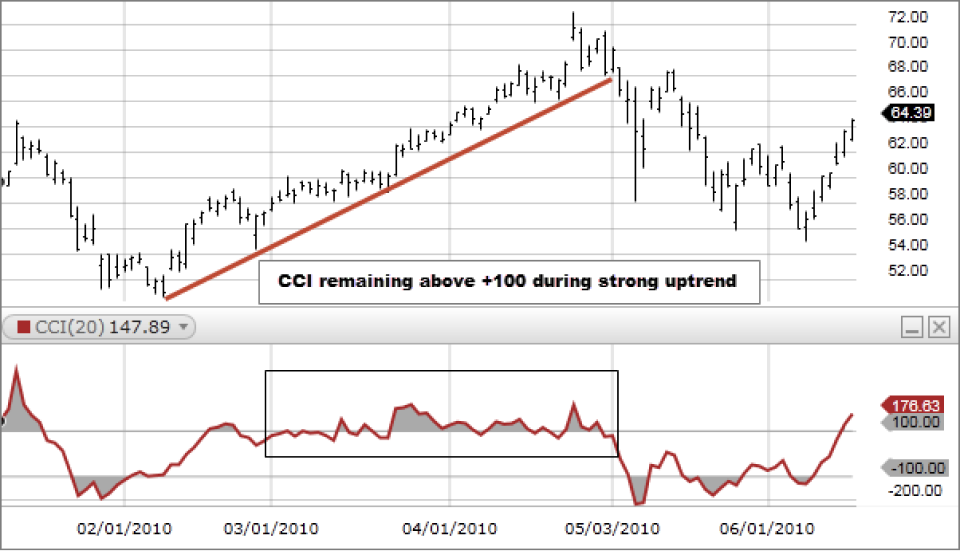
Commodity Channel Index (CCI)
CCI measures the distance of a price from its average price over a specific period. Readings above 100 or below -100 suggest extreme overbought or oversold conditions. A rising CCI can confirm an uptrend, while a falling CCI can confirm a downtrend.
Limitations of Price Action
- Subjectivity: Interpretation of price action patterns can be subjective, and different traders may have varying opinions on the significance of certain formations. Traders should price action with technical indicators for additional confirmation.
- Delayed signals: Price action signals can sometimes be delayed, leading to missed trading opportunities or less optimal entries and exits. Traders should use multiple timeframes to identify early signals.
- Difficulty in identifying false breakouts: In price action analysis, it can be challenging to differentiate between genuine breakouts and false breakouts, which can lead to unnecessary losses. traders should backtest strategies to identify patterns that consistently lead to gaining trades.
- Lack of quantitative analysis: Price action trading primarily relies on visual analysis, which can be limited compared to quantitative methods. Traders should supplement with quantitative analysis, like volume indicators.
- Emotional bias: Traders may be influenced by emotions like fear and greed, leading to impulsive decisions and suboptimal trades. To mitigate this challenge, traders should develop a trading plan and stick to it, using risk management techniques.
- Market noise: Random price fluctuations and market noise can make it difficult to identify meaningful patterns and signals. Traders should focus on larger trends and ignore short-term fluctuations.
Devise a Price Action Trading Strategy to analyse forex price movements today
Most traders prefer combining the price-based information about the currency pairs with technical indicators to confirm the market’s trend direction. Start trading with Blueberry Markets, a global trading platform. Sign up for a live trading account or try a demo account.