


Average True Range (ATR) helps identify how much a currency pair price has fluctuated. This, in turn, helps traders confirm price levels at which they can enter or exit the market and place stop-loss orders according to the market volatility.
In our article, we will learn about the Average True Range indicator in-depth and how to trade with it.
*This is an example only to enhance a consumer's understanding of the strategy being described above and is not to be taken as Blueberry providing personal advice.
What Is the Average True Range (ATR)?
Average True Range (ATR) is a volatility indicator that measures how much a currency pair’s prices have fluctuated on an average in a given time period. It is the average of the price ranges over a specific time period derived from the simple moving average of 14 trading periods. Since the Average True Range is only a measure of volatility, it does not provide the direction of the market or any specific trading signals. It can, however, indicate whether traders should go long or short with different volatilities.
Calculating Average True Range
The Average True Range calculation can be done on the basis of 14 trading periods, which can be either intraday, daily, weekly or monthly. This means that if you are an intraday trader, you can calculate the Average True Range at 14 different trading times in a single day. When all the ranges are joined together, they form a line on the chart that indicates the volatility change in the currency pair prices. The first step in calculating the Average True Range is to derive a series of true ranges. The true range is the maximum of the absolute values of the following three –
- Current high price minus the current low price
- Current low price minus the previous close price
- Current high price minus the previous close price
Once the values are calculated, an average of the same is taken by dividing the total number of periods, which is 14. The other Average True Range values are calculated based on the following formula – Current Average True Range = (Previous Average True Range*13 + Current True Range)/14
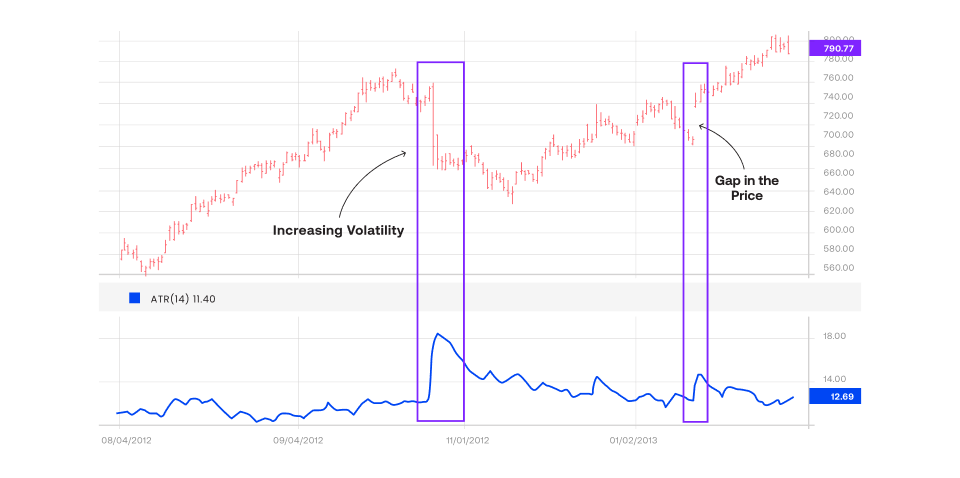
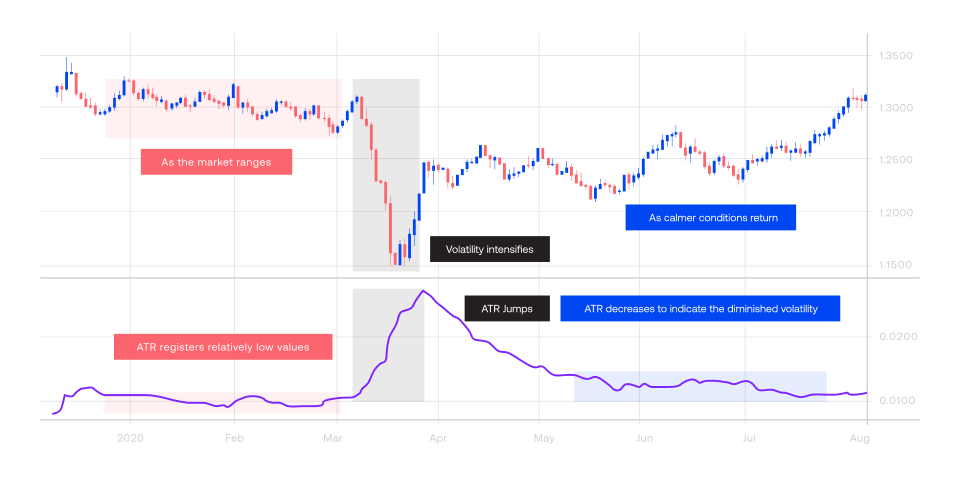
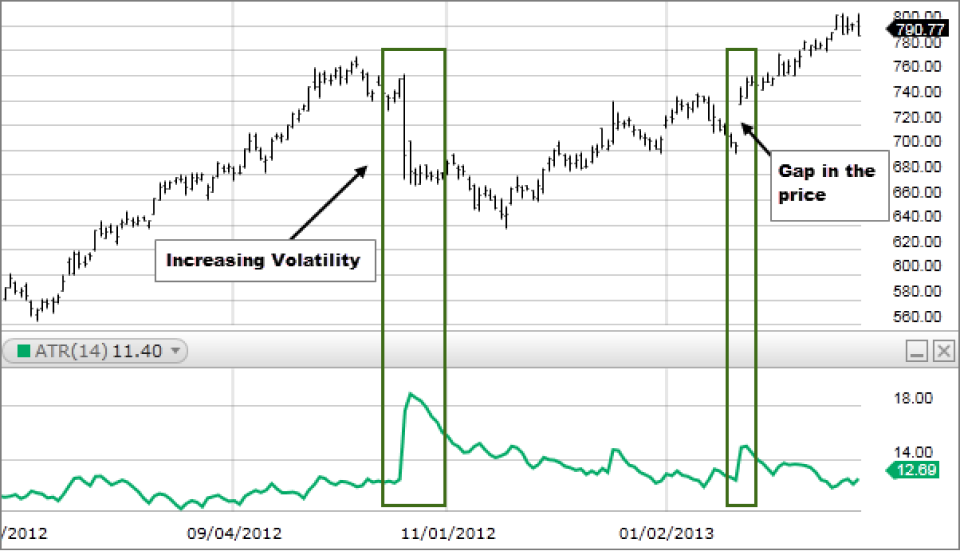
- When the ATR is increasing, it indicates that the volatility in currency pair prices is also increasing.
- When the ATR is decreasing, it indicates that the volatility in the currency pair prices is also decreasing.
Average True Range example
Let us assume that you are a daily trader who wants to analyse the volatility of USD/EUR over 14 trading days. You can calculate the seven-day ATR of USD/EUR by first calculating the difference between the current high, current low and previous low prices.
Assuming the current high price of USD/EUR is 5, the current low price is 3, and the previous close price is 4, the maximum absolute value obtained for the three values will be -
Current high price - current low price = 5 - 3 = 2
Current low price - previous close price = 3 – 4 -1 = absolute value = 1
Current high price - previous close price = 5 - 4 = 1
Hence, the maximum absolute value obtained for USD/EUR is 2. Further, you repeat the same step for 14 days to find the price range over the specified 14-day period.
Assuming the maximum absolute value for the next 13 days according to the formula mentioned above are = 1,2,1,1,3,1,2,1,3,2,2,2,1.
The calculation of the true range is then averaged to calculate the 14-day ATR’s first value. By averaging, we get the first value as = (2+1+2+1+1+3+1+2+1+3+2+2+2+1)/14 = 24/14 = 1.71 is the first value of the ATR volatility indicator.
The succeeding values can be found by the current Average True Range formula mentioned in the previous section.
Since the value(s) of ATR is significantly below the current low price, it indicates contracting volatility in the USD/EUR market, signalling that the currency pair prices are fluctuating very less.
What does the Average True Range indicate?
The Average True Range indicates daily volatility in currency pair prices. It is used to measure price volatility mainly formed due to the price gaps, which is the area on the trading chart where no trading takes place due to a major news announcement or the market closing on weekends.
How to read the ATR indicator forex?
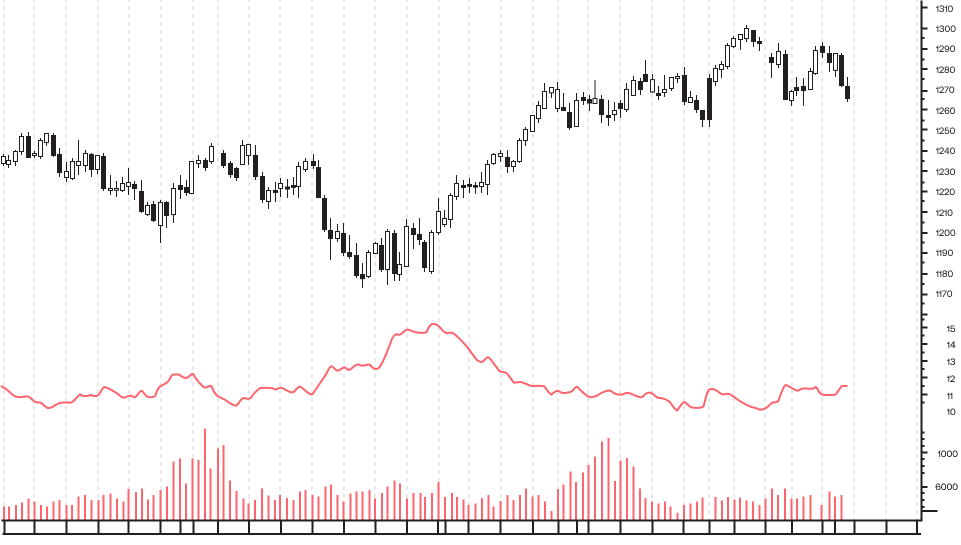
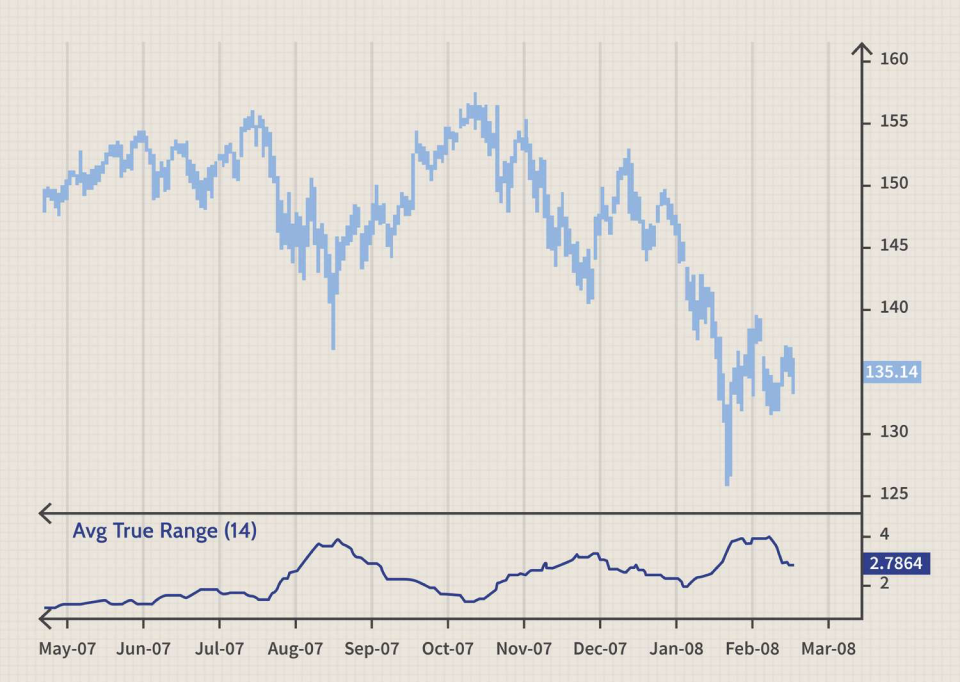
The Average True Range is a single line formed by joining the true range values over a specific time period. The line moves up or down, and how much the line is spread across the timeline indicates high and low volatility.
- Wherever the ATR line is spread widely across the timeline, signalling weaker upward and downward movement of the currency pair price, it indicates a decreased price volatility.
- Whenever the ATR line is contracted, with frequent price changes, signalling stronger upward and downward movement of the currency pair prices, it indicates increased price volatility.
How to use the ATR indicator
Since the ATR indicator only indicates the volatility in the currency pair prices, it should be combined with other price action tools to identify a currency pair’s market direction. You can use the ATR indicator to set stop-loss orders, trade significant market trends and set profit targets.
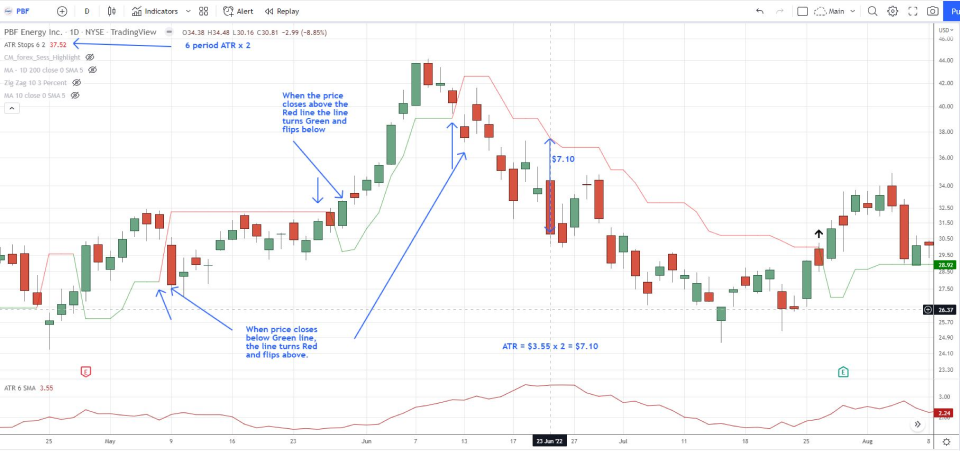
ATR and stop-loss order
- Find the current ATR value for the currency pair you want to trade.
- After calculating the current ATR select its multiple and add it to the closest resistance and support level of the currency pair.
- If the amount calculated is added to the support level and is a multiple of 1, you can set your stop-loss level at 1ATR right below the low price point of the support level.
- If the amount calculated is added to the resistance level and is a multiple of 2, you can set your stop loss level at 2ATR above the high price point of the resistance level.
ATR and large market trends
- Calculate the current ATR value.
- Decide the ATR multiple that you wish to use (1,2,3,4,5…etc.) after the ATR indicator calculation.
- After deciding on the multiple you want to use, subtract that value from the high price points of the currency pair to set a trailing stop-loss order (an order that allows you to set the maximum loss you are ready to incur) to long a trade.
- Add the multiple values to the low price points of the currency pair to set a trailing stop-loss order to short a trade.
The larger ATR multiple you use, the larger market trends you will be able to trade.
ATR and profit target levels
The ATR indicator can be used to set profit targets that enable traders to fix a predetermined exit point at which they reap a gain.
- Calculate the daily Average True Range through the ATR calculation formula.
- Compare ATR with the market’s high price, low price and support and resistance levels.
- Choose the price target that is most likely to be achieved on that day and is closest to the daily ATR.
- Set your profit target near the daily ATR.
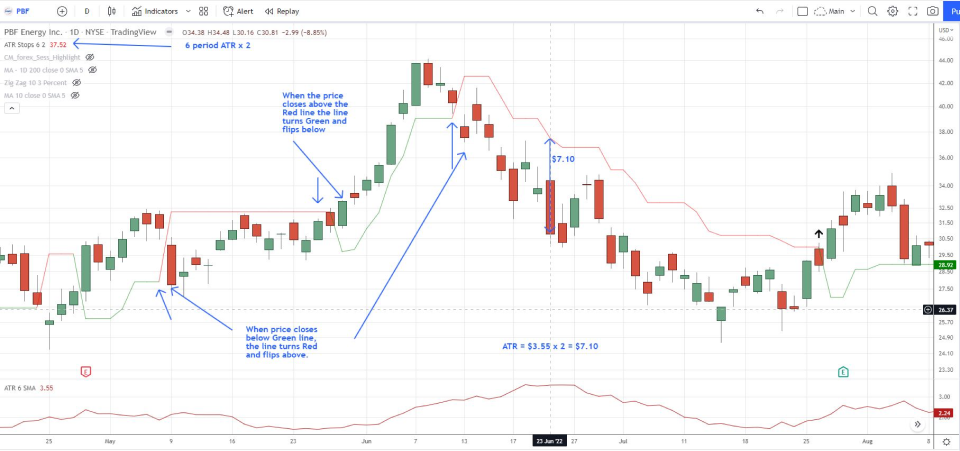
ATR and exit and entry signals
ATR provides you with exit signals on the basis of the value you ascertain by subtracting ATR’s value from the closing price. If the currency pair closes at a price that is more than one (or more) ATR below the previous close, it indicates a significant change in the market that can lead to a market reversal. This signals you to close long positions and enter short positions in an uptrend. On the other hand, when the currency pair closes at a price that is more than one (or more) ATR below the previous close, it also indicates a market reversal. This signals you to close short positions in a downtrend and enter long positions in an uptrend to make profitable trades.
Limitations of the Average True Range
ATR is subjective
The Average True Range is a subjective measure which means that it does not provide any single value that confirms any certainty about the market trend. Since the ATR is only a volatility measure, it does not provide you with market continuation or reversal signals unless combined with other indicators. All ATR values are open to interpretation and can mean different things to different traders.
Does not provide market direction
The ATR indicator is a non-directional indicator, which means that it does not provide any insight into the currency pair’s market movement or potential price movement. This results in mixed signals, especially when the markets are highly volatile and when trends are about to end. The non-directional movement of the ATR only helps you understand how volatile a currency pair is and combine it with other indicators to take further trading decisions. Hence, ATR cannot be used alone or by itself to take a trading decision.
Best indicators to use with ATR
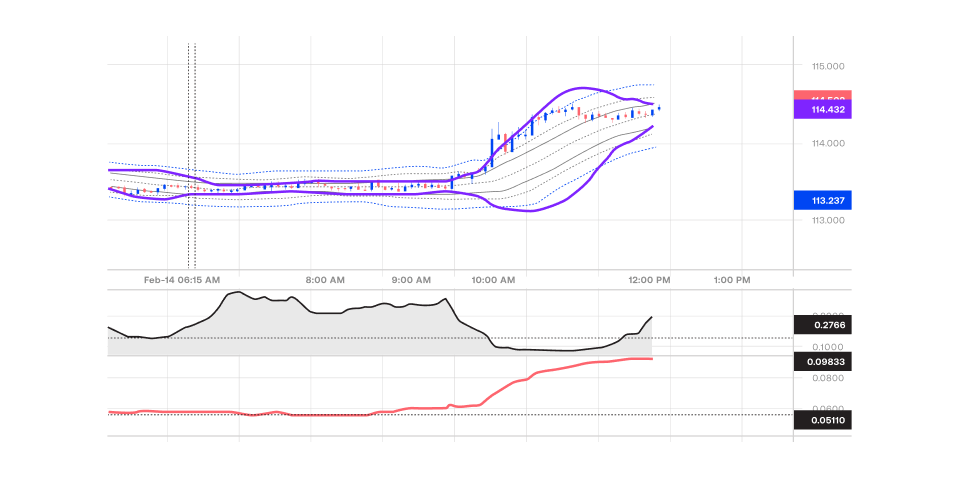
ATR and Bollinger Bands
Similar to ATR, Bollinger Bands are also volatility indicators that help identify overbought and oversold market conditions. Using Bollinger Bands with ATR helps traders understand the currency pair’s volatility and in which direction the market is headed. Once the ATR signals, the volatility in the market can be confirmed by identifying the overbought or oversold market conditions through the Bollinger Bands.
- Whenever the currency pair prices move above the upper band, it indicates an overbought market condition that signals a downtrend reversal.
- Whenever the currency pair prices move below the lower band, it indicates an oversold market condition that signals an uptrend reversal.
When the ATR provides high volatility signals in the market and Bollinger Bands indicate an overbought market condition, the high volatility is confirmed that signals traders to place short orders. On the other hand, when ATR’s high volatility signal is combined with an oversold market condition indicated by the Bollinger Bands, it signals traders to place long orders.
ATR and Parabolic SAR
Parabolic SAR is the technical indicator that helps identify the currency pair price’s market direction and potential reversal signals. The Parabolic SAR is represented in the price chart through a series of dots that move above and below the currency pair’s price.
- When the currency pair is trending upwards, the dot is placed below the price.
- When the currency pair is trending downwards, the dot is placed above the price.
When combined with the Average True Range strategy, traders can confirm the Average True Range's stop-loss levels and set orders that ensure successful ATR trading. The ideal stop-loss level is identified at the SAR’s value, and this can be compared with the stop-loss determined through ATR to confirm the price level. If both stop-loss levels are close to each other, traders can move forward with placing the stop-loss at that price level and continue trading the currency pair.
When ATR is expanding, it signifies an increase in price volatility. It's important to note that ATR is non-directional; therefore, an expanding range can indicate either a potential for a short order or a long order.
High values of ATR depict –
- Sharp price movements: Rapid increases or decreases in prices often lead to higher ATR values.
- Temporary nature: High ATR values are generally not sustained for extended periods.
Low values of ATR depict –
- Small price ranges: Low average true range values suggest that prices are moving within a narrow average range over consecutive periods.
- Potential reversals or continuations: If average true range remains low for an extended time, it might indicate a possible reversal or continuation of the existing trend.
- Consolidation areas: A low average true range can also signal a period of consolidation, where prices are relatively less volatile.
Applying the ATR in trading
Day trading
Traders can use the average true range to identify periods of high price volatility and enter trades when the ATR value is significantly above its historical average. This suggests that the market is experiencing increased price fluctuations, which can present opportunities for short-term gains.
Swing trading
A rising ATR can indicate a strengthening trend, suggesting that the price is moving with greater conviction. Conversely, a declining average true range may signal a weakening trend or a period of consolidation. Swing traders can use ATR to identify and capitalize on strong trends.
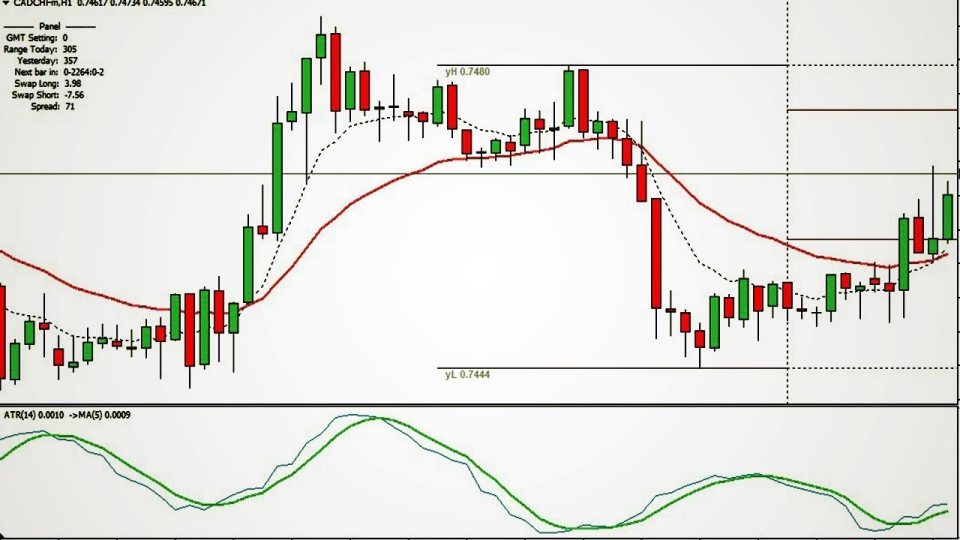
Combination trading
ATR can be combined with moving averages to identify trend direction and potential reversals. For example, a trader might use a 50-day moving average to identify the overall trend and then use ATR to determine when the price is significantly above or below the moving average, suggesting a potential reversal.
Similarly, average true range can be used to determine whether a market is overbought or oversold, and then RSI can be used to confirm the signal. For example, a high RSI value might suggest that a market is overbought, but if the average true range indicator is also high, it could indicate that the market is still in a strong uptrend.
Position sizing
In this risk management strategy, a market regime technical analysis via ATR indicator is conducted, which helps determine whether the market is in an increased volatility or low volatility regime. For example, a high ATR value might indicate a period of heightened market uncertainty, while a low average true range indicator value could suggest a more stable market environment. Position traders can use this information to adjust their risk exposure and trading strategies accordingly.
ATR can be used to set appropriate stop-loss levels in the position sizing strategy. By understanding the market volatility, traders can set stop-loss levels that are consistent with their risk tolerance and the current market conditions.
Cross-market analysis
ATR can be used to compare price volatility across different markets and identify potential trading opportunities. For example, suppose the ATR indicator for the S&P 500 is significantly higher than the ATR for the Nasdaq. In that case, it might suggest that the S&P 500 is experiencing more volatile conditions and could present potential trading opportunities for diversification.
Top ATR trading strategies
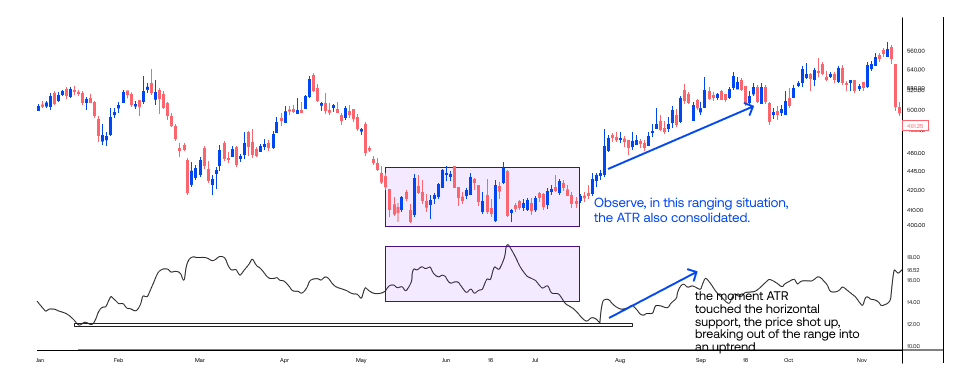
Trading range strategy
This strategy involves trading an asset within a specified price range, determined by the Average True Range (ATR). The idea is to capitalize on the asset's tendency to fluctuate within a certain price band. Follow the steps to execute the strategy -
- Identify the typical price range of the asset using ATR.
- Long the asset when it falls to the lower boundary of the range and short when it rises to the upper boundary.
- Continuously monitor the ATR indicator to adjust the range as market conditions change.
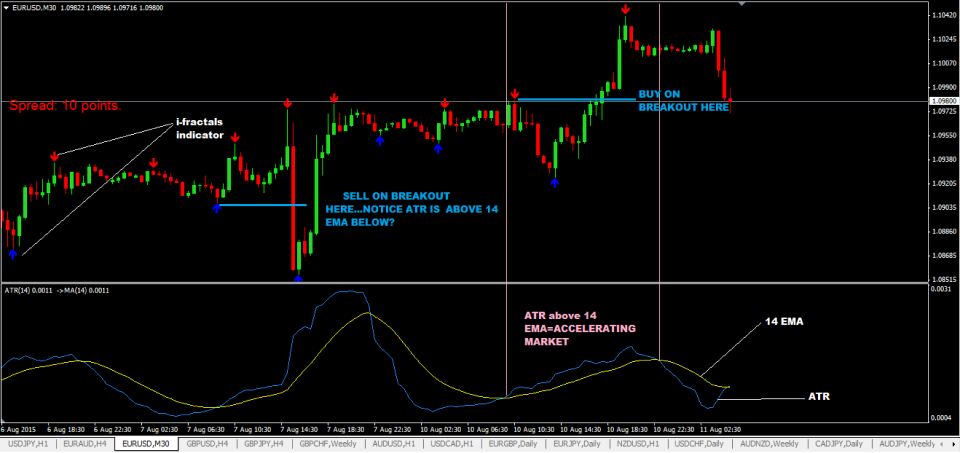
Breakout strategy
This strategy aims to gain from significant price movements that break out of established trading ranges or resistance levels. Follow the steps to execute the strategy –
- Use ATR to determine a significant price movement that exceeds the average range.
- When the asset breaks above a resistance level or below a support level, enter a trade in the direction of the breakout.
- Set a stop-loss below the breakout level to manage risk.
Momentum trading strategy
This strategy focuses on trading assets that are experiencing strong price trends. Traders can combine momentum trading with other technical indicators, such as the Relative Strength Index (RSI), to confirm the trend's strength and identify potential overbought or oversold conditions. Follow the steps to execute the strategy –
- Use ATR to confirm a strong trend. A rising ATR can indicate a strengthening uptrend, while a declining ATR may signal a weakening downtrend.
- Long the asset during an uptrend and short during a downtrend.
- Consider exiting the trade when the ATR indicator starts to decline, suggesting a potential trend reversal.
Best practices for using ATR
- Understand the calculation and interpretation: Familiarize oneself with the formula used to calculate ATR and how it reflects market volatility. Then, understand the implications of different ATR values, such as high vs. low, and how they relate to price movements.
- Combine with other indicators: Use ATR in conjunction with other technical indicators, like moving averages, Bollinger bands and RSI, to gain a more comprehensive view of market conditions. Combining ATR with other indicators can provide stronger trading signals and reduce the risk of false breakouts or breakdowns.
- Regular monitoring and adjustment: Track ATR changes to identify shifts in market volatility. Then, adjust the trading strategy based on the observed ATR levels. For example, risk tolerance exposure can be increased during increased volatility periods and reduced during low volatility periods.
Find a currency pair’s ATR value to determine its volatility
With the help of the currency pair’s ATR value, you can determine how much a currency pair price has moved in the past and is currently moving. This also helps predict the future movement of the currency pair when combined with other directional indicators. Start trading currency pairs with our forex trading platform today to enjoy seamless trade execution and competitive spreads for making successful trading decisions. Sign up for a live trading account or try a demo account.