


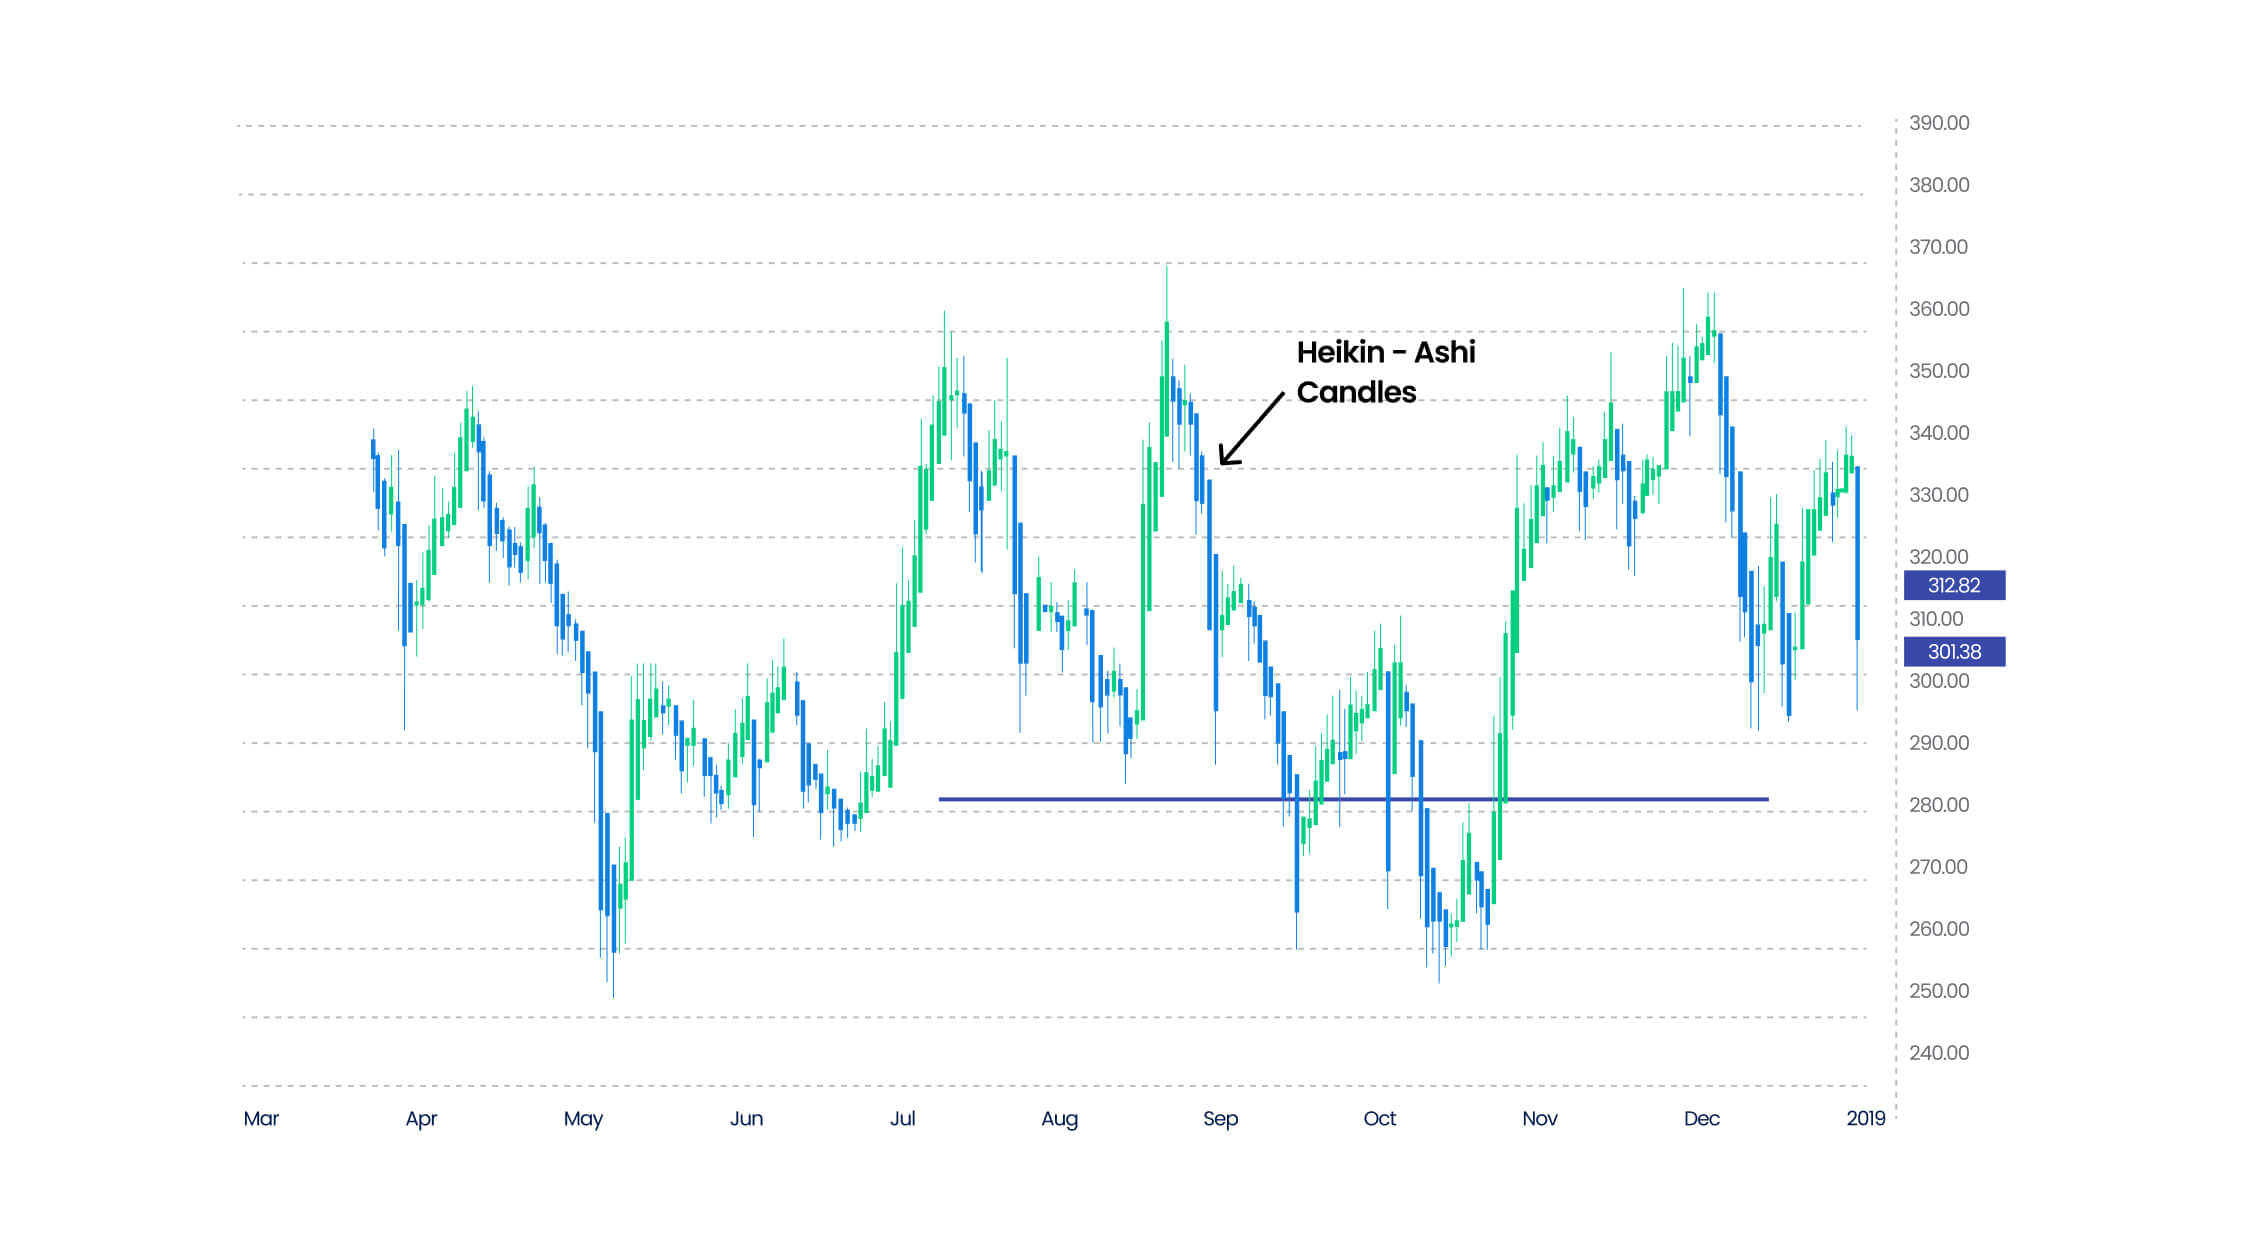
The Heikin Ashi Candlestick pattern is almost the same as the traditional candlesticks, with one big difference—the former is an averaged out version of the latter. The chart pattern can help traders spot Forex market trends, predict future prices, and determine the ideal time to enter, exit, or stay in the market. Let's take a look at what Heikin Ashi Candlestick really is and how you can effectively use it as a Forex trading strategy.
Understanding Heikin Ashi Candlestick
The Heikin Ashi Candlestick aims to filter out any noise in the currency pair prices by creating a chart pattern with averaged out prices. The pattern helps traders understand the market direction, trends, gaps, and reversals. It does not use the open, close, high, and low currency pair prices like the standard candlestick charts to depict the price movement graphically. Instead, it uses a formula based on two-period averages that help give the chart a smoother appearance, unaffected by any extreme price moves.
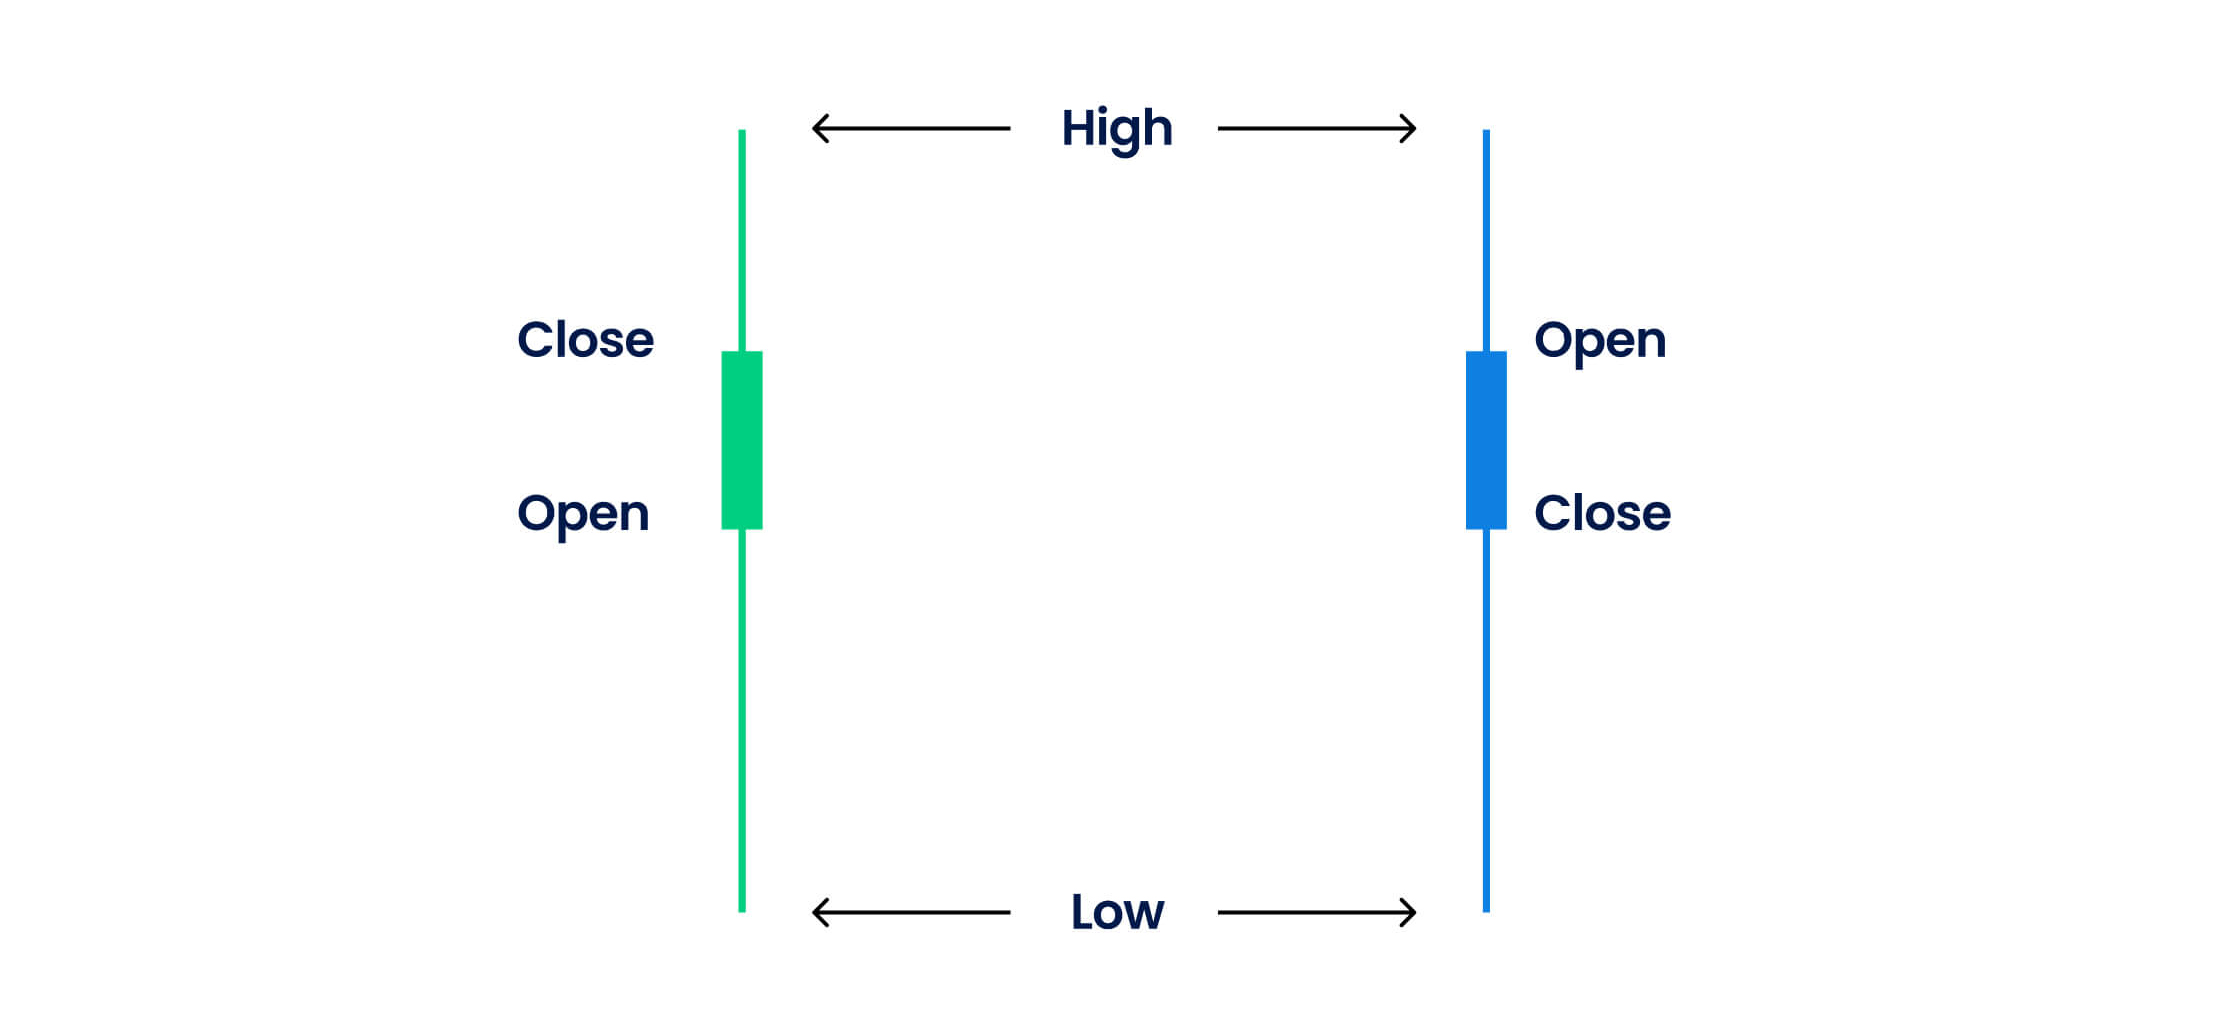
- The open price is the first trade price of the currency pair during the day
- The close price is the last trade price
- The high price, at the topmost portion of the candlestick, depicts the highest traded price
- The low price, at the bottom-most portion of the candlestick, depicts the lowest traded price
It is important to note that candles in the Heikin Ashi pattern with less or no shadow on top signal strong selling pressures in the market. On the other hand, candles with less or no lower shadow signal strong buying pressures in the market.
Calculating the Heikin Ashi Candlestick
The Heikin Ashi Candlestick calculation helps traders get all the separate candlesticks that the pattern consists of through the set of four price points - the high price, low price, open price, and close price.
- The first Heikin Ashi close price (indicating the current bar's average price) = 1/4 (open price + high price + low price + close price)
- The first Heikin Ashi open price (indicating the midpoint of the previous bar) = 1/2 (the opening price of the last bar + closing price of the last bar)
- The first Heikin Ashi high price (the highest price point in the period taken) = Maximum Value [High price, Open price, Close price]
- The first Heikin Ashi low price (the lowest price point in the period taken) = Minimum Value [Low price, Open price, Close price]
Trading the Heikin Ashi Candlestick pattern
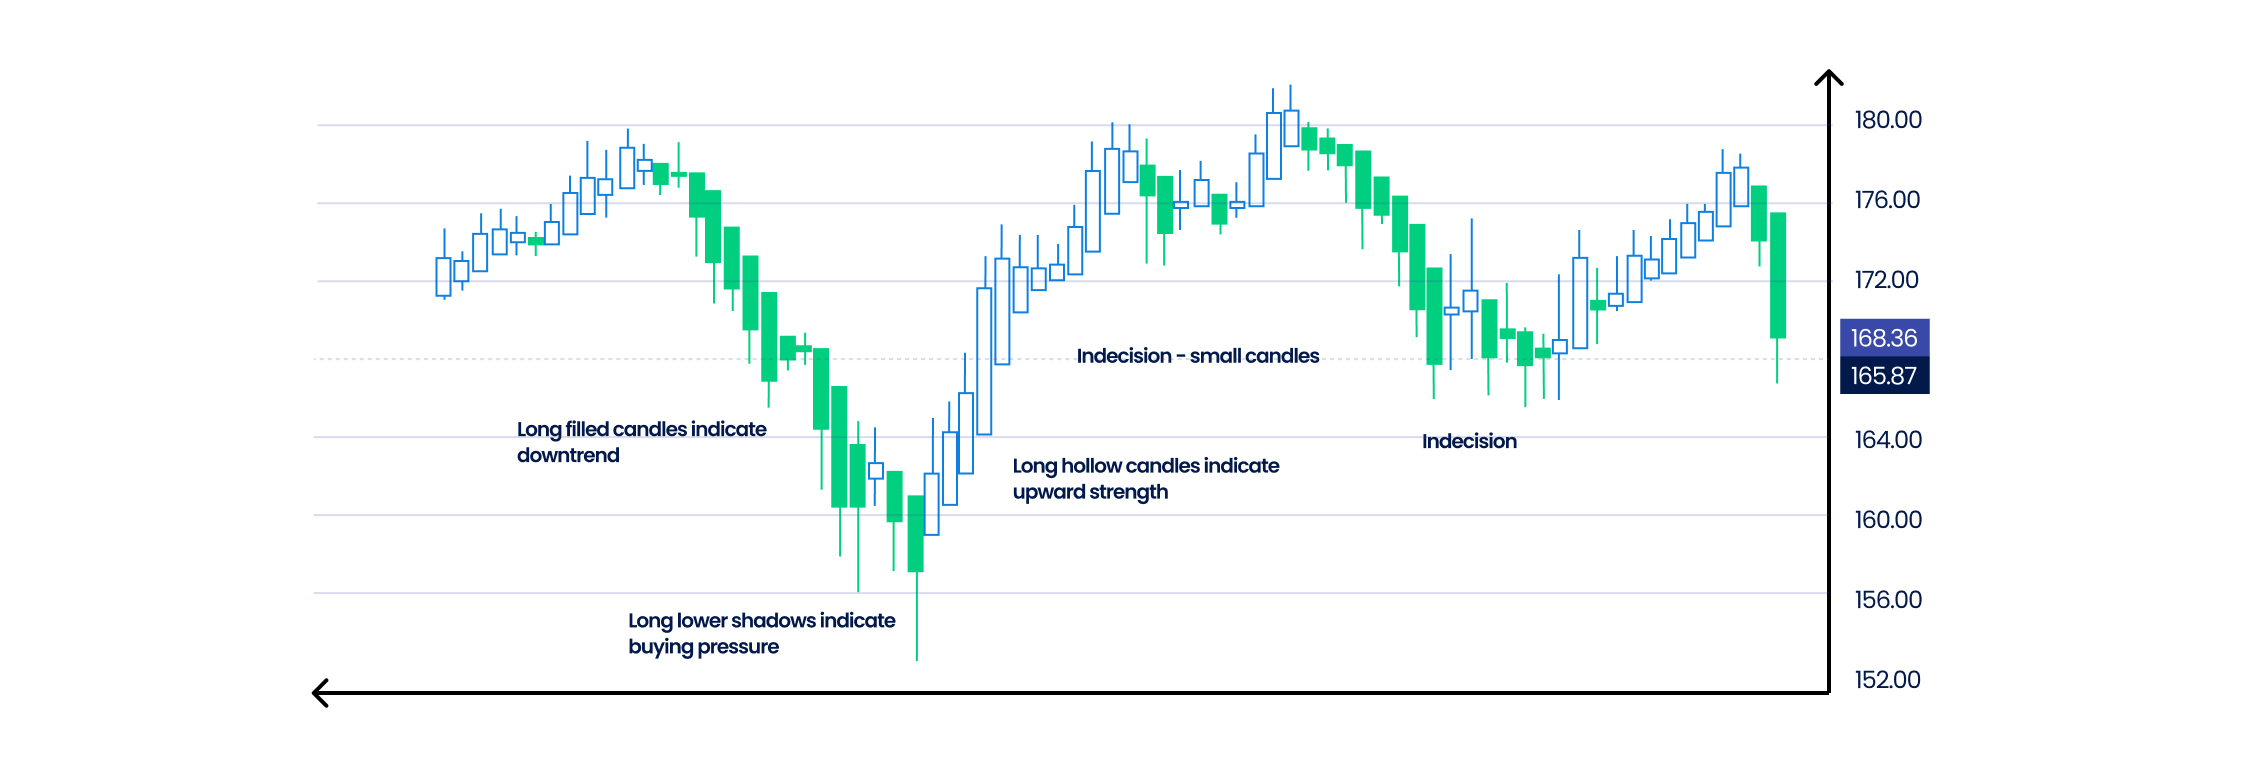
- When the candles do not have any lower shadows/tails or appear green in colour, they indicate a strong market uptrend, signalling traders to enter long positions
- All hollow candles send a bullish trend indication, signalling traders to exit short positions as soon a possible
- Filled, red, or candles that do not have higher shadows indicate a strong downtrend/bearish trend, indicating traders to short positions and exit long positions
- When a candle has a short body and is surrounded by lower and upper shadows/tails, it indicates a market trend reversal where traders can either enter or exit the market as per the market direction
- In the above situation, traders who wish to maximise profits enter into a short position when the market is in an uptrend and expected to reverse (with falling prices). Similarly, they enter a long position if the market is in a downtrend and it is expected to witness increasing prices.
Top three use cases of Heikin Ashi Candlestick
1. Identifying the candlesticks without shadows
The Heikin Ashi Candlestick pattern helps traders identify the candlesticks that come without any lower shadow, which are responsible for depicting a strong bullish trend. The beginning of this bullish trend enables trades to enter long positions in the market to gain maximum potential profits. The higher the number of candlesticks in a pattern without a tail/shadow, the stronger is the trend expected to be, with higher certainty about the profits. On the other hand, the pattern also enables traders to identify candlesticks without any upper shadows, which depicts a strong yet stable downward bearish trend with falling prices, signalling traders to short the positions to minimise losses.
2. Ascertaining the trend pauses and reversals
In the Heikin Ashi Candlestick pattern, the candles with small bodies signal traders about market trend reversals and pauses. A smaller candle opens right after the first candle in a continued trend and either closes above or below, indicating the trend reversal. Thereafter, a third candle, also with a small body, is formed to confirm the market's trend reversal.
3. Determining strong bullish and bearish market trends
The Heikin Ashi Candlesticks also help traders identify when to enter or exit the market by providing the strong bullish or bearish trend reversal points in the chart. As soon as a bullish trend emerges, traders exit their short positions and take long positions to maximise profits. Whereas, as soon as a bearish trend emerges, traders exit their long positions and take short positions to minimise losses.
Trade the Heikin Ashi Candlestick pattern to level up your trading strategy
This means the Heikin Ashi Candlesticks do not have any irrelevant price fluctuations. All the noise is filtered out for the traders to only receive significant price points necessary to trade in the market. Blueberry. is a leading, globally regulated trader that gives you access to a seamless trading experience and advanced trading tools to make trading more profitable for you. Sign up for a live trading account or try a demo account to make the most out of the Heikin Ashi Candlestick pattern.
Disclaimer:
- All material published on our website is intended for informational purposes only and should not be considered personal advice or recommendation. Traders should carefully consider their objectives, financial situation, needs, and level of experience before entering into any margined transactions.