Elevate your trading skills with Blueberry Academy

Gain valuable insights and enhance your trading expertise with our comprehensive educational resources, tailored for traders at all levels.
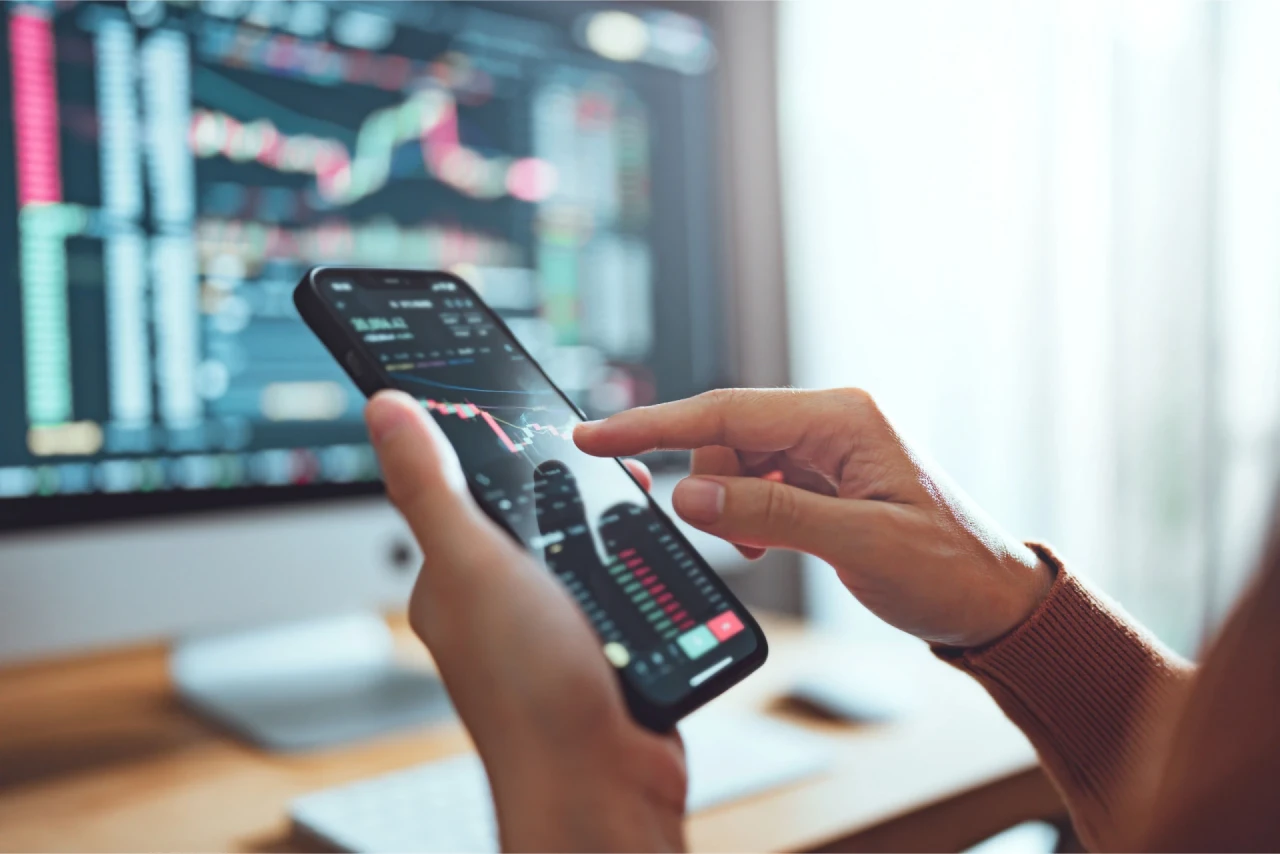
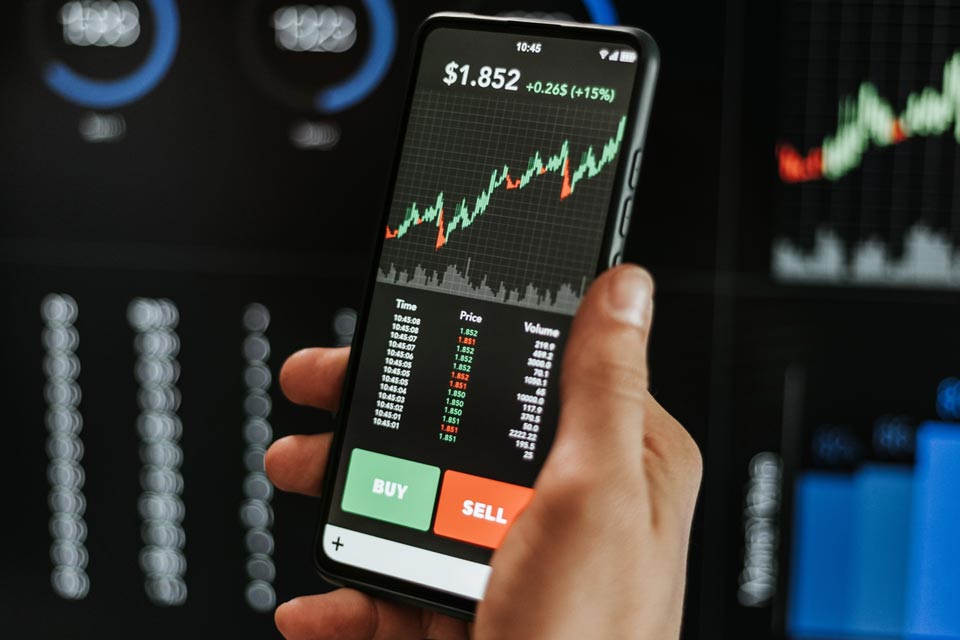
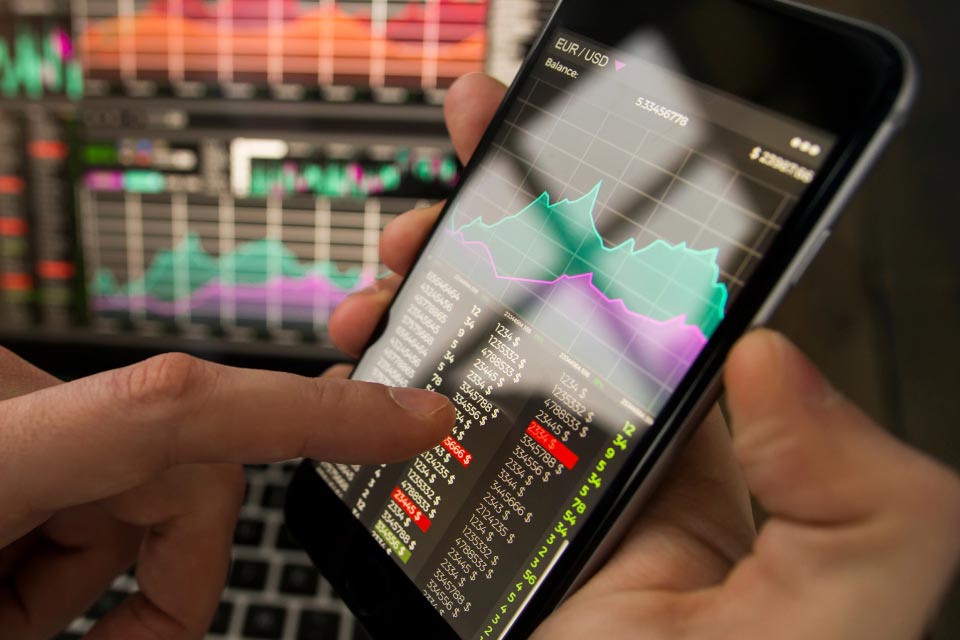
Mobile phone displaying real-time trading data, illustrating the concept of Forex margin and leverage.
Intermediate 5 min read
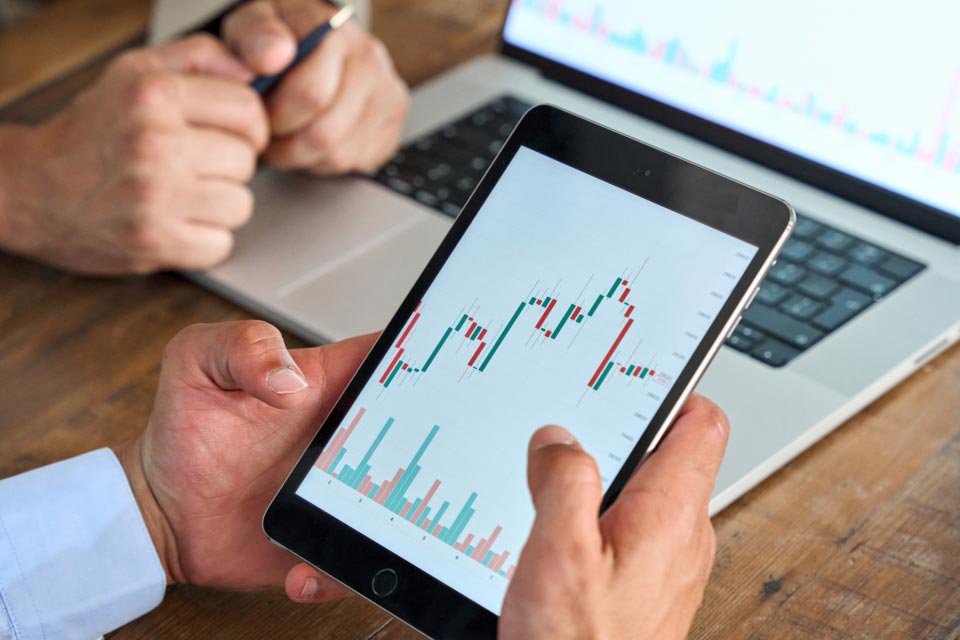
Man holding a tablet displaying a forex profit calculator interface for measuring trade profits and losses.
two smartphones displaying the MetaTrader 4 and MetaTrader 5 logos
Intermediate 8 min read
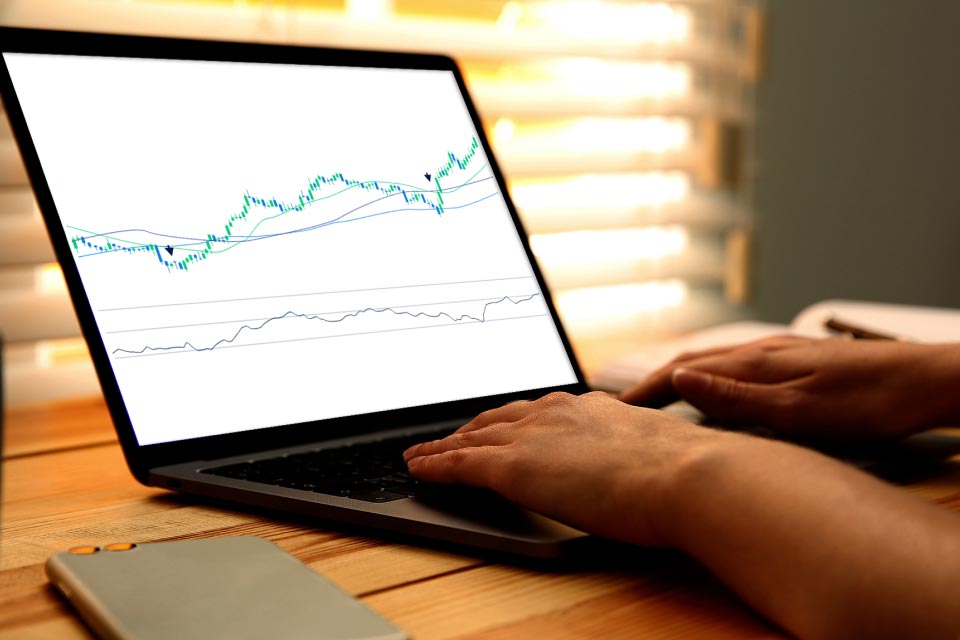
Person trading forex on a laptop and phone, analyzing charts with the Accelerator Oscillator, illustrating how to use the Accelerator Oscillator for forex trading.
Man trading forex using his phone and laptop, analyzing charts with the Alligator indicator, illustrating how to use the Alligator indicator in forex trading.
Trader holding a phone in front of a laptop, analyzing forex charts to identify the Bearish Gartley pattern.
Expert 5 min read
Trader holding a phone in front of a laptop, analyzing forex charts to understand the ABCD pattern in forex trading.
Expert 8 min read
Trader holding a phone in front of a laptop, analyzing the Hammer Candlestick Pattern on a forex chart.
Expert 8 min read
An image titled "What is The Oscillator of Moving Average in Forex?" showing a person analyzing forex trading charts on a laptop screen.
3D-rendered digital illustration of bullish and bearish market concepts, illustrating how to trade bearish and bullish pennant patterns.
A Forex Trader’s Guide to Awesome Oscillator
Average Directional Index: How to Use The Trend Strength Indicator?
Bullish and Bearish Flag Patterns: What’s The Difference?
Fundamental Analysis in Forex Trading Explained
How to Ace Divergence Trading in Forex
Advance 8 min read
Man scrolling through his tablet displaying forex charts, focusing on how to trade with double tops and bottoms in the forex market.
Man in glasses looking at his phone and laptop, analyzing forex charts to use the DeMarker indicator for trading.
Man holding a tablet, analyzing forex charts and the Chaikin Money Flow indicator, illustrating how to use the Chaikin Money Flow indicator in trading.
Advance 8 min read
Man holding a tablet and trading forex, analyzing charts with the Keltner Channel indicator, illustrating how to use the Keltner Channel for forex trading.
Man holding a tablet and trading forex, analyzing charts to explain the difference between leading and lagging indicators.
Man holding a tablet and trading forex, illustrating the concept of managing risk in 7 steps for effective forex management.
 Man holding a tablet and trading forex, highlighting essential MT5 indicators every trader should know.
Advance 8 min read
 Man holding a tablet and trading, analyzing charts to identify the Hanging Man candlestick pattern in forex trading.
Man holding a tablet and trading, analyzing forex charts to identify top continuation patterns.
Advance 8 min read
Man holding a tablet and trading, reviewing forex charts to highlight top indicators for MT4.
Advance 8 min read
Man holding a tablet and trading, analyzing charts to apply top MACD trading strategies in forex.
Advance 8 min read
Man holding a tablet, analyzing forex charts to highlight top support and resistance indicators.
Advance 8 min read
 Mobile phone showing real-time trading activity, illustrating the concept of understanding forex rollover rates.
Intermediate 5 min read
Man holding a tablet and trading, analyzing forex charts to understand market gap and slippage.
Advance 10 min read
Man trading on his phone and laptop, analyzing forex charts to understand Bollinger Bands.
Expert 5 min read
Man holding a tablet and trading, analyzing forex charts to understand pivot points in forex.
Advance 8 min read
 Man holding a tablet and trading, examining forex charts to understand trendlines in forex trading.
Advance 8 min read
Man holding a tablet and trading, analyzing forex charts to understand and use volume indicators.
Advance 8 min read
Trader holding a phone in front of a laptop, analyzing forex charts to understand currency correlation.
Expert 8 min read
Man holding a tablet and trading, analyzing forex charts to understand forex spot trading.
Advance 5 min read
Trader holding a phone in front of a laptop, analyzing forex charts to understand the Money Flow Index (MFI) indicator.
Expert 5 min read
Man holding a tablet, analyzing forex charts to understand the concept of slippage in forex trading.
Advance 8 min read
Trader holding a phone in front of a laptop displaying charts, representing the Evening Star Candlestick Pattern.
Trader holding a phone in front of a laptop, analyzing the Martingale Trading Strategy on a forex chart.
Man holding a tablet, analyzing the Tweezer Candlestick Formation on a forex chart.
Advance 8 min read
Man holding a tablet, analyzing the Volatility Index (VIX) on a financial chart.
Man holding a tablet, trading, illustrating the concept of order types in forex
Advance 6 min read
Man holding a tablet, trading, illustrating top forex trading strategies that actually work
Man holding a tablet, trading, illustrating top low spread scalping strategies for forex traders
Trader holding a phone in front of a laptop, illustrating what forex expert advisors are
Expert 5 min read
Man holding a tablet, trading, illustrating what forex currency swap is
Advance 5 min read
A Step-by-Step Guide to Utilizing a No Stop-loss Trading Strategy in Forex
A conceptual 3D-rendered illustration of a magnifying glass with a blue metallic frame and floating circular elements, symbolizing analysis and measurement, representing "Average True Range: What It Is and How to Calculate It."
Candlestick Patterns: Top Candlestick Charts Every Trader Should Know
a trader holding a phone
Advance 8 min read
A 3D illustration of a calendar, clock, coins, and an upward arrow, symbolizing market activity and financial planning, representing the concept of "Forex Trading on Weekends."
Advance 5 min read
Hedging in Forex
Intermediate 5 min read

Hedging in Forex

17 Sep, 2024
A close-up of a forex trading chart with red and blue indicators, showing a pen pointing at a candlestick, representing technical analysis and stochastic indicator usage in forex trading.
A sign of the Commodity Futures Trading Commission (CFTC) on a brick wall, symbolizing forex market regulation and oversight by financial authorities.
Intermediate 5 min read
A 3D-rendered illustration of a briefcase filled with stacked currency bundles and an upward arrow, symbolizing forex position sizing and risk management strategies in trading.
Intermediate 5 min read
How to Copy Trade With MetaTrader
Expert 5 min read
A magnifying glass highlighting forex trading signals on a digital chart, representing the search for the best forex trading signals.
Advance 8 min read
A creative arrangement of various uniquely shaped mugs, symbolizing the concept of identifying a cup and handle pattern in forex trading.
A person placing a stop loss order on a forex trading app via smartphone, with candlestick charts displayed on both the mobile screen and a desktop monitor in the background.
Intermediate 5 min read
Smartphone screen showing forex buy and sell options, representing how to trade forex for beginners.
Intermediate 5 min read
Man trading on a computer with forex charts on screen, focusing on how to trade forex with an NFP V-shaped reversal pattern.
Man using phone and laptop for forex trading, analyzing charts to trade the Gartley pattern.
Expert 5 min read
 Man trading forex on his phone while referencing charts on his laptop, illustrating how to trade with multiple time frame analysis in forex.
Forex charts displayed on a screen with the On Balance Volume (OBV) indicator, and a pen pointing to key chart points, illustrating how to trade with the OBV indicator.
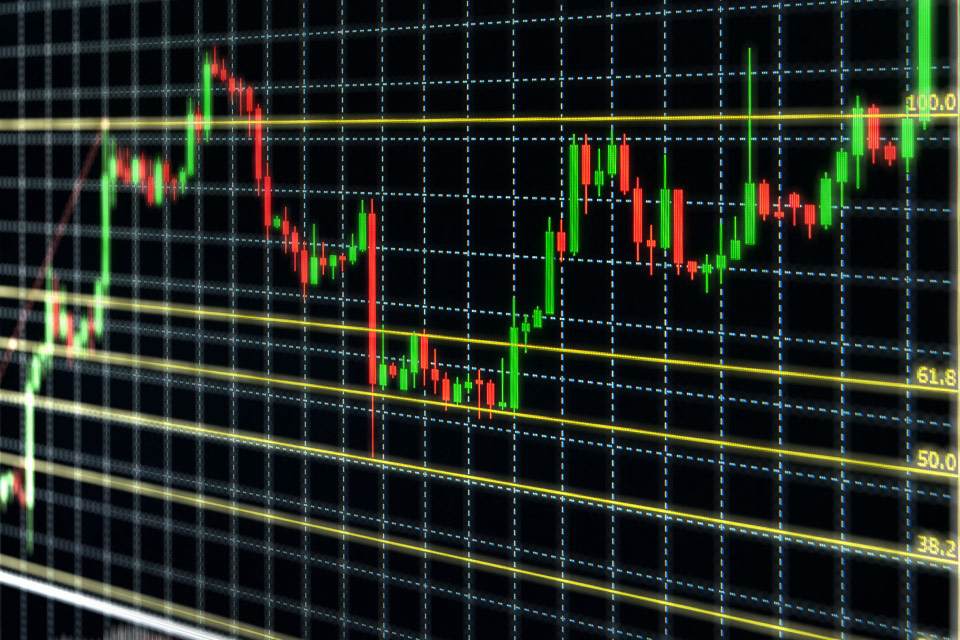
Financial trading chart displaying Fibonacci retracement levels with yellow grid lines, illustrating how to use Fibonacci retracement in forex trading.
Trader holding a phone in front of a laptop, analyzing forex charts, illustrating how to use the Martingale strategy for trading.
Expert 5 min read
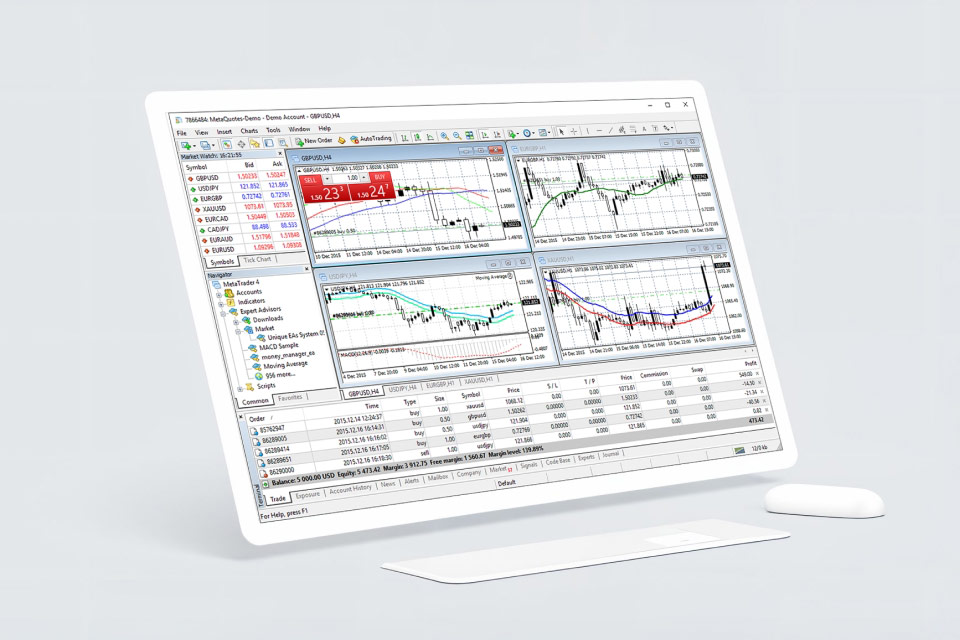
Computer monitor displaying the MetaTrader 4 trading platform, illustrating a complete guide to using MetaTrader 4.
Intermediate 10 min read
Hand holding a smartphone displaying the MetaTrader 5 logo on the screen, highlighting the powerful trading platform for forex, stocks, CFDs, and futures.
Intermediate 8 min read
Trader holding a phone in front of a laptop, analyzing forex charts to illustrate the concept of a moving average crossover in trading.
Expert 8 min read
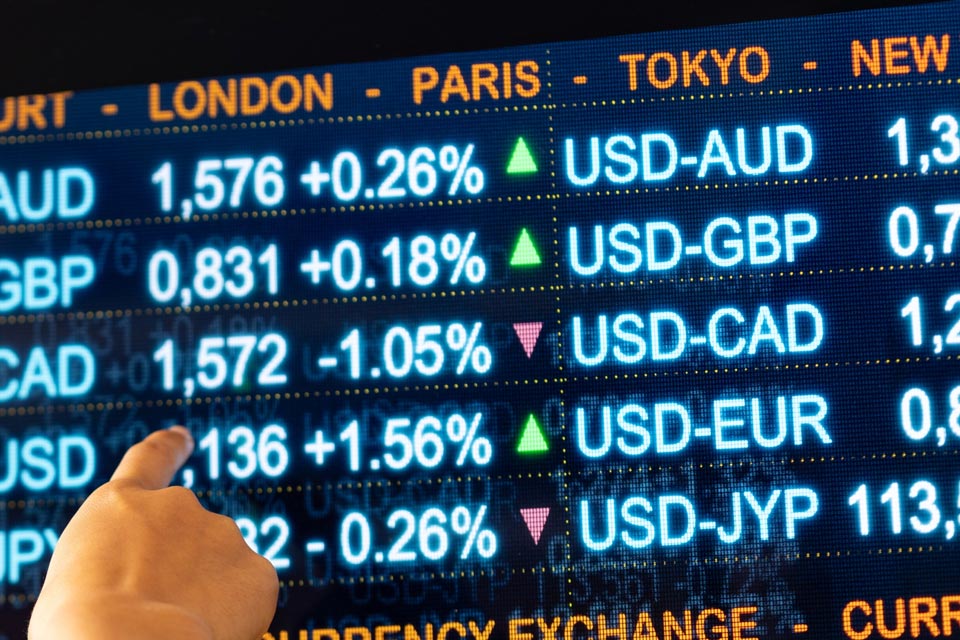
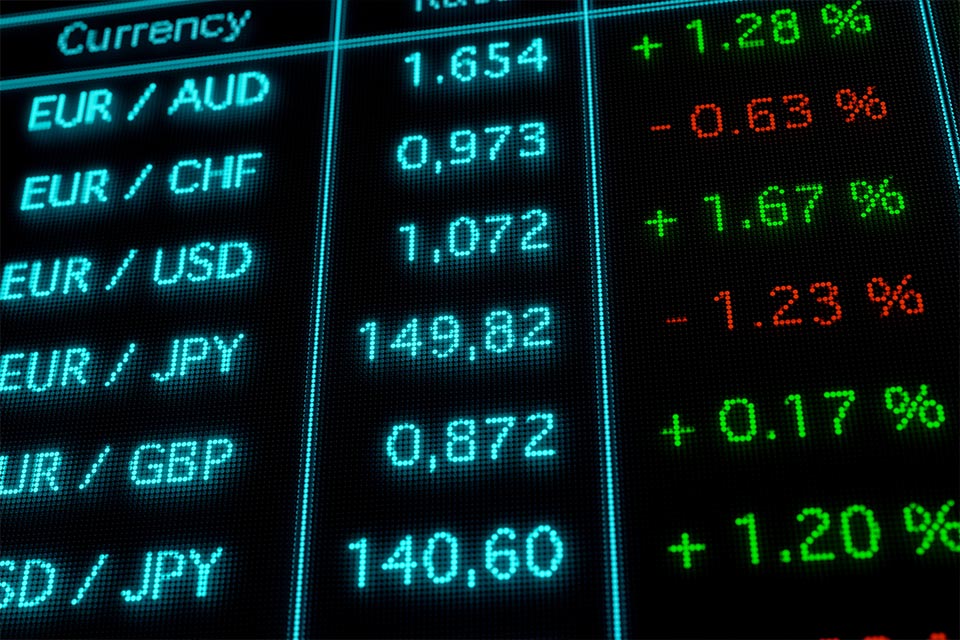
Forex trading board displaying live exchange rates of major currency pairs, illustrating the concept of PIP in forex trading.
Intermediate 5 min read
3D abstract representation of price action trading strategy, illustrating key concepts from the ultimate guide to price action trading.
Visualization of a digital financial ecosystem featuring a glowing globe, graphs, and charts, illustrating the Beginner’s Guide to MQL5.
Expert 8 min read
Trader holding a phone in front of a laptop, analyzing forex charts to identify the Bullish Three Drive pattern.
Expert 5 min read
3D-rendered candlestick chart with metallic blue and silver bars, illustrating top advanced forex trading strategies you should know.
Trader holding a phone in front of a laptop, analyzing market data to illustrate top fundamental trading strategies you should know.
Real-time trading displayed on a device, illustrating top pullback trading strategies in forex.
Expert 5 min read
Man trading on his phone and laptop, analyzing forex charts to understand Andrew's Pitchfork trading strategy.
Mobile phone displaying real-time trading, illustrating key concepts in understanding forex risk management.
Intermediate 8 min read
Trader holding a phone in front of a laptop, analyzing forex charts to use the Accumulation/Distribution indicator for trading.
Trader holding a phone in front of a laptop, analyzing forex charts to understand ascending and descending triangle patterns.
Trader holding a phone in front of a laptop, analyzing forex charts to understand Bear and Bull Power indicators.
Expert 5 min read
Mobile phone displaying real-time trading data, illustrating the concept of a currency pair in forex.
Intermediate 5 min read
Trader holding a phone in front of a laptop, analyzing forex charts to understand the Heikin Ashi candlestick chart pattern.
Mobile phone displaying real-time trading data, illustrating the concept of a spread in forex.
Intermediate 8 min read
Trader holding a phone in front of a laptop, analyzing forex charts to understand the Commodity Channel Index (CCI).
Expert 8 min read
 Mobile phone displaying real-time trading data, illustrating the concept of gap trading in forex.
Intermediate 5 min read
Man using his phone and PC simultaneously while trading, representing the concept of swing trading.
Intermediate 8 min read
Trader holding a phone in front of a laptop, analyzing forex charts with the Linear Regression indicator.
Expert 8 min read
Trader holding a phone in front of a laptop, analyzing the Ichimoku Kinko Hyo Indicator on a forex chart.
Expert 8 min read
Trader holding a phone in front of a laptop, analyzing the MACD (Moving Average Convergence Divergence) Indicator on a forex chart.
Expert 8 min read
Trader holding a phone in front of a laptop, both screens showing trading charts representing the Opening Range Breakout strategy.
Expert 8 min read
Trader holding a phone in front of a laptop displaying a chart with the Parabolic SAR indicator.
Expert 8 min read
Habits of Successful Forex Traders illustrated by a back view of a trader celebrating success, raising arms in victory.
Intermediate 5 min read
3D illustration of stacked trading blocks, illustrating key steps to make your first trade in forex
Intermediate 5 min read
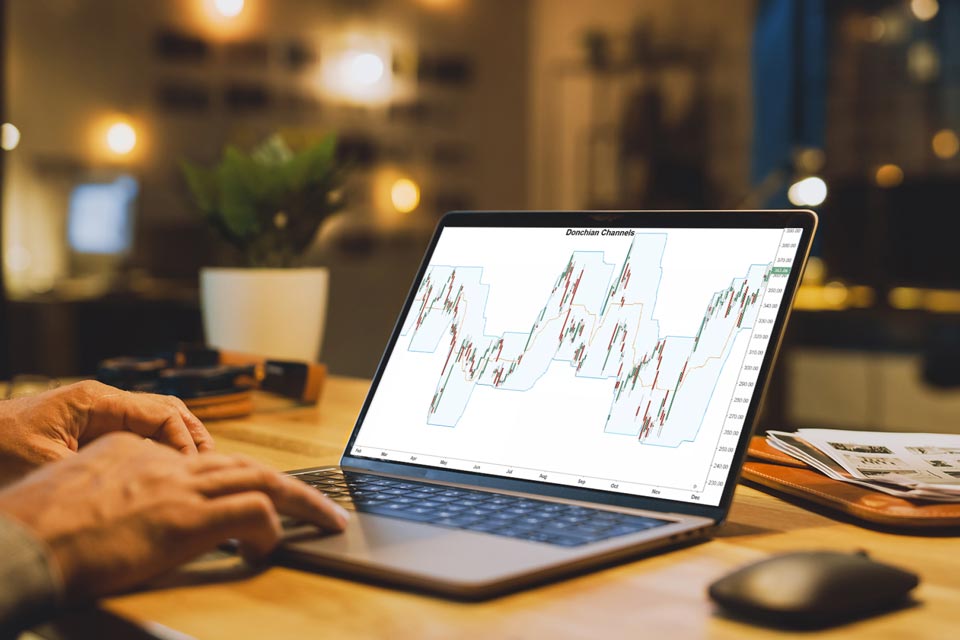
A person analyzing a laptop screen displaying a Donchian Channel trading chart, illustrating the Donchian Channel Indicator
Advance 6 min read
Trader holding a phone in front of a laptop, illustrating trading in volatile markets
Expert 5 min read
A trader analyzing forex market data on a smartphone with charts and currency pairs, illustrating what forex is
Intermediate 5 min read

What is Forex?

17 Sep, 2024
3D illustration of a financial graph with magnifying glass on a blue background, illustrating what margin trading is
Intermediate 5 min read
An image titled "What is The Favourite Fib Fibonacci Retracement Strategy?" showing a trader holding a phone in front of a laptop displaying financial charts.
An image titled "Who Trades Forex?" showing a magnifying glass focusing on a single blue figure among a crowd of white figures, representing the diversity of forex traders.
Intermediate 4 min read

Who Trades Forex?

17 Sep, 2024
An image titled "Why Trade Forex?" showing a focused trader analyzing a forex trading platform displayed on a desktop monitor.
Intermediate 3 min read

Why Trade Forex?

17 Sep, 2024
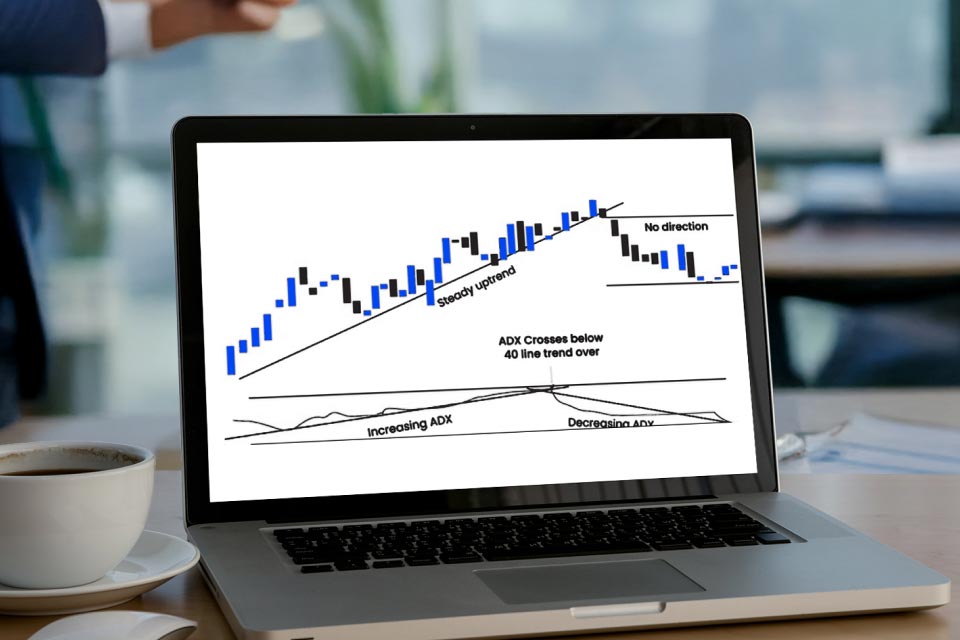
5 Top ADX Trading Strategies: A chart showing ADX crossing below the 40 line with trends labeled 'Increasing ADX' and 'Decreasing ADX', illustrating key momentum signals for trading.
Advance 8 min read
8 Top Commodity Trading Strategies: A financial chart displaying numerical values including 40.1, 15.13, and percentage changes like 35.54%, 6%, 49%, and 39%, highlighting key metrics for commodity trading analysis.
A 3D-rendered illustration of a black bear and a blue bull facing off on top of financial charts and market data, symbolizing the concept of "Bearish and Bullish Markets: What is the Difference?"
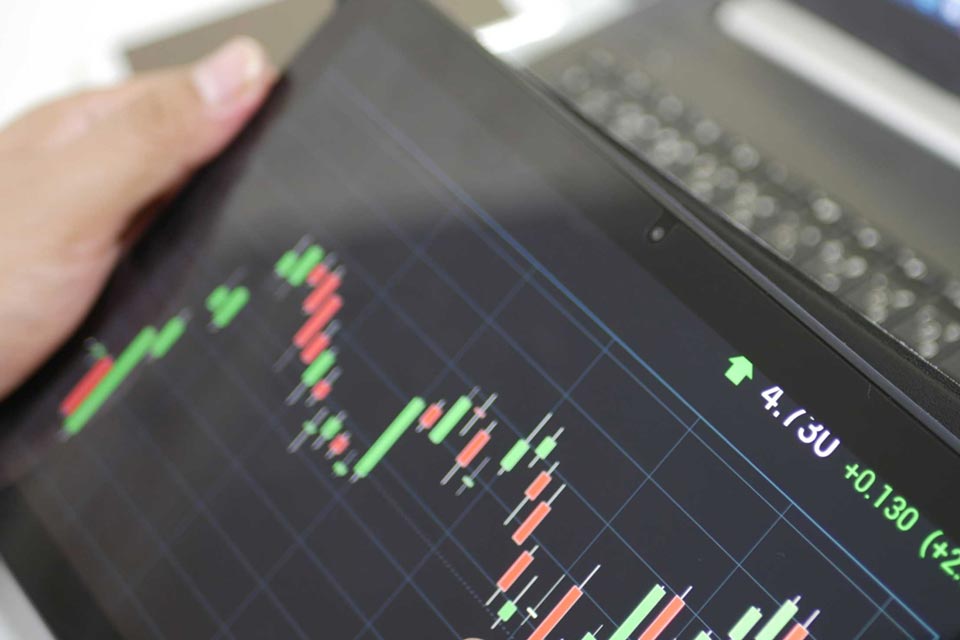
A trader holding a tablet displaying a candlestick chart with green and red bars, representing price movements in forex, illustrating the concept of "Breakout Trading and Fakeout Trading in Forex."
Advance 5 min read
A close-up of a keyboard with a black "BUY" key and a blue "SELL" key, symbolizing trade execution in forex, representing the concept of "Buy Limit vs Sell Stop Orders in Forex."
Advance 5 min read
A robotic hand typing on a laptop displaying a trading chart, symbolizing automated forex trading systems and algorithmic trading, illustrating "Forex Trading Robots: How Do They Work?"
Advance 5 min read
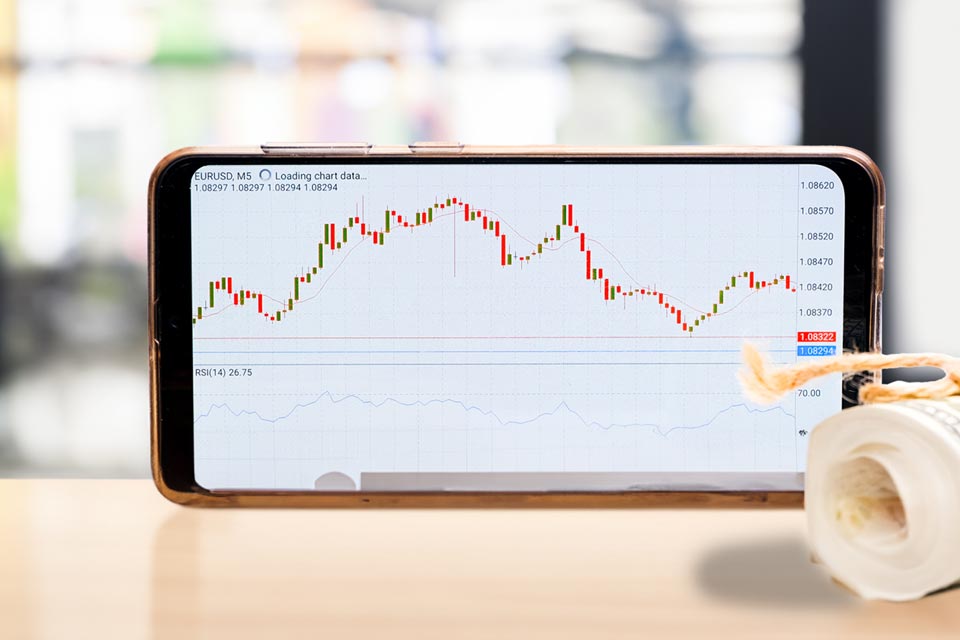
A smartphone displaying an MT4 trading chart with indicators, showing EUR/USD price movement and RSI values, illustrating how traders can add and use indicators for analysis.
Advance 8 min read
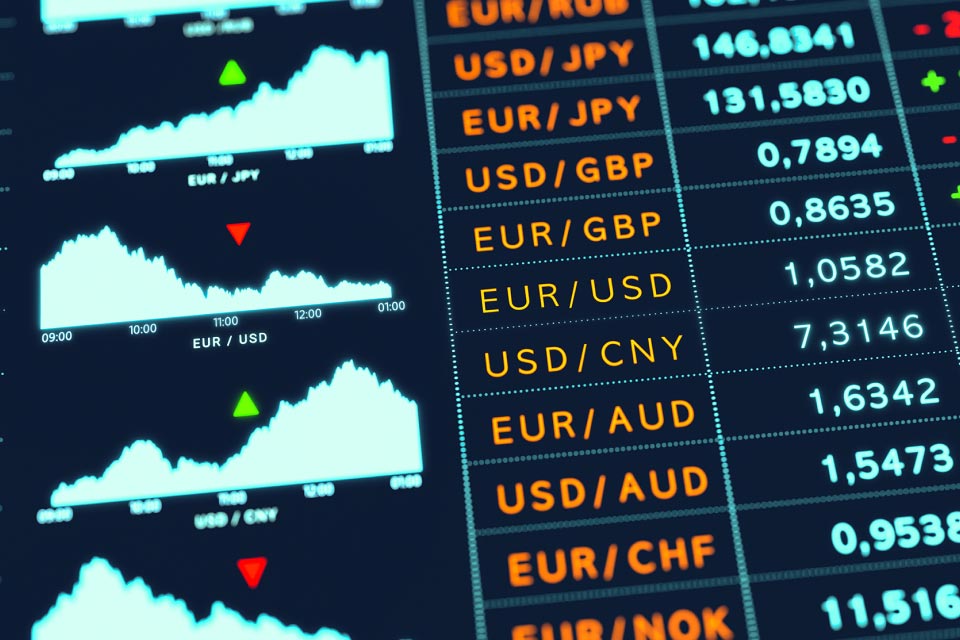
A forex trading screen displaying currency pairs and price charts, illustrating how to identify a trend in the forex market.
Advance 5 min read
A 3D illustration of a briefcase with stacked files and an upward arrow, representing the process of installing MT4 in a beginner's guide.
Advance 8 min read
Forex trading screen displaying currency charts and indicators, illustrating the concept of how to short sell a currency.
Advance 5 min read
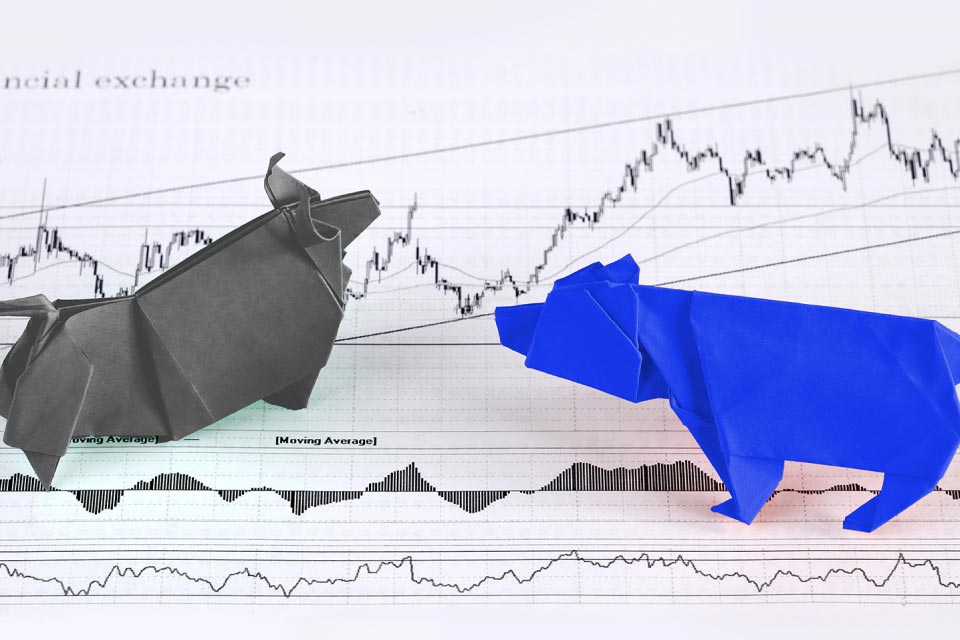
Origami bull and bear figures standing on a paper with forex charts, symbolizing how to trade bullish and bearish divergences in currency markets.
Advance 5 min read
Screen displaying BTC/USD forex charts with the VWAP indicator, illustrating how to trade with the VWAP indicator in forex.
Advance 8 min read
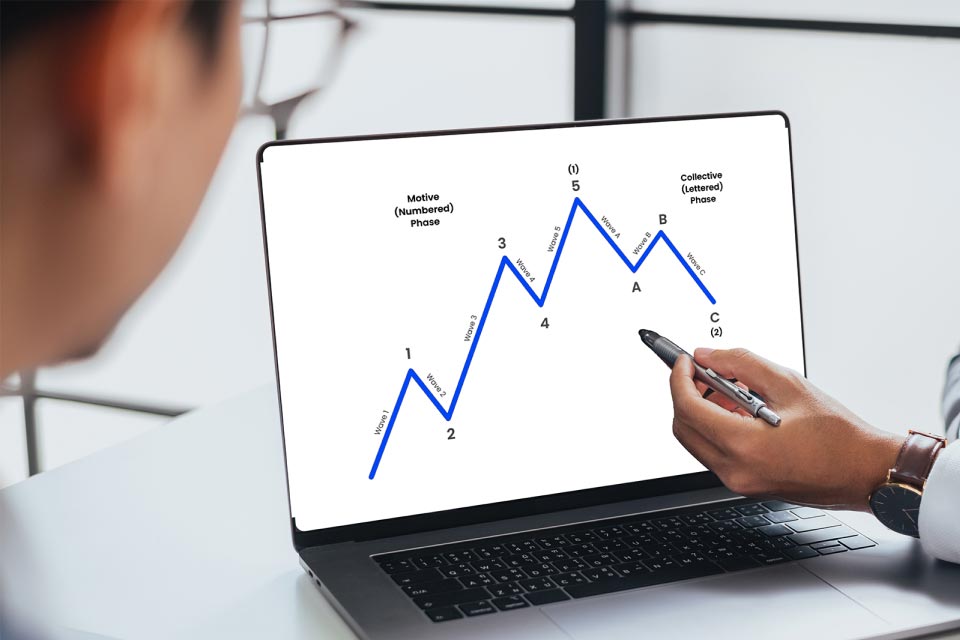
Man at a table with a laptop, holding a pen and pointing at a chart, illustrating how to use Elliott Wave Theory for forex trading.
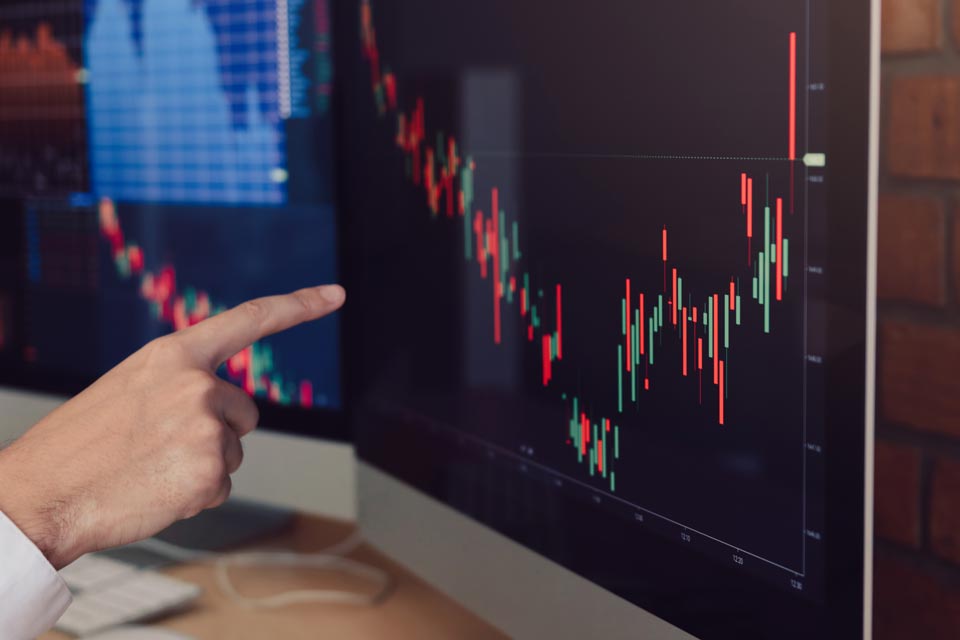
Person pointing to a screen displaying forex charts and market data, illustrating how to use forex market sentiment indicators.
Advance 5 min read
Trading monitor displaying a GBP/USD candlestick chart with oscillating price movements, illustrating how to use the Gator Oscillator for forex trading.
Advance 3 min read
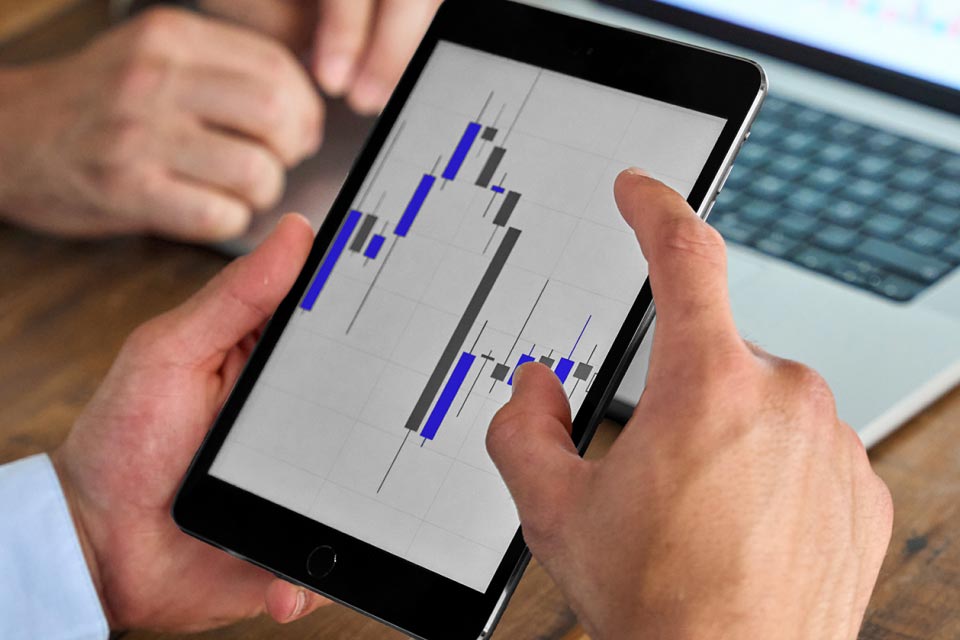
Hands holding a tablet displaying candlestick chart patterns, illustrating how to use the Inside Bar trading strategy in forex.
Expert 5 min read
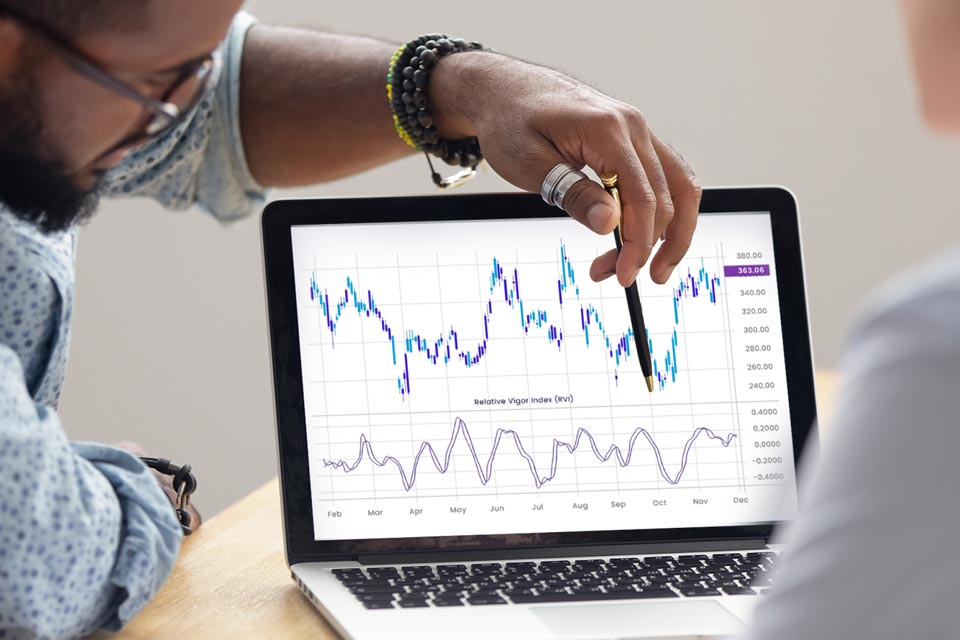
Laptop screen displaying a forex chart with the Relative Vigor Index (RVI) indicator, illustrating how to use the RVI in forex trading.
Advance 5 min read
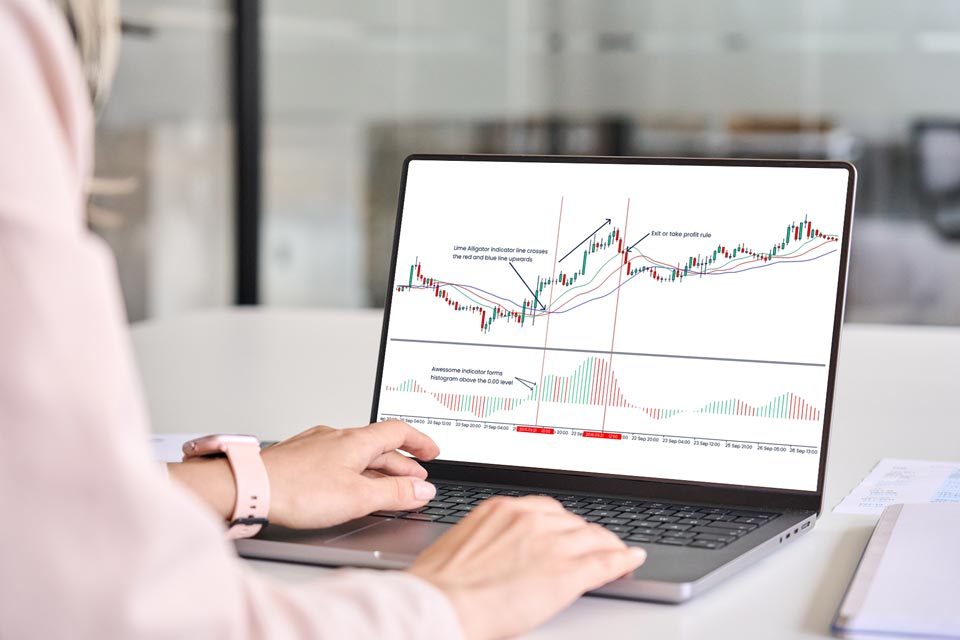
Trader analyzing a laptop screen displaying forex charts with Bill Williams indicators, illustrating how to use the Bill Williams Indicator in trading.
Advance 8 min read
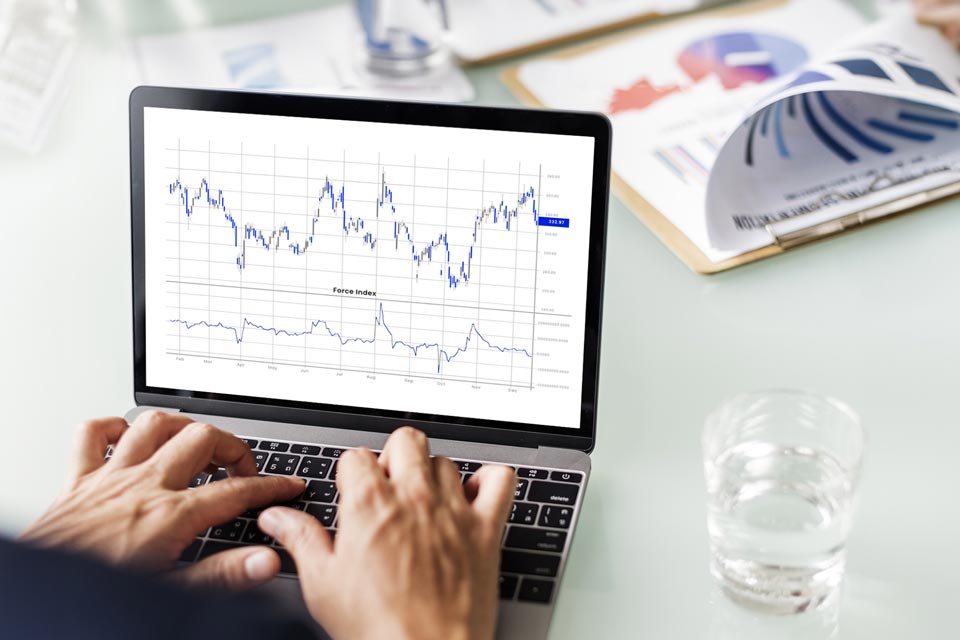
 Person analyzing a trading chart with the Force Index indicator displayed on a laptop screen, illustrating how to use the Force Index indicator in forex.
Advance 3 min read
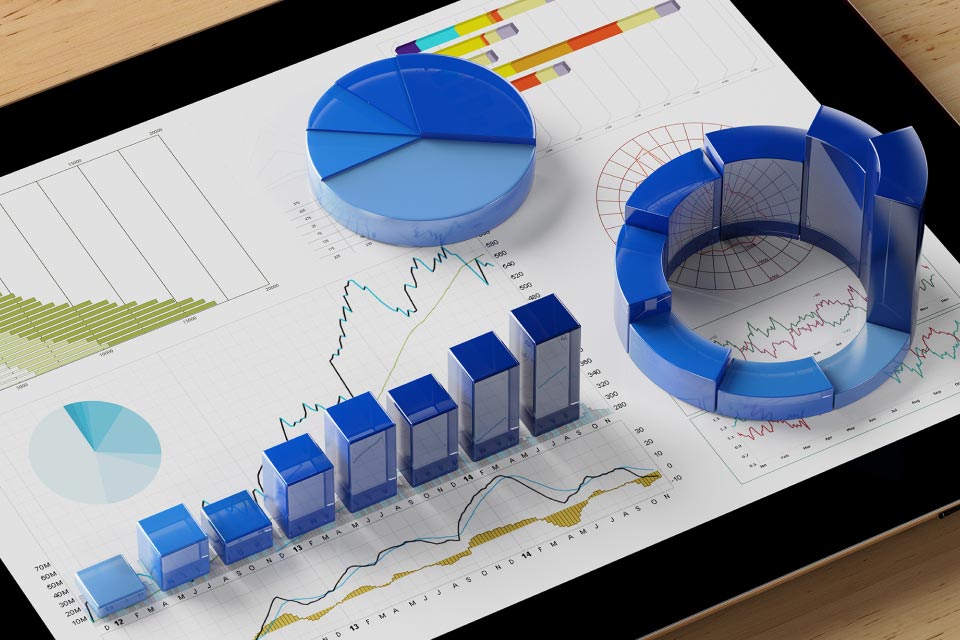
Digital tablet displaying 3D blue graphs and pie charts, illustrating an introduction to technical analysis in forex trading.
Advance 5 min read
Laptop on a table displaying a trading platform interface with candlestick charts, illustrating the difference between market order and limit order in forex trading.
Financial chart displaying candlestick patterns and moving average curves, illustrating a complete guide to using moving averages in forex trading.
Advance 5 min read
Trader analyzing financial charts on a smartphone and a laptop simultaneously, illustrating the difference between scalping and swing trading strategies.
3D illustration of stacked coins with exchange arrows on a dark background, symbolizing support and resistance levels in forex trading.
Intermediate 8 min read
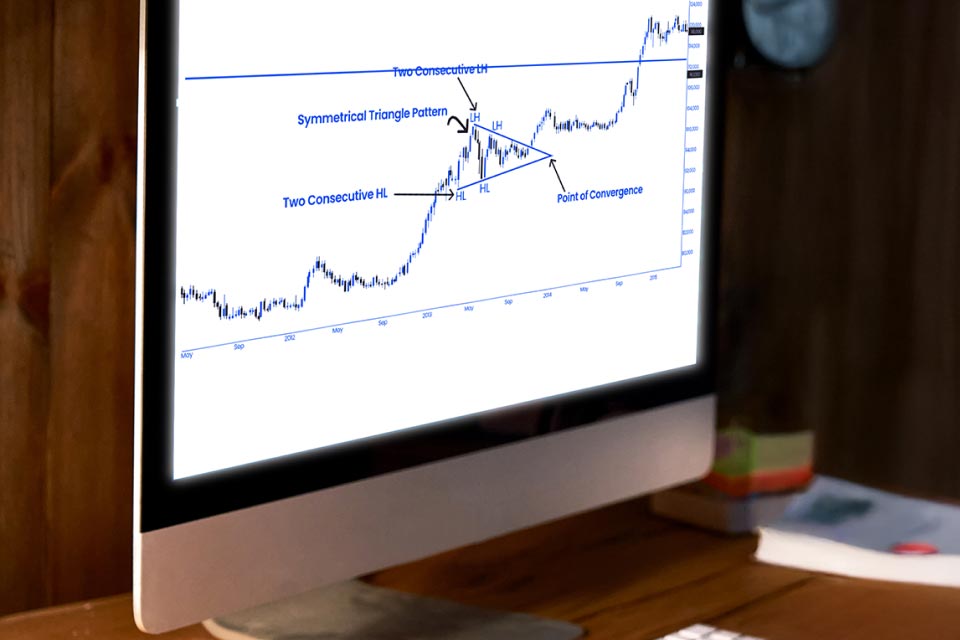
Desktop screen displaying a forex trading chart with annotations, illustrating the symmetrical triangle pattern and explaining everything about this forex chart pattern.
Illustration of a calendar, clock, stacked coins, and an upward arrow, symbolizing the best time frame for forex trading.
Advance 8 min read
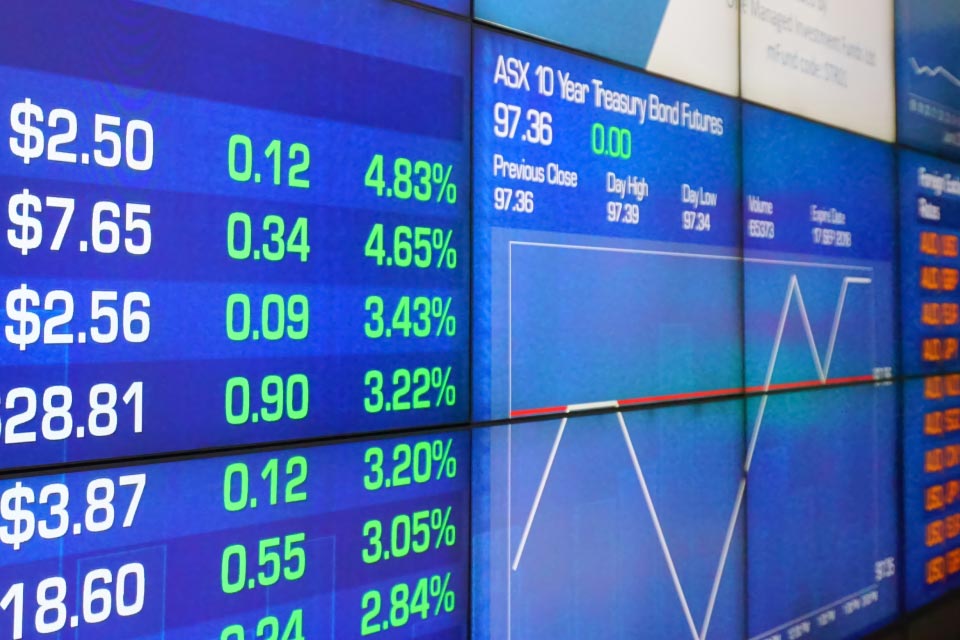
Digital trading screen displaying stock prices and percentage changes, illustrating the ultimate guide to trading trends in forex.
Advance 8 min read
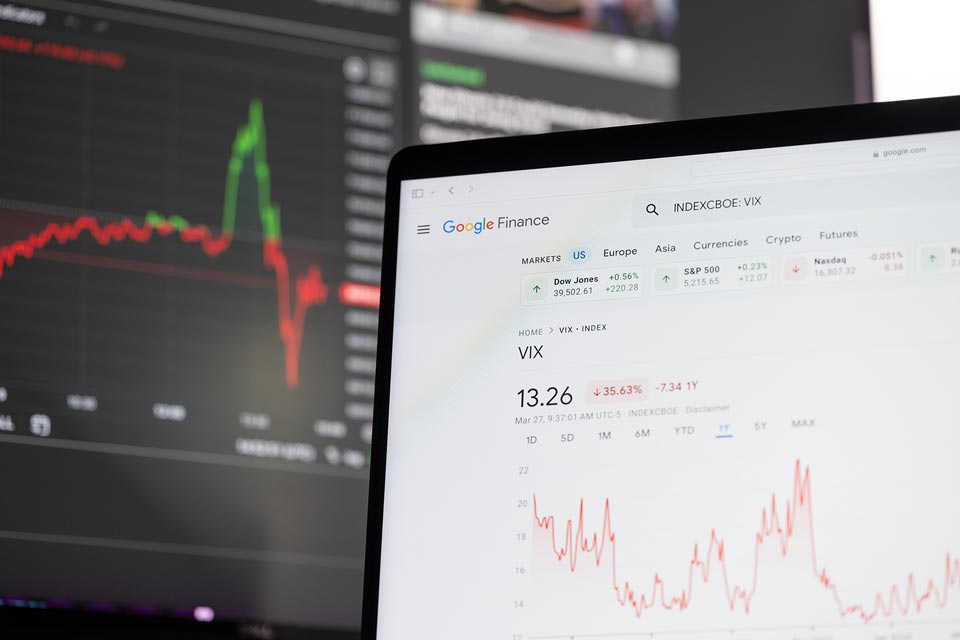
Computer screen displaying Google Finance with the VIX index and charts, illustrating top forex volatility indicators.
Advance 8 min read
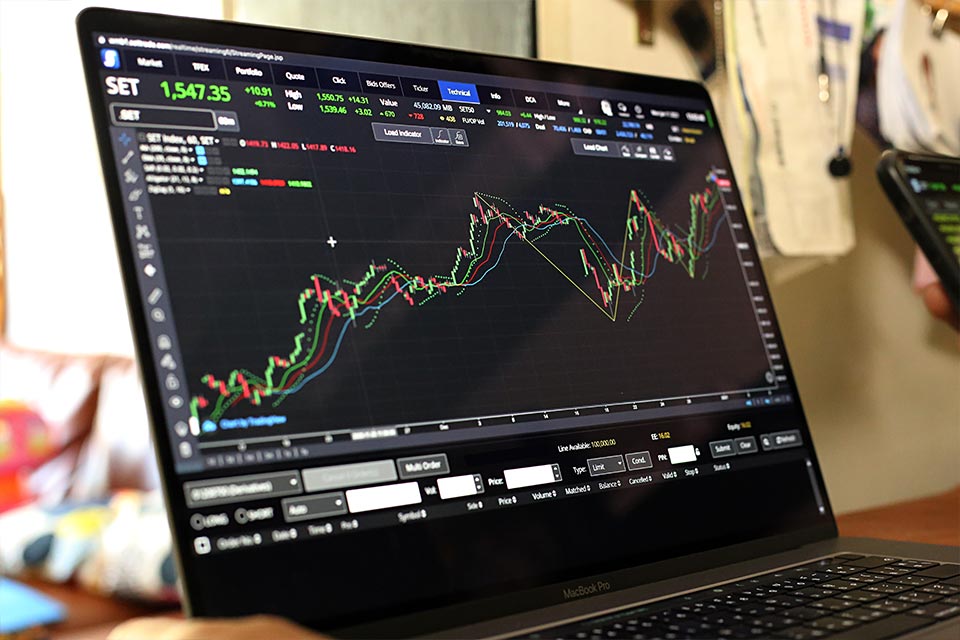
Trading platform displayed on a laptop screen, featuring technical indicators, illustrating top momentum indicators to analyze trend strength.
Digital display featuring the word 'PIVOT' in bold text surrounded by numerical data, illustrating top pivot point strategies in forex trading.
Advance 8 min read
Man holding a tablet and trading, analyzing forex charts to identify top reversal patterns for forex trading.
Advance 8 min read
Man holding a tablet, studying forex charts to identify top trading chart patterns.
Advance 8 min read
Man holding a tablet and trading, analyzing charts to understand the Shooting Star candlestick pattern in forex trading.
Man holding a tablet and trading, analyzing forex charts to understand falling and rising wedge patterns.
Advance 8 min read
Man holding a tablet and trading, analyzing forex charts to understand harmonic price patterns in forex.
Advance 8 min read
Mobile phone showing real-time trading activity, illustrating the concept of long and short positions in forex.
Intermediate 5 min read
Man holding a tablet and trading, analyzing forex charts to understand momentum indicators in forex.
Advance 8 min read
Man holding a tablet and trading, studying forex charts to understand and trade using the Doji candlestick pattern.
trader holding a phone in front of a laptop
Expert 5 min read
Man holding a tablet and trading, analyzing forex charts to understand momentum trading and top momentum trading strategies.
Trader holding a phone in front of a laptop, analyzing forex charts to understand the Morning Star indicator pattern.
Advance 8 min read
Man holding a tablet and trading, analyzing forex charts to understand the concept of a PIP in forex.
Advance 8 min read
Man holding a tablet and trading, analyzing forex charts to understand the concept of scalping in forex.
Advance 8 min read
Trader holding a phone in front of a laptop displaying a bullish engulfing candlestick chart pattern.
Expert 8 min read
Man holding a tablet displaying a forex chart with the Exponential Moving Average (EMA) indicator.
Advance 7 min read
Man holding a tablet, analyzing a volume trading strategy on a financial chart.
Advance 8 min read
A visually symbolic representation of financial balance using metallic coin stacks and weights, illustrating the concept of "How To Trade Forex With Japanese Candlesticks?"
Advance 5 min read
Various international currencies rolled up side by side, illustrating leverage in forex
Intermediate 5 min read

Leverage in Forex

16 Sep, 2024
A close-up of a hand pointing at a computer monitor displaying technical trading charts, illustrating technical trading strategies for day traders
Advance 6 min read
Illustration of Yen and Euro symbols with circular arrows on a blue background, illustrating tips for forex trading for beginners
Intermediate 4 min read
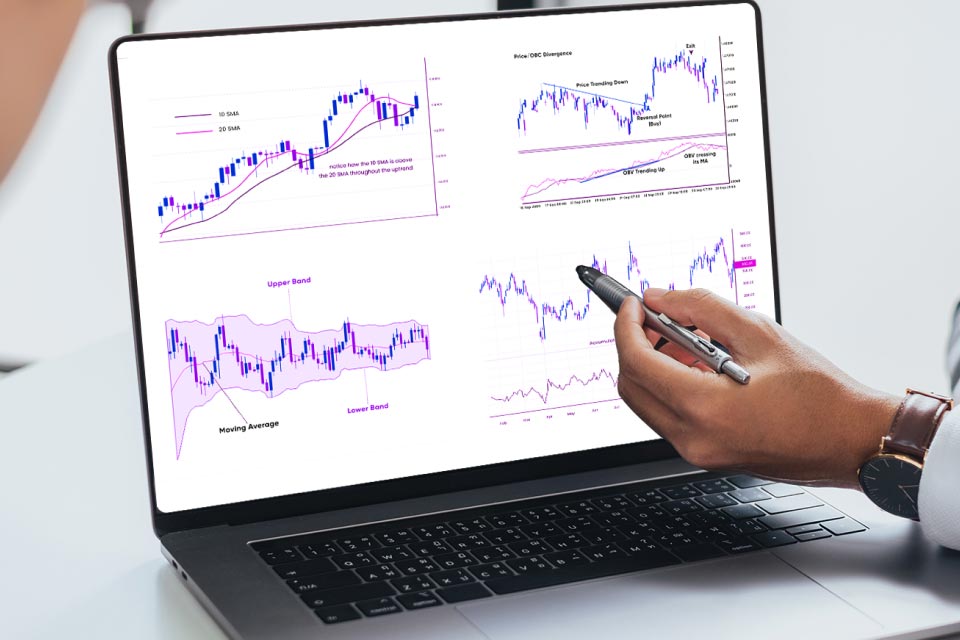
Close-up of a laptop screen displaying various forex technical indicators, illustrating top technical indicators in forex
Advance 5 min read
Man holding a tablet, trading, illustrating using orders to manage risk in forex
Advance 6 min read
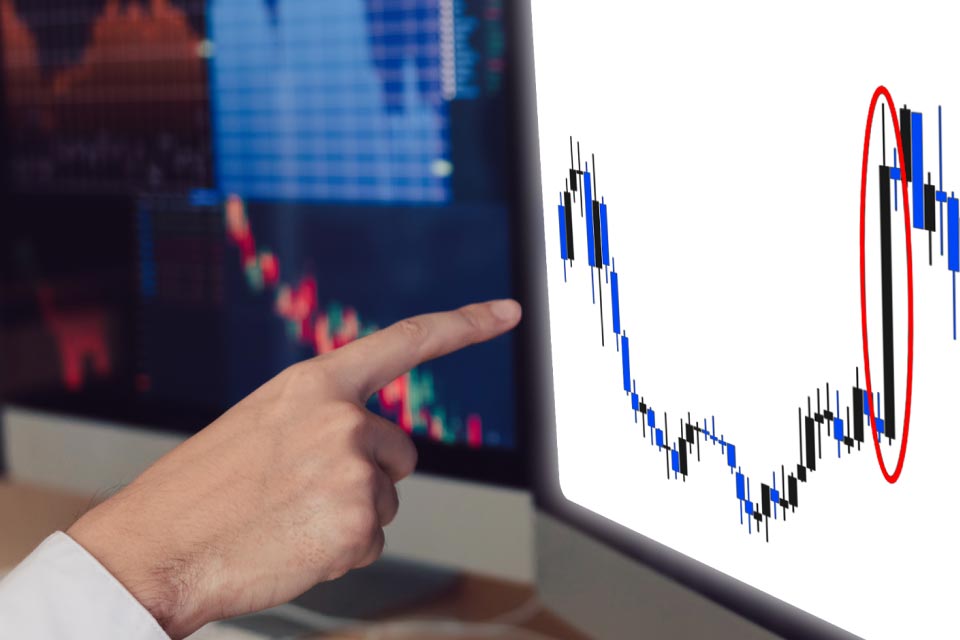
Close-up of a hand pointing at a candlestick chart on a computer screen, illustrating what wide ranging bars are
Advance 7 min read
An image titled "When Can You Trade Forex?" featuring a 3D metallic representation of stacked rectangular shapes and pillars, symbolizing structured forex trading sessions.
Intermediate 4 min read