

MetaTrader 4 (MT4) is a powerful trading platform that is widely used by forex traders around the world. One of the key advantages of MT4 is its ability to incorporate a vast array of technical indicators, which can be used to analyze price movements and identify trading opportunities.
In this article, we will explore the top 10 essential MT4 indicators for technical analysis.
What are MT4 indicators?
MT4 technical indicators are technical analysis tools used by forex traders to analyze and forecast price movements of financial instruments. These indicators are designed to identify trends, support and resistance levels, momentum, and volatility in the market. Traders can use these indicators to help them make informed trading decisions, including when to trade a currency pair.
Top 10 MT4 indicators for technical analysis
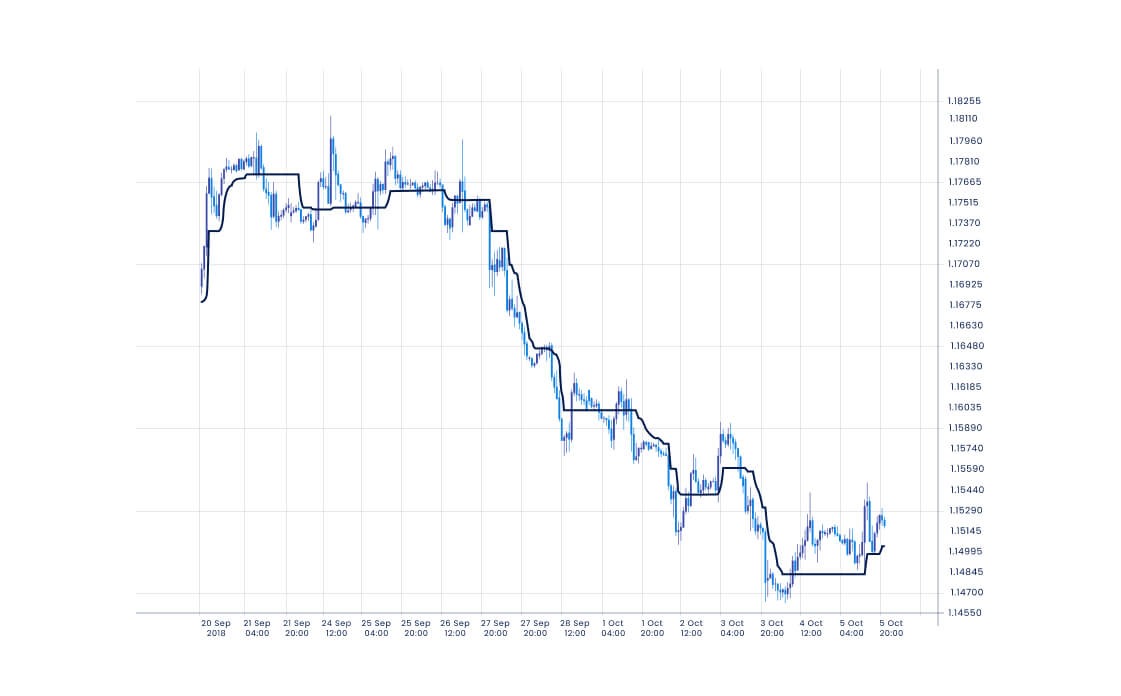
1. Trend Magic Indicator
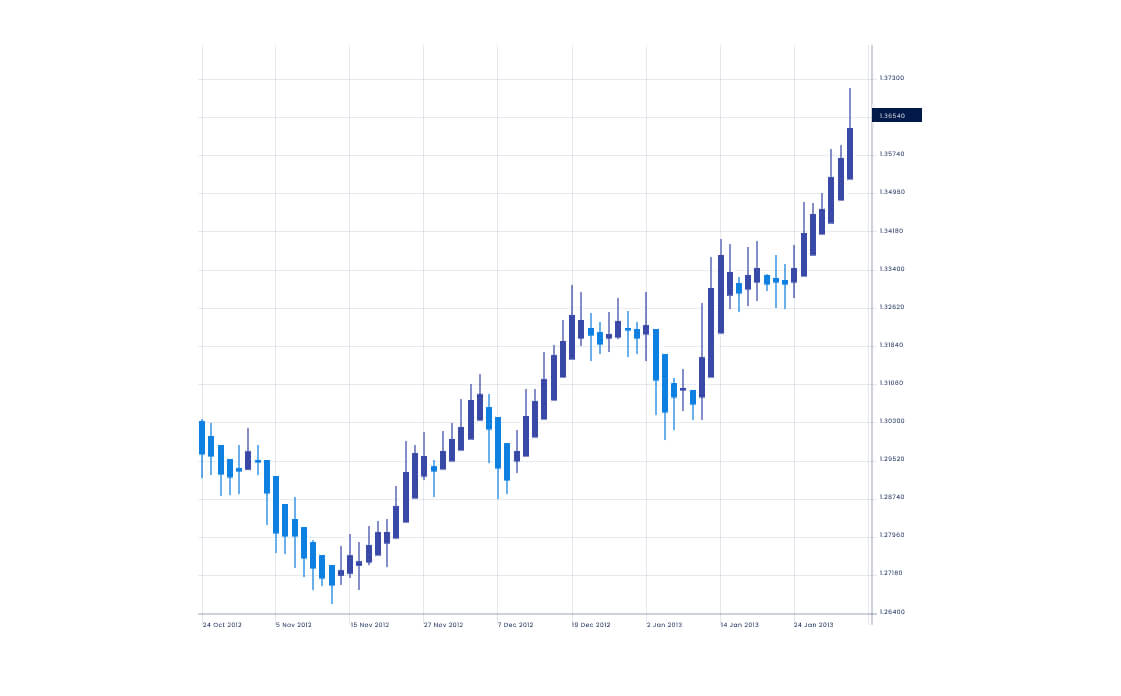
The Trend Magic indicator is a custom indicator available in MT4 that uses the Trend Magic algorithm to generate trade signals. It uses a combination of Moving Averages and candlestick patterns to identify trends, reversals and potential entry and exit points on the MT4 platform.
When the indicator shows a green arrow and dots above the price chart, it indicates a bullish trend, and traders may consider trading the currency pair and vice versa.
To add this indicator in MT4, here are the steps traders should follow
- Select Insert from the top menu and choose Indicators or use the shortcut key Ctrl + I.
- Select the Trend category and choose the Trend Magic indicator.
- Once added to the chart, the indicator will display as a line chart with green and red dots representing trading signals, respectively.
This graph has been recreated from the original source. Please note this image is a representation only and is not provided as general or personal advice.
2. Aroon Indicator
The Aroon indicator is a technical analysis tool used in MT4 forex trading to identify trends and potential trend reversals. It does this by measuring the strength of the trend in a specific time period.
The indicator consists of two lines:
- Aroon Up line measures the number of periods since the highest price within the time frame
- Aroon Down line measures the number of periods since the lowest price
When the Aroon Up line reaches a level of 100 and trends nearby along with the Aroon Down line reaching 0 or nearby, it indicates a strong uptrend and signals traders to enter long orders. Whereas traders can short the trade if the opposite happens.
By default, the Aroon indicator in MT4 is calculated based on a 14-period time frame. However, traders can customize this value by changing the Period setting in the indicator's properties window.
To apply the Aroon indicator to a chart in MT4, traders can drag and drop it from the Navigator window onto the desired chart. They can also customize the indicator's appearance and settings by right-clicking on the chart and selecting Properties.

This graph has been recreated from the original source. Please note this image is a representation only and is not provided as general or personal advice.
3. Gentor CCI
The Gentor CCI indicator aims to provide clearer signals and reduce false signals. The indicator is based on the Commodity Channel Index (CCI) indicator.
It provides trading signals based on a baseline that is on the zero level. When the baseline turns green, it indicates positive CCI values and indicates traders to place a long order. On the other hand, when the baseline is yellow, it indicates that CCI values are negative and short orders can be placed.
Here are the steps to use the Gentor CCI indicator in MT4:
- Download and install the indicator on the platform.
- Once installed, traders can open the chart of the currency pair or asset that they want to trade and insert the indicator from the Indicators menu.
- The indicator will appear on the chart as a line that oscillates above and below the baseline.
Traders can adjust the indicator settings on the MT4 platform itself, such as the period and levels, to suit their trading strategy. For example, a shorter period may provide more sensitive signals but also more false signals, while a longer period may provide more reliable signals but with a longer delay.
This graph has been recreated from the original source. Please note this image is a representation only and is not provided as general or personal advice.
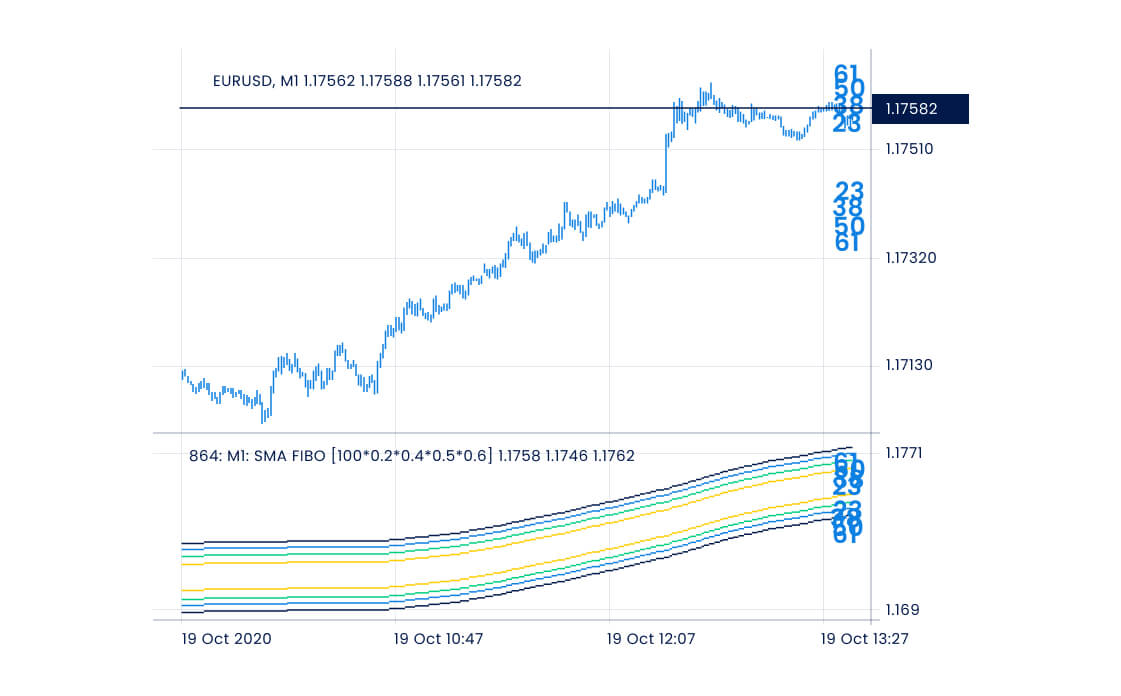
4. MA Channels FIBO
The MA Channel FIBO indicator is a technical analysis tool in MT4 which can help identify trends and potential support and resistance levels. The indicator consists of two Moving Averages plotted above and below the chart's price bars which form a channel, and the Fibonacci retracement levels plotted within the channel.
Here is a step-by-step guide to use the MA Channel FIBO indicator in MT4:
- Open the indicator from the Navigator window.
- Adjust the parameters of the indicator, such as the period of the Moving Averages and the level of the Fibonacci retracement, to suit their trading style and preferences.
- Apply the indicator to the trading chart.
This graph has been recreated from the original source. Please note this image is a representation only and is not provided as general or personal advice.
5. Fisher Indicator
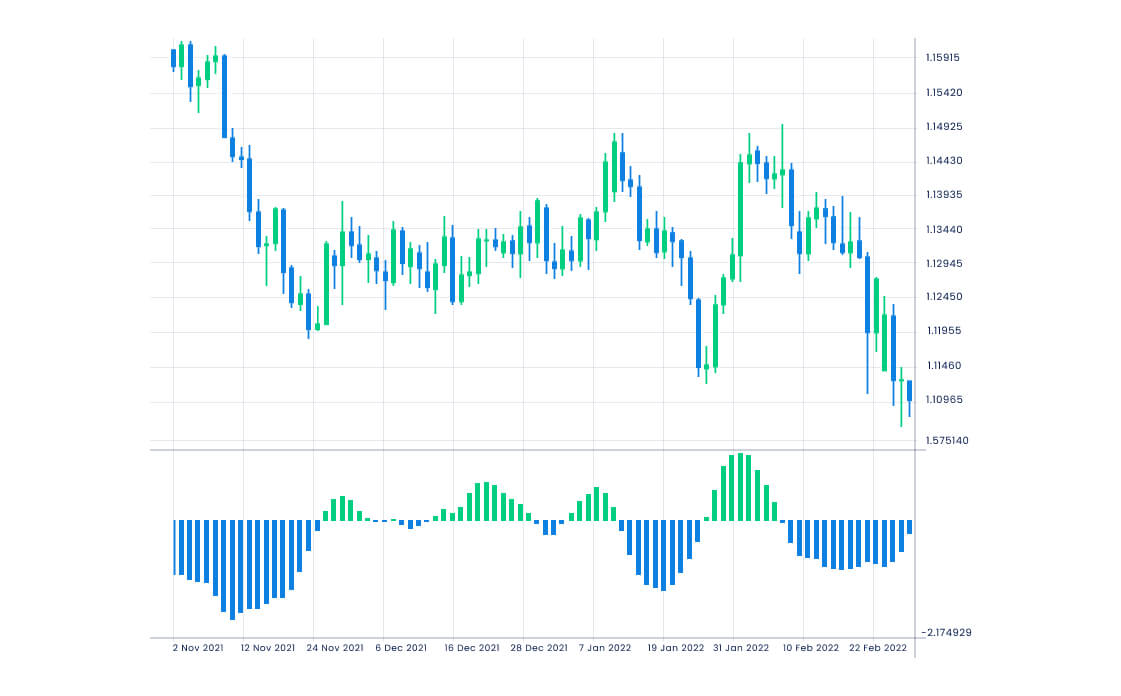
Fisher indicator is a histogram indicator which can indicate a market trend's strength and direction, while also identifying potential trend reversals in the market.
When the indicator crosses above the zero line and plots green bars, it indicates a bullish signal and a potential uptrend whereas the reverse of this indicates a potential downtrend.
Here is how traders can use the Fisher Indicator in MT4:
- To install the indicator, download it from a reliable source and then place it in the Indicators folder of the MT4 directory.
- Apply it to charts by selecting it from the list of indicators in the Navigator window.
- In addition, traders can also customize the settings of the Fisher Indicator in MT4.
This graph has been recreated from the original source. Please note this image is a representation only and is not provided as general or personal advice.
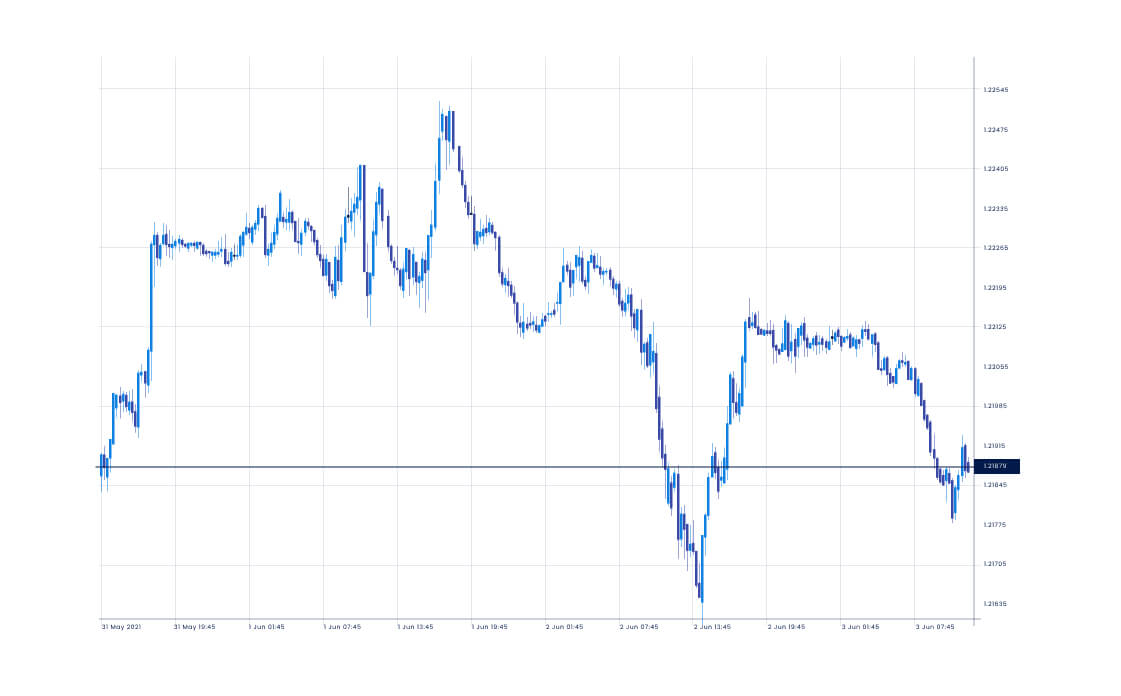
6. Zigzag Indicator
The Zigzag indicator is a technical analysis tool that helps traders identify in what direction the currency pair is headed. It works by drawing a series of lines that connect the high and low points of a price chart.
The indicator can be added the same way as other indicators onto the chart. Once the Zigzag indicator has been added to the chart, traders can adjust the settings to suit their needs. This may include changing the depth, deviation, and backstep parameters to adjust the sensitivity of the indicator.
In MT4, the Zigzag indicator can be displayed in three different drawing modes: Lines, Sections, and Points.
- In Line mode, the Zigzag indicator is displayed as a continuous line connecting the swing highs or swing lows.
- In Section mode, the Zigzag indicator is displayed as a series of connected line segments that do not intersect with each other.
- In Point mode, the Zigzag indicator is displayed as a series of dots that mark the swing highs and swing lows. Traders can choose the drawing mode that best suits their needs and preferences.
This graph has been recreated from the original source. Please note this image is a representation only and is not provided as general or personal advice.
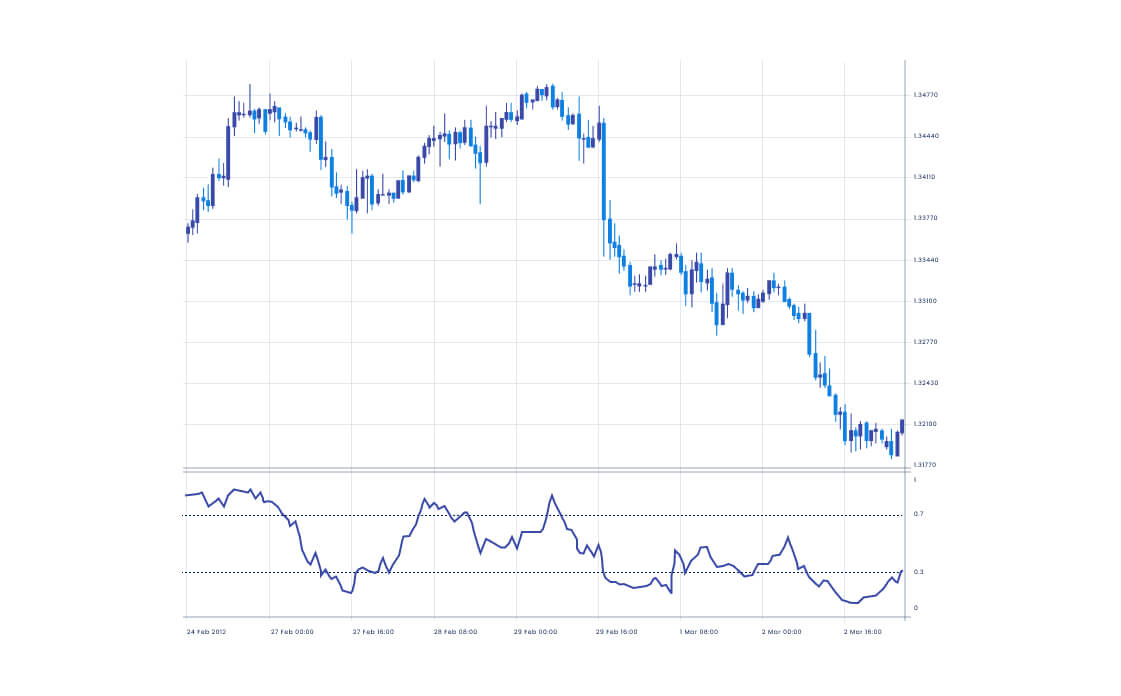
7. DeMarker Indicator
The DeMarker indicator is technical analysis tool that predicts short-term price action based on the price changes in the daily highs and lows. It fluctuates between the range of 0 to 1, with values above 0.7 indicating overbought conditions and values below 0.3 indicating oversold conditions.
Here is a step-by-step guide to use the DeMarker Indicator on the MT4 platform:
- Access the indicator from the list of custom indicators.
- Once the DeMarker Indicator is added to the chart, traders can use it to analyze price movements and make trading decisions.
- When the indicator reaches the overbought level and starts to move lower, traders may consider trading the currency pair. Similarly, when the indicator reaches the oversold level and starts to move higher, traders may consider trading the currency pair.
One of the benefits of using the DeMarker Indicator in MT4 is that it can be used in conjunction with other technical analysis tools. For example, traders may also use moving averages, Bollinger Bands, or other indicators to confirm signals generated by the DeMarker Indicator.
This is an example only to enhance a consumer's understanding of the strategy being described above and is not to be taken as Blueberry providing personal advice.
This graph has been recreated from the original source. Please note this image is a representation only and is not provided as general or personal advice.
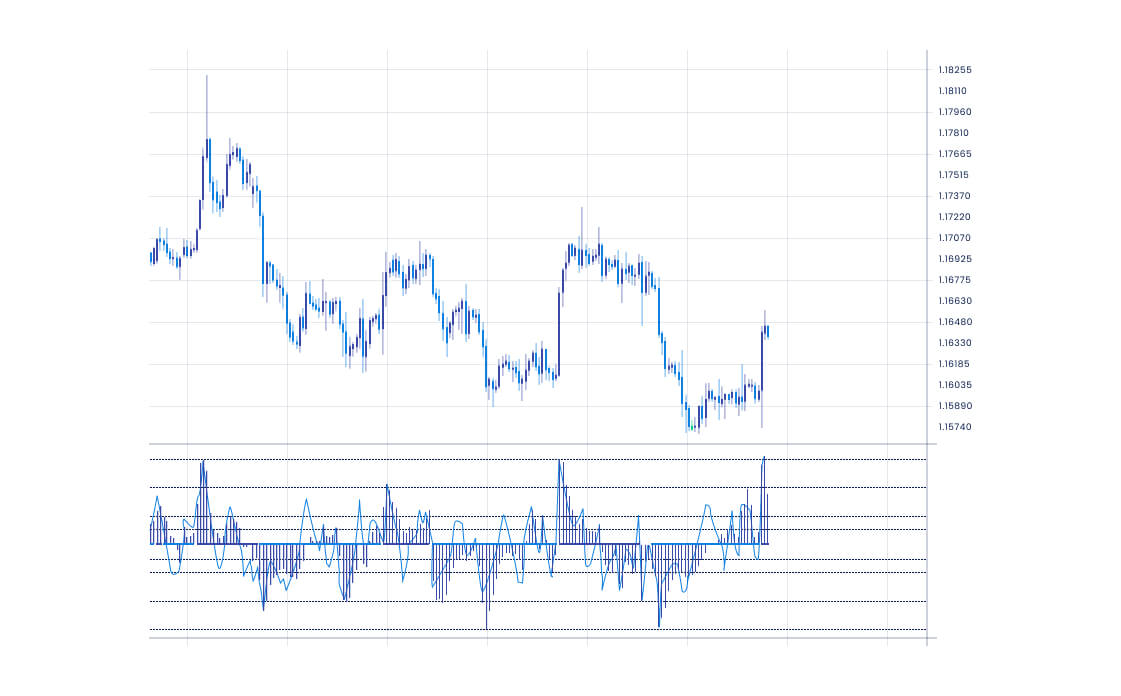
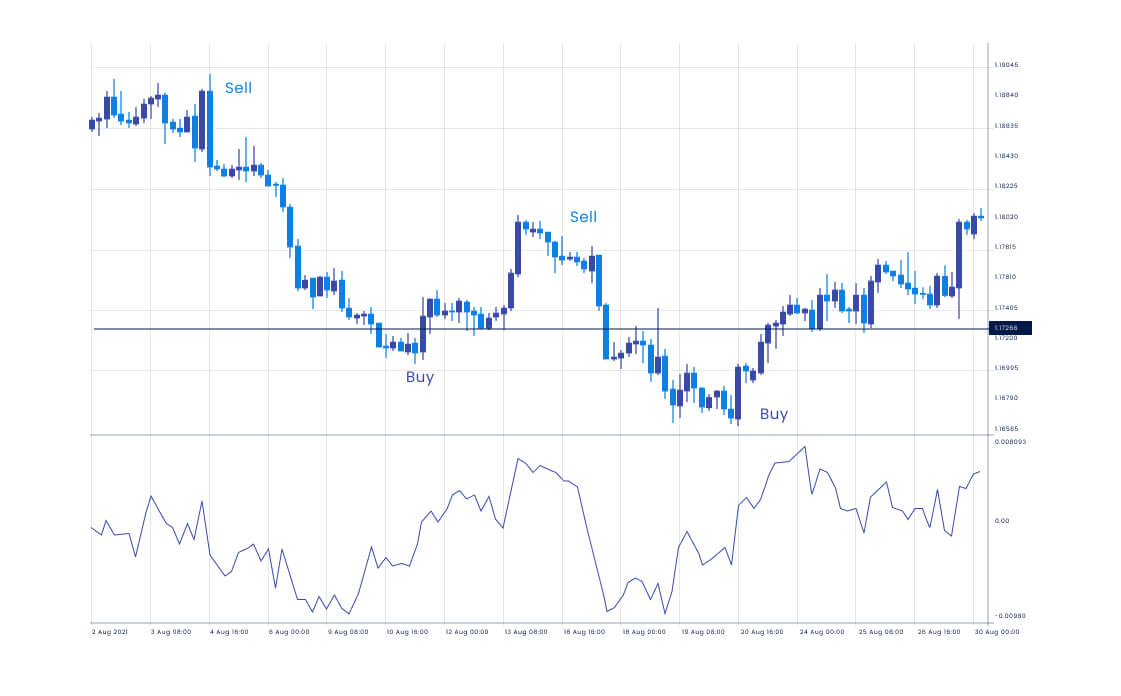
8. Rate of Change Indicator
The Rate of Change (ROC) indicator on the MT4 platform provides a visual representation of the currency pair's historical and current rate of change in prices. The ROC indicator is plotted as a line on a separate chart beneath the main price chart on MT4.
It oscillates around the zero level and helps traders identify trends and potential reversals by measuring the rate at which prices are changing. When prices rise, the ROC indicator is positive, indicating a strong momentum and the indicator is negative when prices fall, indicating a weak momentum.
Traders can customize the period, applied price, and level of the ROC indicator. To change the period, customers can input their desired value in the Period field. They can also adjust the applied price and level by selecting from the dropdown menus under Applied Price and Levels, respectively.
This graph has been recreated from the original source. Please note this image is a representation only and is not provided as general or personal advice.
9. Heikin Ashi
The Heikin Ashi indicator on MT4 is used to spot current market trends and/or predict future market price movement. In MT4 trading, the Heikin Ashi indicator can be used to identify trends.
When the Heikin Ashi chart shows a series of blue candles, this indicates an uptrend, while a series of red candles indicate a downtrend. Traders can use this information to enter trades in the direction of the trend, with the aim of benefitting from price movements.
Here is a step-by-step guide to use the Heikin Ashi indicator in MT4:
- Select Heikin Ashi from the list of available indicators on the platform.
- Once the indicator is added to the chart, traders can customize the settings to suit their needs. For example, they can adjust the colour and width of the candles, as well as the time frame that the indicator is based on.
This graph has been recreated from the original source. Please note this image is a representation only and is not provided as general or personal advice.
10. Force Index
The Force Index is a momentum indicator that measures the strength of price movements in the market. When the force index falls below zero, it indicates a market uptrend tendency and signals traders to place a trade order and vice versa. Additionally, the force index also indicates market continuation or bulls being in power when it reaches a new peak and vice versa.
The Force Index works the same way on MT4 as it does on other trading platforms.
- Click on Insert from the top menu and select Indicators from the drop-down menu.
- Scroll down to the Custom category and select Force Index.
- Set the parameters according to the trading preference, then click OK.
- The Force Index will now be displayed on the chart.
However, the key difference with using the Force Index on MT4 is that it is integrated into the platform's technical analysis tools. This means that traders can easily access the indicator and use it to analyze market momentum and identify potential trading opportunities without using external software or applications.
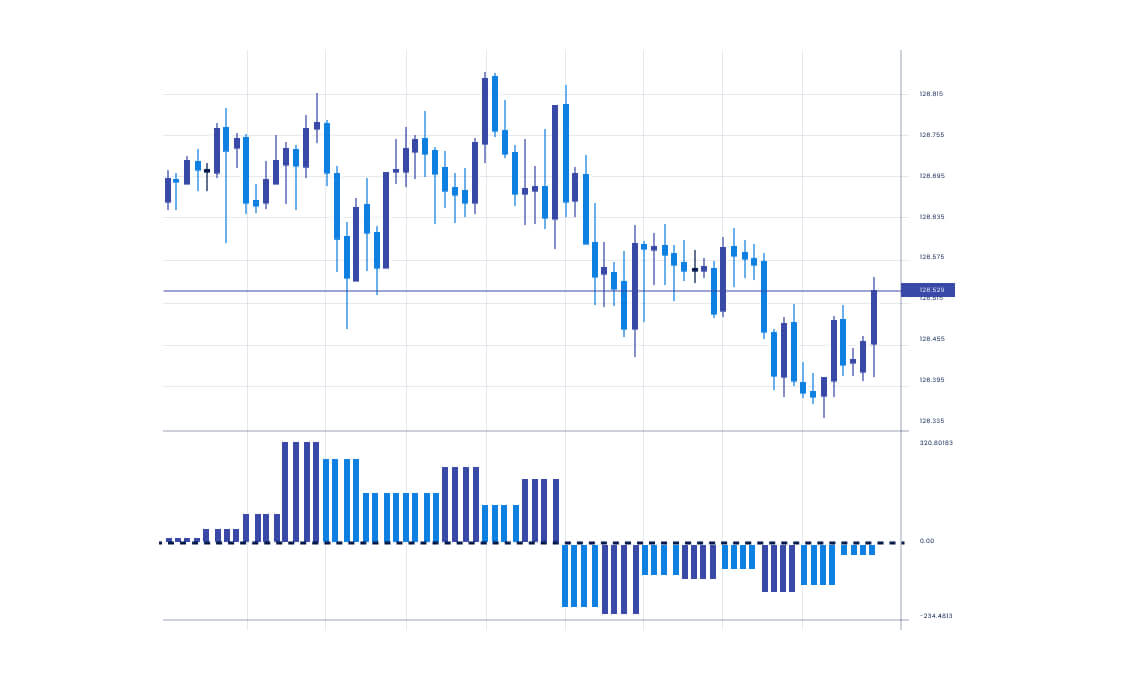
This graph has been recreated from the original source. Please note this image is a representation only and is not provided as general or personal advice.
Upgrade the forex trading strategy with these essential MT4 indicators
MT4 indicators for technical analysis can be a powerful set of tools in a trader’s arsenal to help make informed decisions in the forex market. Each indicator has its unique strengths and weaknesses, and traders should choose the ones that best suit their trading style and preferences.
Disclaimer: All material published on our website is intended for informational purposes only and should not be considered personal advice or recommendation. As margin FX/CFDs are highly leveraged products, your gains and losses are magnified, and you could lose substantially more than your initial deposit. Investing in margin FX/CFDs does not give you any entitlements or rights to the underlying assets (e.g. the right to receive dividend payments). CFDs carry a high risk of investment loss.