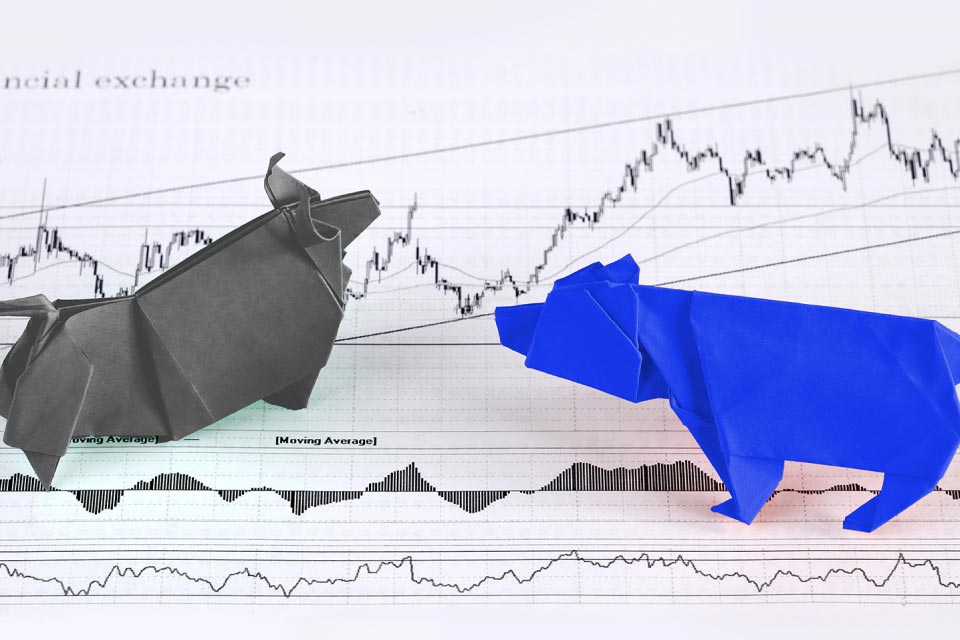
Bullish and bearish divergences enable you to trade market reversals. The most significant advantage of trading divergences is that they provide you with trading signals before the price trend changes, giving you ample time to alter trades if needed. Let's take a look at everything you need to know to trade bullish and bearish divergences.
What is divergence?
Divergence refers to a situation when a currency pair price diverges from the trend that the technical indicators are showing. So if the technical indicators are making a lower high but the currency pair price witnesses a higher high, it indicates that there is a price divergence in the market.
What is a bullish divergence?
In a bullish divergence, the currency pair prices make a new low in the market, but the technical indicators mark a higher price. This signals that bears in the market are no more in control, and bulls are getting stronger, indicating a bullish reversal after the downtrend ends. At this point, traders can place long orders to benefit from the increasing market prices.
What is a bearish divergence?
In a bearish divergence, the currency pair prices make a new high in the market, but technical indicators mark a lower price. This signals that bulls in the market are no more in control and bears are getting stronger, indicating a bearish reversal after the uptrend ends. At this point, traders can place short orders to benefit from the decreasing market prices.
What is a hidden divergence?
In a hidden divergence, a technical indicator reaches a higher high or low price level, but the currency pair price action does not. Occurring in an ongoing trend indicates that the existing trend is still strong and will continue instead of reversing.
- When a hidden divergence occurs during an existing uptrend, it signals to place long orders due to the expected uptrend continuation.
- When a hidden divergence occurs during an existing downtrend, it signals to place short orders due to the expected downtrend continuation.
How to trade divergence in forex
- Identify the existing trend in the market.
- Draw support and resistance lines to spot the divergence and confirm the reversing or continuation signals.
- Monitor the high and low price levels in the market during the particular time period.
- After sitting the divergence, understand what it is indicating to place long or short orders accordingly.
- Wait for your trading strategy to provide you with an entry signal before placing an order.
- You can trade regular divergences by spotting them in markets making higher highs (or higher lows) but the technical indicator marking a lower high (lower low). At this point, place a short (or long) order to trade the expected downtrend (or uptrend) reversal.
- You can trade hidden divergences by spotting them in markets marking higher lows (or lower highs) but the indicator marking lower lows (or higher highs) simultaneously. This sends a market continuation signal to the traders and indicates to them to enter a trade during an existing uptrend and exit a trade during a current downtrend.
Top divergence trading indicators
Moving Average Convergence Divergence
Moving Average Convergence Divergence (MACD) is a trend-following indicator that determines the relationship between a currency pair’s two moving averages. The indicator is used to identify bullish or bearish market sentiments and place entry or exit orders accordingly. MACD provides market divergences by forming highs and lows that diverge from the highs and lows of the currency pair’s price. When MACD forms two consecutive rising lows with corresponding two falling lows leads to a bullish divergence. Whereas the MACD forming two consecutive falling highs with corresponding two rising highs is a bearish divergence.
Stochastic
Stochastic is a momentum indicator that compares a currency pair’s closing price to a price range over a trading period to identify overbought and oversold market conditions. It provides divergences when it fails to move along with the currency pair’s price moves. The indicator fails to reach a new high when the currency pair price touches a new high and vice versa, indicating traders to enter or exit trades.
Relative Strength Index
The Relative Strength Index (RSI) is a momentum indicator that measures how fast and how much the currency pair’s price changes in a specific time period. It provides traders with overbought and oversold market conditions by providing values ranging from 0 to 100.
- A bullish divergence can be identified with RSI when the currency pair price makes higher lows, and RSI makes lower lows.
- A bearish divergence can be identified with RSI when the currency pair makes higher highs and RSI makes lower highs.
Trade the divergences and enter/exit markets at ideal price levels
Bullish and bearish divergences provide you with solid buy and sell signals right before the market reverses. With Blueberry online trading platform, you can use several divergence trading indicators and place successful trading orders. Sign up for a live trading account or try a demo account.


