


The Wyckoff Theory studies price movements through the lens of supply, demand, and institutional activity. Originally developed for stocks, it works seamlessly in forex trading by helping traders identify market phases.
By understanding these phases, forex traders can spot when big players are entering or exiting the market. In this article, we will learn about the Wyckoff theory in depth.
What is the Wyckoff theory?
Wyckoff Theory is a time-tested trading and market analysis method developed by Richard D. Wyckoff in the early 1900s. It focuses on understanding the market behavior of large institutions, often referred to as ‘smart money,’ by analyzing price action, volume, and market phases.
At its core, the Wyckoff Theory helps traders –
- Identify accumulation (where smart money is entering quietly)
- Spot distribution (where the smart money is exiting gradually)
- Understand trend cycles: accumulation, markup, distribution, and markdown
- Make informed entry and exit decisions based on supply and demand dynamics
Wyckoff introduced tools like the three laws (supply and demand, cause and effect, and effort vs. result) and a five-step method for reading the market like a professional.
Core principles of Wyckoff theory
1. Law of supply and demand
The first core principle of Wyckoff's Theory is the law of supply and demand. This principle states that prices move based on the imbalance between entry and exit pressure.
When demand exceeds supply, prices rise; when supply exceeds demand, prices fall. This foundational rule helps traders identify potential trend directions by observing price movement and volume relationships.
2. Law of cause and effect
The second principle is the law of cause and effect, which explains that the market does not move randomly. A period of preparation, such as accumulation or distribution, sets the stage for the next move, which is markup or markdown.
For instance, a longer accumulation phase leads to a stronger upward move. This concept helps traders set realistic price targets by analyzing the length and strength of the buildup.
3. Law of effort vs. result
The third principle is the law of effort vs. result. This law compares the trading volume (effort) to the actual price movement (result). If there is heavy volume but little movement, it may indicate absorption or exhaustion.
On the other hand, a significant price move on low volume could suggest a lack of conviction or false breakout. This principle allows traders to detect hidden shifts in market sentiment.
4. Five-step market approach
Wyckoff also proposed a five-step market approach –
- Determine the market trend: Analyze whether the market is in an uptrend, downtrend, or moving sideways. This gives traders a directional bias and helps filter trades accordingly
- Identify the market phase: Recognize which part of the Wyckoff cycle the market is in (accumulation, markup, distribution, or markdown). This reveals whether big players are entering or exiting positions
- Analyze price and volume behavior: Study the strength or weakness in the market using volume and price action. Look for signs of institutional activity such as absorption, shakeouts, or low-volume rallies
- Select assets in sync with the trend: Choose stocks, forex pairs, or cryptos that are aligned with the broader market direction. This increases the odds of accuracy by trading with the prevailing flow
- Time the entry using Wyckoff events: Enter trades based on specific Wyckoff signals like springs, upthrusts, or confirmed breakouts. These can help traders identify potential moves and manage positions more effectively.
Understanding market phases in Wyckoff theory
The Wyckoff theory divides the market into four key phases that repeat in cycles – accumulation, markup, distribution, and markdown. Each phase reflects the actions of institutional traders (smart money) and may help traders understand possible market setups.
-
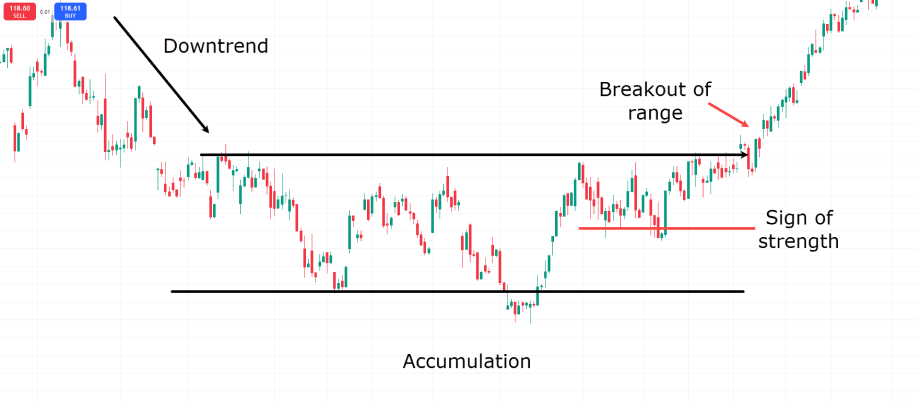
The accumulation phase occurs after a downtrend, where large players quietly long assets at low prices without causing major price spikes. This phase is often marked by sideways movement, with increasing volume near support levels. Once accumulation is complete, the market enters the markup phase, where prices rise. Breakouts, higher highs, and increased participation characterize this stage. It's often the most gainful phase for trend traders.
-
The distribution phase is where smart money starts offloading its holdings to retail traders. The price typically moves sideways again but with signs of weakening demand and frequent upthrusts or fake breakouts. After distribution, the market transitions into the markdown phase, where prices decline rapidly. This stage represents the exit of institutional players and the start of a downtrend.
How to identify accumulation and distribution phases with the Wyckoff theory?
Accumulation phase
1. Occurs after a downtrend
The accumulation phase begins when a downtrend loses momentum. Price movement slows and enters a sideways range, suggesting that exit pressure is weakening.
2. Range-bound price structure
Price moves within a horizontal channel. This range is not random; it's where institutional players quietly absorb large positions without causing noticeable price spikes.
3. Volume behavior
Volume increases near the lows, showing entry interest. There's usually a Selling Climax (SC) followed by an Automatic Rally (AR) and a Secondary Test (ST) to confirm demand.
4. Key Wyckoff event - the spring
A false breakdown below the support of the range (spring) often occurs. This traps breakout bears before the price reverses sharply upwards. The spring is a strong entry signal for long trades.
5. Breakout and transition to markup
Once accumulation is complete, the price breaks above resistance with strong volume. This signals the start of the markup phase, confirming the end of accumulation.
Distribution phase
1. Occurs after an uptrend
The distribution phase starts when a strong uptrend begins to stall. Price moves sideways, showing that big players are offloading their positions to retail traders.
2. Sideways price action with weakening momentum
Price forms a horizontal range near the top of the trend. There's no new higher high, and the market starts showing signs of fatigue.
3. Volume shifts to the downside
Exit volume begins to rise, especially on down bars. Upward moves are weaker and often occur at lower volumes, which indicates hidden exit pressure.
4. Key Wyckoff event - the upthrust
A false breakout above resistance (upthrust) is common. It traps breakout bulls, giving institutions a chance to exit at high prices before the market turns.
5. Breakdown and transition to markdown
Once the distribution is over, the price breaks down below support with strong volume, marking the start of the markdown phase, where downtrend momentum resumes.
Phases within accumulation and distribution in Wyckoff theory
Phases within accumulation
Phase A: Stopping the downtrend
In the first phase, the downtrend begins to lose strength. Large volume appears as bears capitulate, leading to a Selling Climax (SC). Afterward, a swift upward move called an Automatic Rally (AR) takes place. The range between SC and AR sets the preliminary boundaries of accumulation.
Phase B: Building the cause
Institutions start accumulating positions quietly. Price moves sideways, bouncing between support and resistance. Volume remains relatively less volatile. This phase is often choppy and can last a while, as smart money absorbs supply without revealing its intentions.
Phase C: The spring (final test)
This is a crucial turning point. Price often breaks below the support briefly in a move called a spring (a false breakdown meant to trap bears). This shakeout removes weak hands and provides strong entries for professionals. If the spring holds, confidence in the reversal builds.
Phase D: Confirmation of strength
Price rallies strongly after the spring and begins to form higher highs and higher lows. In this phase, volume picks up. The market now shows visible strength, indicating demand is overcoming supply. Traders often enter here after the spring confirms with a breakout.
Phase E: The markup phase begins
Accumulation ends as the price breaks out of the trading range. The markup phase begins with strong, trending price action and higher volume. This is where the bulk of retail traders start noticing the move, but smart money has already entered earlier.
Phases within distribution
Phase A: Stopping the uptrend
After a sustained rally, entry pressure starts to decline. A Buying Climax (BC) occurs, followed by a sharp pullback known as the Automatic Reaction (AR). These mark the early signs of distribution and set the trading range's top and bottom.
Phase B: Building the cause
Institutions begin distributing their holdings. Price continues to range, but rallies are weaker. Volume increases on down moves, and strength appears to fade. The uptrend stalls as smart money exits gradually without causing panic.
Phase C: The upthrust (final trap)
This phase includes a deceptive Upthrust (UT) (a false breakout above resistance). It lures breakout bulls just before the price reverses. Like the spring in accumulation, the upthrust is a smart money trap to offload remaining positions at high prices.
Phase D: Confirmation of weakness
Price begins to show lower highs and increased downside momentum. Bears dominate the market, and any bounce is met with stronger rejection. Volume supports the down move, confirming that distribution is complete.
Phase E: The markdown phase begins
Distribution ends with a decisive breakdown below the range. The markdown phase follows, marked by a downtrend, panic exit, and low-quality rallies. This is when the majority of retail traders begin to exit, often too late.
Top strategies to use with the Wyckoff theory
Sign of Strength (SOS) entry during phase D
The SOS strategy aims to ride the early momentum once accumulation ends. A breakout above resistance with strong volume signals strength.
Once accumulation is complete, the price shows a Sign of Strength (SOS), which is a breakout above resistance on strong volume. This is often interpreted as a sign of potential bullish control. Breakouts and the Last Point of Support (LPS), a small pullback that retests support, are sometimes monitored as potential entry zones by traders. This strategy is often linked to the start of a potential uptrend, but market conditions can still result in losses.
Shorting the breakdown after the Last Point of Supply (LPSY)
The strategy helps catch the start of a new downtrend after distribution. It targets the last failed rally before the sell-off begins.
In distribution, once an LPSY forms (a weak rally before breakdown), it signals smart money has exited. Price fails to reach previous highs and rolls over. Enter short after the breakdown below support or on the retest of the LPSY zone. This strategy focuses on identifying potential early momentum during the markdown phase.
Common mistakes when applying Wyckoff theory
- Misidentifying market phases: Many traders confuse accumulation with a range or distribution. They jump into trades too early, expecting a breakout. Without clear signs like springs, upthrusts, or volume shifts, it's easy to misread a phase and get trapped in sideways moves.
- Ignoring volume analysis: Volume is a core pillar of Wyckoff theory. Traders focusing only on price action miss critical supply and demand shift signals. For instance, a breakout without strong volume is often a trap, not a confirmation.
- Neglecting timeframes and context: Applying Wyckoff on the wrong timeframe can mislead traders. For example, a spring on a 5-minute chart might just be noise in the larger trend. Failing to align setups with higher timeframes and market context can result in mistimed entries and exits.
How to apply the Wyckoff theory in trading: a step-wise guide
1. Analyze the market trend
Traders begin by identifying whether the market is trending or ranging. Wyckoff works best during trend shifts or transitional phases.
2. Identify the market phase
They must label the market as accumulation, markup, distribution, or markdown using price patterns, volume behavior, and key Wyckoff signals.
3. Study price–volume interaction
Smart money leaves traces through volume. A breakout with strong volume signals intent, while low-volume moves often fake out traders.
4. Select assets aligned with the trend
Assets showing relative strength during accumulation or weakness during markdowns indicate institutional interest and offer high-probability setups.
5. Time entries using Wyckoff events
Entries are often identified during springs, tests, or upthrusts (usually in Phase C or D). These events should align with volume confirmation and structural shifts.
6. Manage risk and exit logically
Stop losses should be placed near structural invalidation points. Exits can be scaled out at key levels, with close attention to phase transitions.
Understand market psychology with Wyckoff
The Wyckoff theory offers insights into market structure and smart money behavior, which can help traders identify potential opportunities for entries and exits. However, its application requires patience, a deep understanding of volume-price relationships, and proper chart reading. Misinterpreting phases or forcing patterns can lead to false signals and missed opportunities.
Disclaimer: All material published on our website is intended for informational purposes only and should not be considered personal advice or recommendation. As margin FX/CFDs are highly leveraged products, your gains and losses are magnified, and you could lose substantially more than your initial deposit. Investing in margin FX/CFDs does not give you any entitlements or rights to the underlying assets (e.g. the right to receive dividend payments). CFDs carry a high risk of investment loss.