


Traders can use the Aroon indicator to assess trend strength, identify potential reversals, and make informed entry/exit decisions. Its simplicity, adaptability to various timeframes, and ability to signal shifts in market sentiment make it a valuable tool for gauging and navigating price trends in financial markets.
Let's take a deep dive to understand everything about the Aroon indicator.
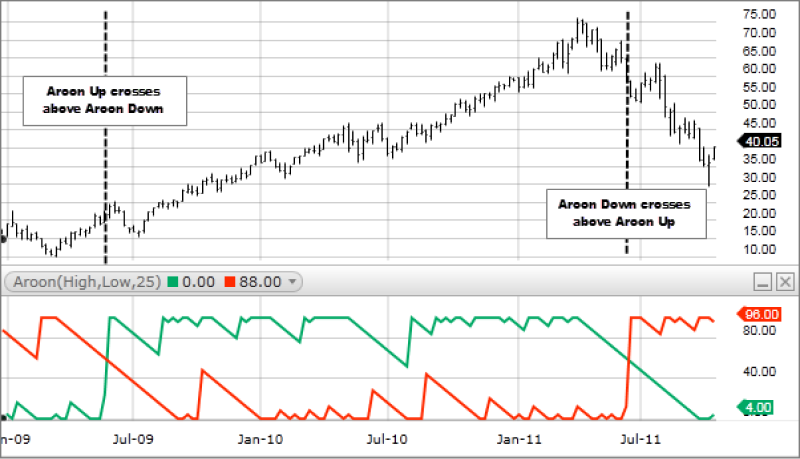
What is the Aroon indicator?
The Aroon indicator is a technical analysis indicator that helps traders and investors identify trends and potential trend reversals in the price of a financial instrument.
The Aroon indicator consists of two lines: Aroon-Up and Aroon-Down.
These lines measure the number of periods since the highest (Aroon-Up) and lowest (Aroon-Down) closing prices within a given time frame. The Aroon-Up line shows the strength of the uptrend, while the Aroon-Down line shows the strength of the downtrend.
Traders often use the intersection of these two lines to generate signals. For example:
- When Aroon-Up crosses above Aroon-Down, it may indicate the beginning of an uptrend.
- When Aroon-Down crosses above Aroon-Up, it may suggest the start of a downtrend.
*This is an example only to enhance a consumer's understanding of the strategy being described above and is not to be taken as Blueberry Markets providing personal advice.
Additionally, the Aroon indicator may be used to identify periods of consolidation or ranging markets when both Aroon-Up and Aroon-Down are close to 50.
Advantages and risks of the Aroon indicator
Advantages
- Trend strength and direction: Aroon helps traders assess the strength and direction of a trend by indicating the time elapsed since the most recent highest and lowest closes.
- Early trend reversal signals: The Aroon indicator can provide early signals of potential trend reversals. Crossovers between Aroon-Up and Aroon-Down lines may indicate shifts in market momentum, offering traders the opportunity to enter or exit positions ahead of more evident trend changes.
- Suitability for different timeframes: The Aroon indicator is versatile and can be applied to various timeframes, making it suitable for short-term and long-term traders.
Risks
- Whipsaws in choppy markets: The Aroon indicator may produce false signals or whipsaws in choppy or sideways markets, where crossovers occur frequently without a sustained trend. This can lead to inaccurate trading signals and potential losses.
- Dependence on historical data: The Aroon indicator relies on historical price data, which may not be as responsive to sudden market changes or events. Traders should be aware that delayed signals could result in missed opportunities or late entries.
- Limited effectiveness in sideways trends: Aroon is most effective in identifying trends, but its performance may be limited in markets with prolonged sideways movements. During periods of consolidation, the indicator may generate unclear or conflicting signals, reducing its reliability.
How to trade forex with the Aroon indicator?
Selecting a currency pair and timeframe
The trader chooses a specific currency pair and selects a timeframe for trading. The Aroon indicator is applied to various timeframes, aligning with the trader's strategy and preferences.
Adding the Aroon indicator to the chart
The trader opens the trading platform and adds the Aroon indicator to the chart. The desired period (number of periods) for the Aroon calculations is set.
Identify trend strength and direction
Look for situations where the Aroon-Up line is above the Aroon-Down line to indicate an uptrend or vice versa for a downtrend. The higher the Aroon-Up, the stronger the uptrend (suitable for placing long orders), and the higher the Aroon-Down, the stronger the downtrend (suitable for placing short orders).
Incorporate crossovers to identify trend reversals
If the current trend seems weak, monitor crossovers between the Aroon-Up and Aroon-Down lines. A crossover where Aroon-Up crosses above Aroon-Down may signal the start of an uptrend, while a crossover where Aroon-Down crosses above Aroon-Up may signal the beginning of a downtrend. These crossovers can be potential entry points for long and short orders.
Confirm signals with price action
Then, confirm Aroon signals with other technical analysis tools and price action. Look for supporting evidence, such as breakouts, candlestick patterns, or other trend-confirming indicators, to increase the reliability of the trade signals.
Consider trend duration
Assess the duration of the current trend by evaluating how far the Aroon-Up or Aroon-Down lines are from 100. A high Aroon-Up indicates a strong uptrend, and a high Aroon-Down indicates a strong downtrend. This information can help traders gauge whether a trend will continue or potentially lose strength.
Adjusting position size
The trader can determine the appropriate position size based on the risk management strategy and the trading account size. The goal is to avoid risking more than a predetermined percentage of the capital on a single trade.
Set stop-loss levels
Implement risk management by setting stop-loss orders to limit potential losses. Use technical analysis and support/resistance levels to determine appropriate levels for these orders.
Executing the trade
Once the trader confirms the analysis and sets the parameters, the trading platform executes the trade. Market conditions are closely monitored, especially if there are upcoming economic events or news releases.
Tips to trade with the Aroon indicator
Avoid trading in choppy markets
Be cautious when trading with the Aroon indicator in sideways or choppy markets. The Aroon may produce false signals in such conditions. It's often more effective in trending markets.
Adjust parameters for optimal performance
Experiment with different settings for the Aroon indicator, such as the number of periods used in calculations, to find the parameters that work right for the currency pair and time frame one is trading.
Be mindful of the divergences
Be alert to divergences (opposite movements) between price action and the Aroon indicator. Divergence occurs when the price trend and the Aroon trend move in opposite directions, suggesting a potential weakening of the current trend and placing an order in the opposite direction.
Identifying trend strength through the Aroon indicator
The Aroon indicator is a versatile and straightforward tool for assessing trends and potential reversals in forex trading. However, it's crucial for traders to remember that no single indicator guarantees success in the markets. Traders should use it with other tools to enhance accuracy and navigate market fluctuations effectively. Moreover, traders must remain vigilant about the risks involved, such as false signals in choppy markets and delayed responses to sudden market changes.
Disclaimer: All material published on our website is intended for informational purposes only and should not be considered personal advice or recommendation. As margin FX/CFDs are highly leveraged products, your gains and losses are magnified, and you could lose substantially more than your initial deposit. Investing in margin FX/CFDs does not give you any entitlements or rights to the underlying assets (e.g. the right to receive dividend payments). CFDs carry a high risk of investment loss.