


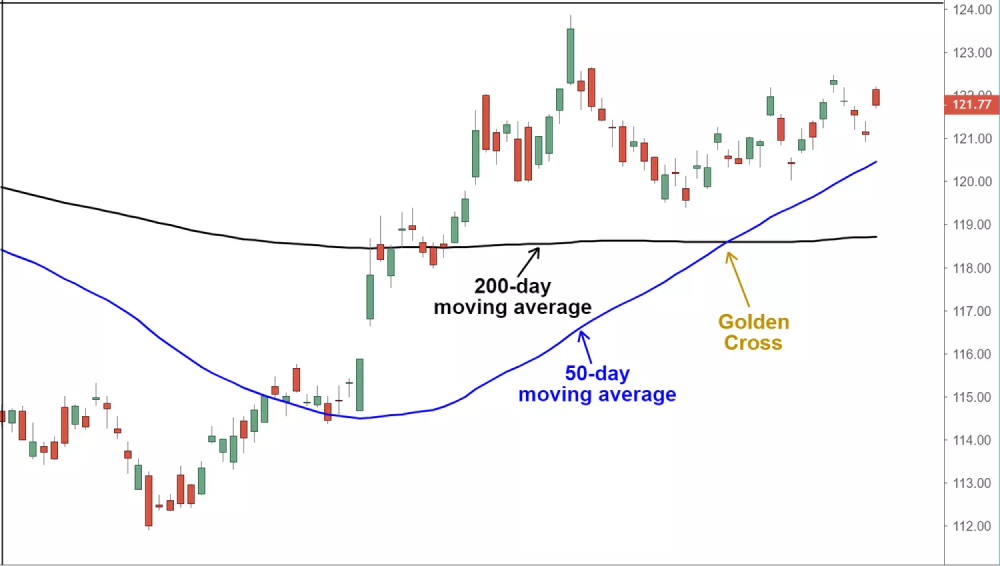
Ever wondered “What is a golden cross in trading”? Here’s the simple answer: it’s a bullish signal that helps identify potential trend reversal so you can spot entry and exit points. It appears when a shorter moving average rises above a longer moving average, usually the 50-day crossing above the 200-day. In forex, this crossover suggests downside momentum is fading and buyers are taking control. Traders use it for confirming shifts from bearish to bullish trends, reducing trading risks and capitalizing on market opportunities.
In golden cross trading, the shorter average reflects recent price acceleration, while the longer average represents the broader trend. When the fast line overtakes the slow line, it marks the handover from distribution to accumulation within the golden cross in technical analysis.
The following information is provided solely for educational purposes and does not constitute personal advice or a recommendation to trade margin FX/CFDs.
How does a golden cross form?
A classic golden cross has three clean stages. Think of it as “fade, flip, follow-through”:
-
The upward momentum: This stage starts with price action consolidating or even sharply turning higher after a prolonged period of declining prices. This initial change in price behavior indicates that the previous downtrend may be losing momentum and could be setting the stage for a potential trend reversal. During this stage, the 50-day simple moving average (SMA) remains below the 200-day SMA.
-
The golden cross: The 50-day SMA turns up and crosses above the 200-day SMA. That’s the golden cross. Many traders look for the close of the crossover day/period before acting. It is seen as a bullish signal and a trigger for potential entry points in the market. Traders and investors often interpret the golden cross as a sign that the shorter-term price trend is turning more positive.
-
Continued upward momentum, confirmation and follow-through: After the golden cross forms, price action typically continues to move higher, often creating a new uptrend. In this stage, the 50-day SMA may act as dynamic support for price action, providing a level of support as prices rise. Ideally, the price remains above the 50-day SMA for an extended period, confirming the strength of the new bullish trend and the formation of the golden cross. Confirmation can include:
-
Expanding range on up days.
-
Increased volume (where available).
-
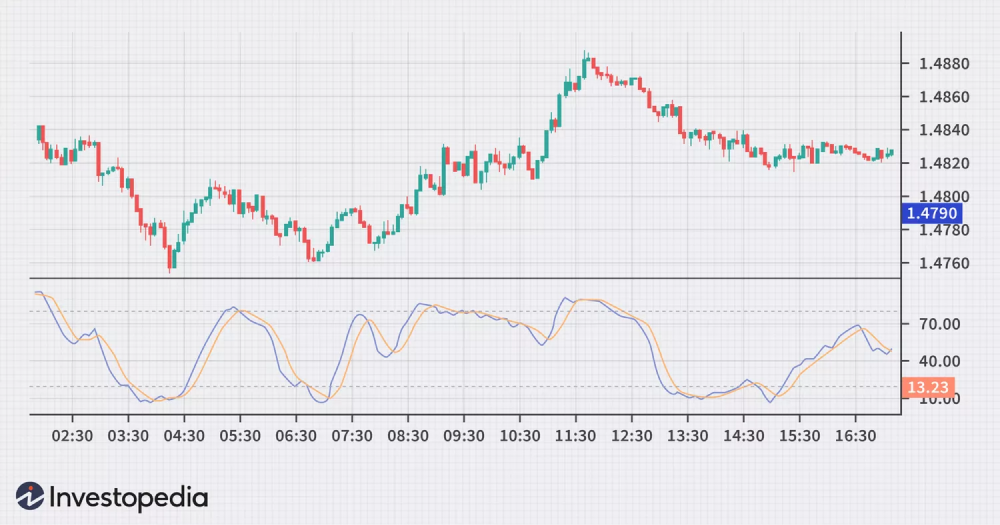
Momentum indicators (e.g. RSI > 50) turning up.
-
Retests of the 50-day as dynamic support.
-
Advantages and risks of a golden cross formation in forex
Advantages:
- Easy to interpret: One glance shows if the fast trend is overtaking the slow trend.
- Confirms long-term trends: A golden cross can help confirm the presence of a long-term trend, making it easier for traders to align their strategies with the prevailing market direction.
- Objective structure: Clear invalidation supports disciplined risk management.
- Helps in risk management: It can be used to set stop-loss levels more effectively by providing a clear signal to traders and assisting in risk management.
- Confirms reversal trends: In some cases, a golden cross may signify the reversal of a previous downtrend, allowing traders to capitalize on the potential early stages of a new uptrend.
- Gives back-testing potential: You can use historical data to back-test the effectiveness of the golden cross strategy, which should help refine your trading approach and gain confidence in its performance.
Risks:
- Gives false signals sometimes: Market conditions can change rapidly, leading to unexpected reversals or whipsaws (a quick and unexpected reversal in price, often leading to losses for traders who took positions based on previous signals).
- Lagging by design: Moving averages react to price; the initial leg may have already run when the cross appears.
- Leads to market noise: In volatile or ranging markets, golden crosses can generate noise and result in frequent, ineffective signals. It can be challenging to distinguish genuine crossovers from false ones.
- Results in subjectivity: Interpretation of golden crosses can be subjective, as traders may vary their criteria for confirming the signal. This subjectivity can lead to inconsistency in trading decisions.
- Clustering of resistance: A cross that occurs directly under multi-touch resistance may fail on the first attempt.
- Limited predictive power: While a golden cross can provide valuable information about past price movements, it has limited predictive power. It describes historical trends but does not promise future price behavior. Use additional indicators and analysis to enhance your decision-making.
Treat a golden cross as a trend-filter, not a standalone entry. Combine it with structure (swing highs/lows), level confluence and risk awareness.
Golden cross trading strategies
Here are some practical playbooks you can test and adapt:
1. Trend reversal (mean-reversion to trend)
A prolonged selloff stabilizes and prints higher lows before the cross fires. You join the emerging trend early, hopefully on the first constructive pullback.
- Entry: Wait for the cross, then buy a pullback to prior swing resistance turned support or the 50-SMA “first touch”.
- Stop: Below the pullback low (or 1.5–2.0× ATR under the trigger bar).
- Target: First partial at 1R or next swing high. Trail remainder below higher lows.
Example: EUR/USD bases after a multi-week decline. The 50-SMA crosses above the 200-SMA, price pulls back to the broken swing at 1.0950 and respects it.
2. 50 EMA carry (dynamic support)
Use an exponential moving average (EMA), as it’s more responsive than SMA, to ride the trend after the cross.
- Entry: After the golden cross, buy pullbacks into the 50-EMA on the execution timeframe.
- Stop: Below the 50-EMA and recent swing.
- Target: Scale out at structure levels. Continue to “carry” as long as candles close above the 50-EMA.
Example: GBP/USD crosses daily. On H4, price repeatedly respects the 50-EMA – giving you multiple continuation entries.
3. Pullback to 50-SMA
Use the 50-SMA as a “buy-the-dip” indicator once the cross has established trend bias.
- Entry: Limit order near 50-SMA with confirmation (rejection wick or bullish engulfing).
- Stop: Below the signal candle low.
- Target: Prior high. Extend if momentum expands.
4. Double-bottom confirmation
A double bottom signals exhaustion. Soon after, the golden cross confirms a trend shift.
- Entry: Break above the middle peak of the “W” (neckline) after the cross.
- Stop: Below the right-hand bottom.
- Target: Measure from neckline to bottom and project upward.
5. Breakout-retest
Limit the chance of false breakouts by requiring a retest and hold.
- Entry: Only after a decisive close above a key level (e.g. prior swing high) and a successful retest while the 50 remains above the 200.
- Stop: Below retest low.
- Target: Next resistance cluster. Trail under higher lows.
Top tip: Whatever your playbook, write it down. In golden cross trading, as with most trading strategies, consistency beats hero trades.
 How to trade forex with the golden cross?
A structured, step-by-step process keeps you objective:
- Identify the golden cross: The first step is to recognize when a golden cross occurs. This happens when the 50-day simple moving average (SMA) crosses above the 200-day SMA. It’s your primary signal for a potential trend reversal.
-
Map levels: Mark prior swing highs and lows, round numbers, and session highs. Build a “where could I be wrong?” plan.
-
Look for bullish reversal patterns: To confirm the signal and find setups for long downtrends, search for bullish reversal patterns such as three white soldiers or bullish flag patterns that align with the golden cross. These patterns can provide additional confidence in the trend change.
-
Confirm with volume: Pay attention to trading volume. An increase in trading volume when the golden cross occurs can be a strong confirmation of the trend reversal. Higher volume suggests increased market participation and conviction in the new trend.
-
Define your entry style:
-
Breakout close: Enter on a strong close above a recent swing;
-
Retest entry: Wait for a retest of the breakout or the 50-SMA/EMA;
-
Scaled entry: Split the position between breakout and retest to average risk.
-
Set entry points: Determine your entry and exit points based on your risk tolerance and trading strategy. The golden cross marks the entry, while stop-loss orders can help manage potential losses.
-
Set stop-loss: Set stop-loss orders to limit potential losses. These levels are determined based on your risk tolerance and market conditions.
-
Set targets and management:
-
Partial at 1R: Bank gains to reduce psychological pressure;
-
Measured move/next level: Use prior highs or projected moves;
-
Trailing exit: Trail below higher lows or use a short EMA; step aside on a bearish MA cross (fast under slow).
-
Review and refine: Record screenshots, entry/exit logic and outcomes. Data is your edge.
-
Monitoring and exit: Continuously monitor the market after entering a position. If the market conditions change and the bullish sentiment weakens, exit the long trade and enter a short trade. This could happen if the 50-day SMA crosses below the 200-day SMA, indicating a bearish signal.
Golden cross vs. death cross
A “death cross” is the bearish counterpart of the golden cross pattern. The fast MA crosses below the slow MA, signaling a potential trend deterioration.
|
Golden Cross |
Death Cross |
|
|
Defined by |
Fast MA crosses above slow MA. |
Fast MA crosses below slow MA. |
|
Typical pair |
50-day over 200-day. |
50-day under 200-day. |
|
Signal bias |
Bullish trend continuation/shift. |
Bearish trend continuation/shift. |
|
Context |
After basing or first higher low. |
After topping or first lower high. |
|
Risk focus |
Buying dips to 50-MA. Avoid chasing blow-offs. |
Selling rallies to 50-MA. Beware of short squeezes. |
|
Invalidation |
Fast MA rolling back under slow MA. |
Fast MA rolling back above slow MA. |
|
Best use |
Trend filter and structured entries. |
Trend filter and structured exits/shorts. |
Frequently asked questions
1. What is the difference between a golden cross and a death cross?
A golden cross occurs when the fast-moving average (e.g. 50-day) rises above the slow-moving average (e.g. 200-day), suggesting bullish conditions. A death cross is the opposite – fast below slow – and suggests bearish conditions.
2. Is the golden cross always a bullish signal?
It’s bullish by definition, but not always profitable. In ranges, crosses can whipsaw. Improve your odds by combining the cross with structure, momentum and volume cues.
3. How reliable is the golden cross as a trading indicator?
Reliability increases on higher timeframes and when the cross happens with supportive context (higher highs/lows, rising momentum). Still, it’s a lagging indicator – so use stops.
4. What are the best timeframes for spotting a golden cross?
Many traders prefer H4–Daily for signal quality. Intraday crosses on M15–H1 can be useful when they align with a higher-timeframe bullish bias.
5. Why are the 50-day and 200-day moving averages commonly used in a golden cross?
They combine the best of responsiveness and stability. The 50-day captures intermediate momentum, whereas the 200-day shows the broader trend. When used together, they give you a much more credible signal.
6. Is the golden cross a leading or lagging indicator?
It is a lagging indicator. Moving averages are pulled from past prices. Treat the cross as confirmation that conditions have changed, not as a prediction on its own.
7. Should I use SMA or EMA?
Both work. While SMA is smoother, EMA responds faster. Many people use SMA for the 200 (stability) and EMA for the 50 (responsiveness). Choose and test one rule-set and stay consistent.
Navigating the forex market with golden cross trading
The golden cross indicator may be advantageous as it can assist in risk management and potentially enhance trading strategies. However, it is not without risks as it may produce false signals and is subject to market volatility. Traders should combine it with sound analysis and risk mitigation techniques for a well-rounded approach.
Trade smarter with low spreads and lightning-fast executions. Open a live account today and experience unparalleled support from our dedicated customer service team. Blueberry is here to help every step of the way!
Disclaimer: All material published on our website is intended for informational purposes only and should not be considered personal advice or recommendation. As margin FX/CFDs are highly leveraged products, your gains and losses are magnified, and you could lose substantially more than your initial deposit. Investing in margin FX/CFDs does not give you any entitlements or rights to the underlying assets (e.g. the right to receive dividend payments). CFDs carry a high risk of investment loss.