


The three white soldiers pattern offers may suggest an early shift in market momentum, especially when supported by rising volume and key support levels. Including it in a trading strategy may draw attention to areas traders watch during potential market rebounds, which can be reviewed alongside other tools such as RSI or moving averages as part of broader analysis.
This article will cover the three white soldiers pattern in depth.
What is the three white soldiers pattern?
The three white soldiers candlestick pattern is a bullish reversal pattern that signals a shift in market sentiment from bearish to bullish may be inferred by this pattern, which features three consecutive long-bodied bullish candles, each closing higher than the previous one. These candles typically show small or minimal wicks, reflecting sustained upward movement during their respective sessions.
The pattern commonly appears after a downtrend or consolidation and is monitored by traders as a possible indication that buyers are becoming more active, depending on broader market context, though market conditions can vary. The three white soldiers pattern is often monitored by traders as a possible sign of shifting momentum or emerging bullish sentiment, though confirmation from other factors is recommended, mainly when supported by increased volume or technical indicators like RSI crossing above 50.
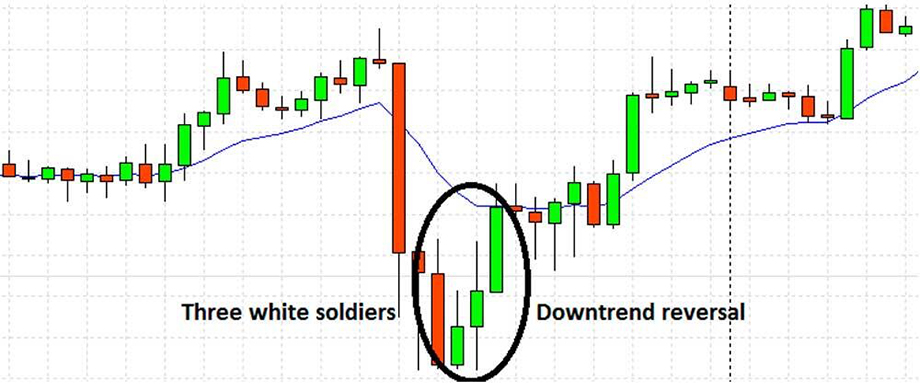
How to identify the three white soldiers candlestick pattern
The steps outlined below are for educational purposes only and should not be considered personal advice or a recommendation to trade margin FX/CFDs.
- Identify an existing downtrend: Begin by spotting a clear downtrend or a consolidation phase. The three white soldiers pattern appears at the end of bearish pressure, signaling a potential bullish reversal.
- Spot three consecutive bullish candles: Traders may look for three consecutive bullish candlesticks, with each candle opening near the previous candle’s body and closing higher. This reflects consistent upward movement during the period.
- Ensure each candle closes higher than the previous one: Each of the three candles must have progressively higher closes, suggesting that bullish activity remained present during the move.
- Check for small wicks or shadows: The candles should have neither upper nor lower wicks. This shows that bulls controlled the price throughout the session, with minimal pushback from bears.
- Confirm volume increase with each bullish candle: Rising volume on each bullish candle may help confirm the pattern's strength, though additional factors should be considered. It confirms genuine long pressure rather than a false breakout or weak reversal.
- Look for a pattern close to a support zone or reversal level: This pattern is more reliable when it forms near a key support level, demand zone, or Fibonacci retracement level, indicating that price may be showing early signs of a shift in direction.
- Ensure the candlestick pattern is not near resistance: Avoid trading the pattern if it appears close to a strong resistance zone, as the uptrend may face exit pressure and fail to sustain upward movement.
Example of three white soldiers pattern
Let's say the USD/JPY currency pair has been in a downtrend for several days due to weak US economic data. The price has reached a strong support level near 145.20, where shorting starts to slow.
A large bullish candle forms on the first day, signaling entry interest as it closes well above its open and breaks a minor resistance. On the second day, another bullish candle appears. It opens within the body of the first candle and closes even higher, reinforcing the shift in momentum toward the bulls.
On the third day, a third bullish candle forms, again opening within the previous candle's body and closing near its high. It reflects sustained upward movement and completes the three white soldiers formation.
This setup is often monitored by traders as a possible indication of shifting sentiment toward the upside, though it should always be assessed within the broader market context. When reviewed alongside tools such as RSI or volume trends, it may provide additional context on whether buying activity is increasing, but it does not confirm that the move will continue.
Technical indicators to use with the three white soldiers candlestick pattern
Bollinger bands
Bollinger bands may help show the strength of the three white soldiers. If the candles break above the upper band, it could indicate bullish momentum. However, if the move appears overextended beyond the bands, it may signal a short-term pullback before the uptrend resumes.
ATR (Average True Range)
ATR measures volatility. After spotting the three white soldiers, a rising ATR may suggest strong momentum, potentially suggesting a possible change in market direction. A low or falling ATR might indicate weakening strength, making it a less reliable setup for continuation without further confirmation from price action.
Stochastic oscillator
Stochastic helps identify whether the three white soldiers pattern is forming in an overbought zone. If the oscillator crosses above 20 from a lower range during the pattern, it may reflect increasing bullish activity. However, if it's already above 80, traders may wait for a pullback before entering long positions.
How to trade with the three white soldiers candlestick pattern
The steps outlined below are for educational purposes only and should not be considered personal advice or a recommendation to trade margin FX/CFDs.
Confirm an existing downtrend reversal
Begin by identifying a prior downtrend or consolidation phase. The three white soldiers pattern may reflect increasing bullish activity only when it appears after a clear downtrend. This context strengthens the reliability of the pattern.
Spot the three consecutive bullish candles
Look for three green (bullish) candlesticks appearing back-to-back. Each candle should open within or near the previous candle's body and close progressively higher, forming a clear upward staircase-like structure.
Ensure strong volume on the third candle
Volume should increase across the three candles, especially on the third one. Rising volume may indicate increased buying activity during the move, that bulls are committed, and that the uptrend has strong participation. Some traders view it as additional context when assessing the pattern, though it should not be considered a signal for entry on its own.
Watch for a slight pullback or consolidation
After the pattern forms, wait for a small pullback or sideways movement. This consolidation allows the market to absorb gains, and after the pattern forms, some traders observe whether the price pauses, pulls back slightly, or moves sideways. This consolidation can provide additional context on how the market is reacting to the move and may help traders assess the structure before making any decisions, reducing the risk of entering during an overextended move.
Some traders wait to see whether bullish momentum develops before making any decisions.
Enter the trade once the market resumes upward movement with a bullish candle breaking the consolidation. This confirmation avoids false breakouts and ensures the trader is trading with momentum.
Consider adding stop-loss below the third candle's low
Set the stop-loss just below the low of the third candlestick. This could help your trade in case the market turns and the pattern fails, limiting the downside risk.
Set a target based on previous resistance levels
Traders may use price history or Fibonacci levels to identify prior resistance zones, which can help manage expectations and inform potential target areas.
Is the three white soldiers' pattern reliable?
The three white soldiers pattern may offer a bullish reversal signal, particularly after a downtrend, though confirmation from additional analysis tools is recommended. However, like any pattern, the three white soldiers may produce false signals, particularly near resistance or in low-volume zones, making confirmation from additional indicators or analysis crucial.
Disclaimer: All material published on our website is intended for informational purposes only and should not be considered personal advice or recommendation. As margin FX/CFDs are highly leveraged products, your gains and losses are magnified, and you could lose substantially more than your initial deposit. Investing in margin FX/CFDs does not give you any entitlements or rights to the underlying assets (e.g. the right to receive dividend payments). CFDs carry a high risk of investment loss.