Candlestick patterns are widely used for technical analysis to make informed trading decisions, but these are not always fool-proof. Understanding the risks helps traders to avoid potential pitfalls.
This article discusses the risks associated with candlestick chart patterns.
What are candlestick chart patterns?
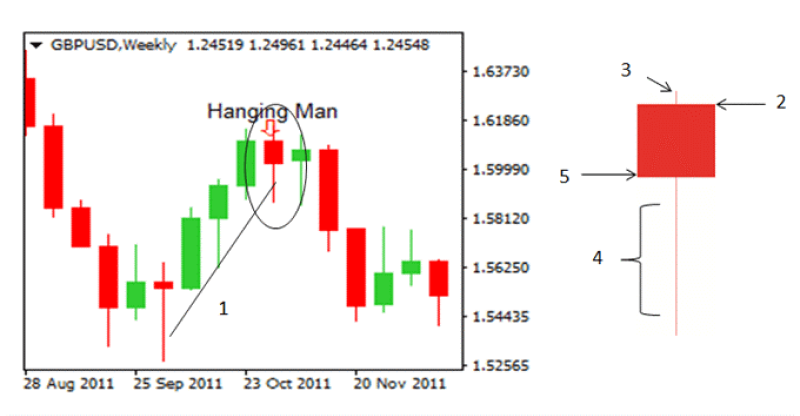
Candlestick chart patterns are visual representations of the price movements of assets. These patterns are formed by a series of candlesticks, each representing a specific time period (such as minutes, hours, or days). Each candlestick has a rectangular body and two wicks (or shadows) extending from the body.
- The body of a candlestick represents the price range between the opening and closing prices during the chosen time period.
If the closing price exceeds the opening price, the body is filled (colored) or outlined in green, indicating a bullish or positive sentiment. Conversely, if the closing price is lower than the opening price, the body is filled or outlined in red, signifying a bearish or negative sentiment.
- The wicks or shadows represent the high and low price points within the time period.
These patterns can be single candlestick formations or combinations of multiple candlesticks, which traders analyze to predict future price movements.
Common candlestick patterns include the Doji, Hammer, Shooting Star, Engulfing, and more. Each pattern's interpretation can provide insights into potential market reversals, continuations, or indecision.
Risks associated with candlestick chart patterns
Not traceable on every chart
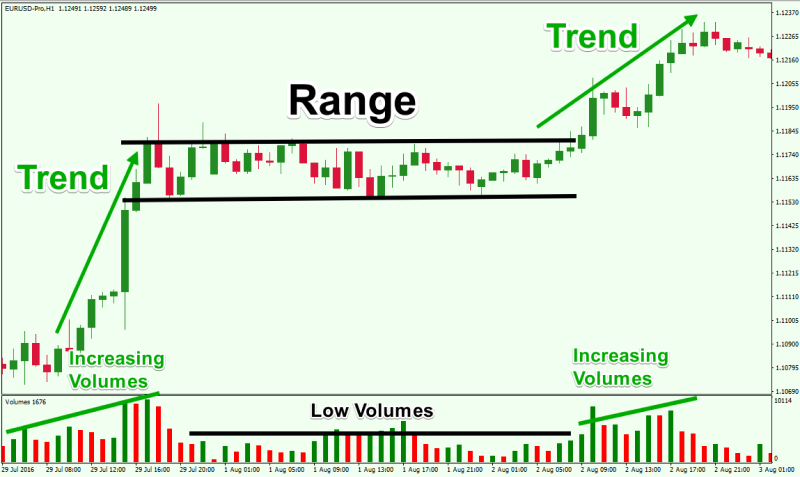
In forex, some currency pairs may experience extended periods of low volatility or consolidation. During these times, candlestick patterns may not form or appear less frequently. For instance, in a ranging market, one may encounter charts with scarce candlestick patterns, making it difficult to identify meaningful signals.
On the other hand, in a sideways-moving market, one may find that Doji candlestick patterns, which often indicate indecision or potential reversals, occur infrequently. Relying solely on such patterns in this market condition can lead to poor trading decisions.
Highly subjective in nature
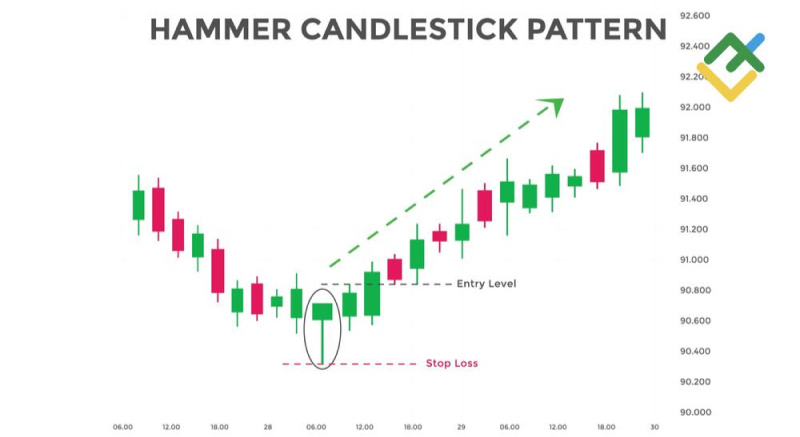
Candlestick pattern interpretation can vary from trader to trader, leading to inconsistencies in trading strategies. Traders often have different views on the significance of a particular pattern based on their experience and preferences. For example, a trader with a bullish bias might see a Hammer candlestick as a strong signal for a potential uptrend, while a bearish trader may view it as a weak reversal signal. This subjectivity can result in traders making contrasting decisions based on the same candlestick pattern.
Requires confirmation trend
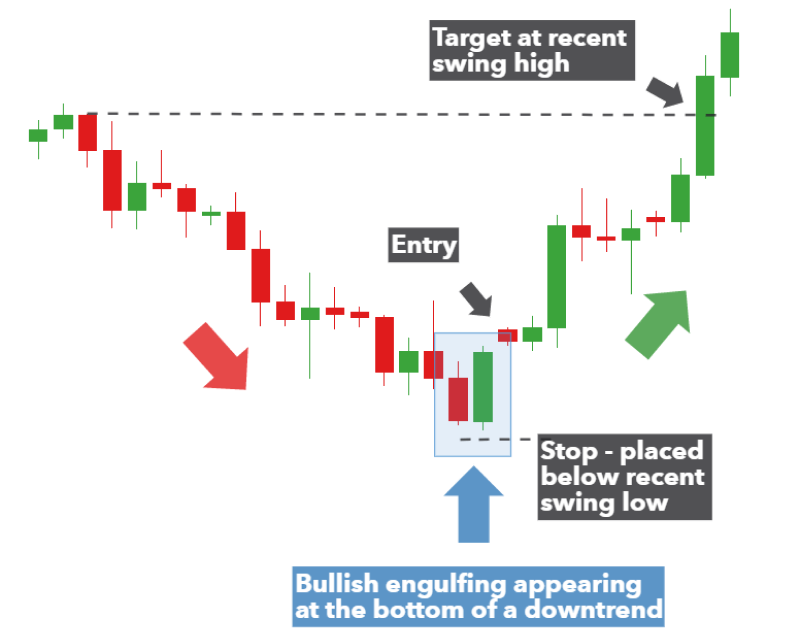
Candlestick patterns alone may not provide enough information for a reliable trading decision. For instance, if one spots a Bullish Engulfing pattern (a potential bullish reversal) on a forex chart, looking for additional confirmatory factors is crucial.
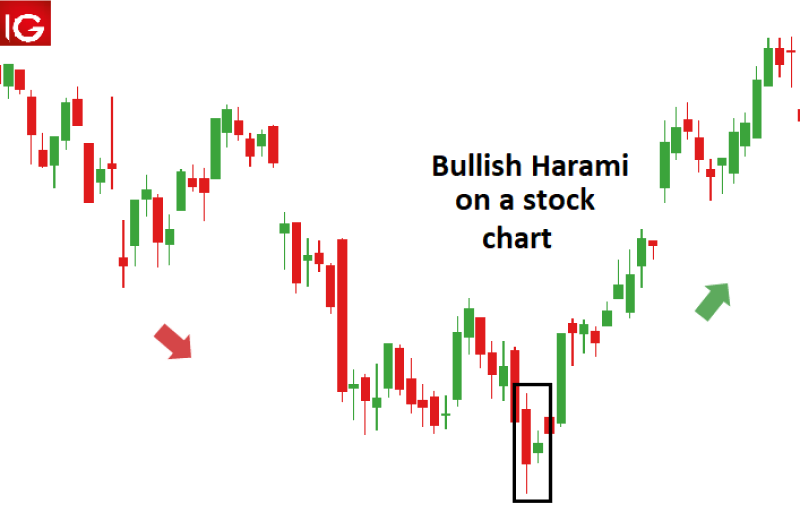
This might include checking if the pattern occurs near a significant support level or if momentum indicators like the Relative Strength Index (RSI) also indicate bullish momentum. On the other hand, if one identifies a Bullish Harami pattern (a potential bullish reversal) in a forex pair but does not confirm the pattern through confirming factors such as the price bouncing off a major support level or a shift in the RSI from oversold territory, the trade might lack the necessary confirmation, leading to losses.
No post-reversal indication
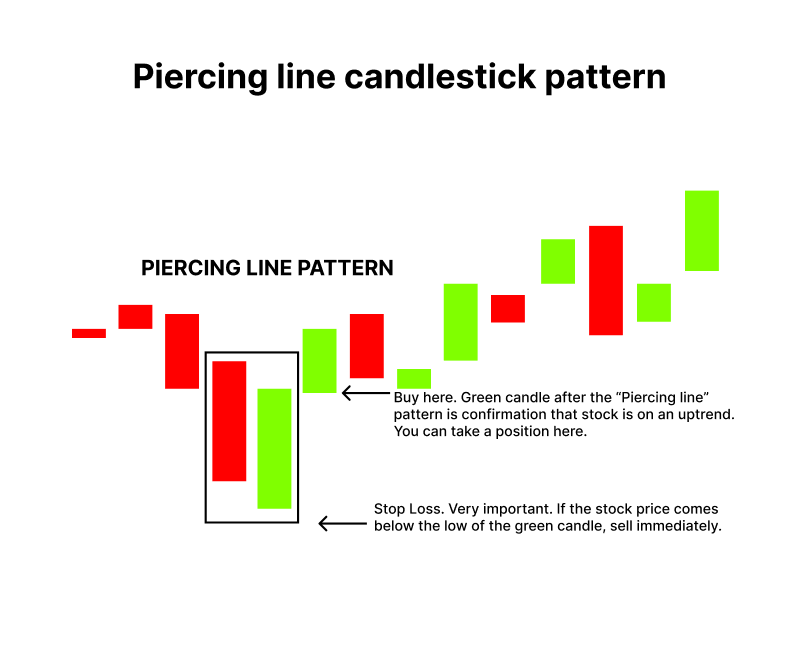
Candlestick patterns indicate a change in market sentiment but do not specify the magnitude of price movement that follows. For instance, a Bullish Piercing pattern (a bullish reversal) might lead to a minor price uptick or a significant trend reversal, depending on various factors like market conditions and news events. After spotting a Bullish Piercing pattern, the trader enters a long trade, expecting a substantial price increase. However, due to external factors or market sentiment, the price only experiences a modest uptick before reversing again, causing potential losses.
Gives false signals at times
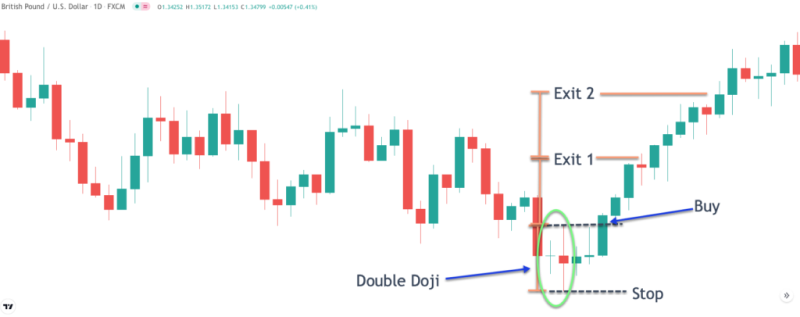
Candlestick patterns are not infallible and can produce false signals. A Doji candlestick, for instance, often indicates indecision, but it does not promise a reversal. Relying solely on these patterns without considering other factors can lead to misguided trades.
Let us suppose that a trader notices a Doji candlestick after a prolonged uptrend in a currency pair and interprets it as a potential reversal signal to short a trade. However, the market sentiment remains bullish, and the price continues to rise, leading to a loss in the short position.
Limited to price data
Candlestick patterns focus solely on historical price movements and do not consider fundamental factors that impact currency values, such as economic data releases, geopolitical events, or central bank policies. Ignoring these factors can result in missed opportunities or unexpected losses.
Consider an example where a trader identifies a Bullish Harami pattern in a currency pair, indicating a potential reversal. However, a significant economic announcement is scheduled for the next day, which could strongly affect the currency's value. Failing to consider this fundamental event might lead to unfavorable trading outcomes.
Looks different on different time frames
The same candlestick pattern can appear differently in various time frames, making it important to consider the context.
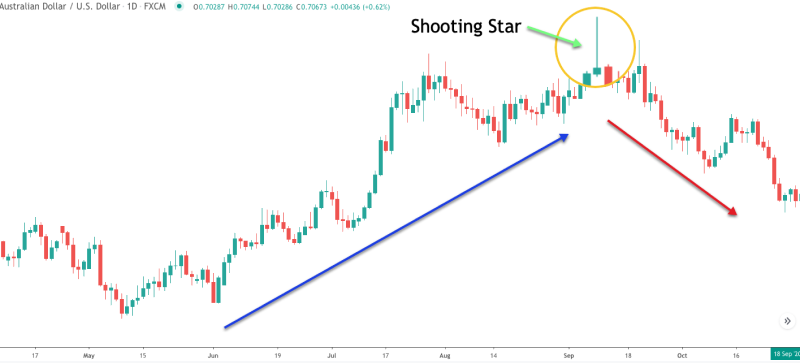
For instance, let’s say a trader observes a Shooting Star pattern on a 1-hour forex chart and interprets it as a bearish reversal signal. However, when they switch to a daily chart, they realize that the long-term trend is still bullish, and the pattern on the 1-hour chart was just a minor pullback, causing confusion and potentially leading to a loss if they enter a short position prematurely.
Navigating the risks of forex candlestick patterns
Candlestick patterns in forex offer visual insights for trading decisions but involve subjectivity and the risk of false signals. Traders can integrate them with other tools, enhancing strategies.
However, these patterns do not accurately predict the size or duration of price moves. Therefore, traders should use them cautiously, considering confirmation and other factors to manage risks effectively.
Disclaimer: All material published on our website is intended for informational purposes only and should not be considered personal advice or recommendation. As margin FX/CFDs are highly leveraged products, your gains and losses are magnified, and you could lose substantially more than your initial deposit. Investing in margin FX/CFDs does not give you any entitlements or rights to the underlying assets (e.g. the right to receive dividend payments). CFDs carry a high risk of investment loss.


