


Pin bar candlesticks may indicate areas where price reaction is occurring. Characterized by a small body and a long wick, pin bars highlight price rejection. When used at key levels, they may be used by traders to help identify possible entry and exit considerations.
In this article, we will discuss everything about pin bar candlesticks.
What is a pin bar candlestick?
A pin bar candlestick is a type of price action pattern that indicates a possible shift in price direction, depending on broader market context. It is characterized by a small body and a long tail (wick) on one side, either the top or the bottom, which indicates a rejection of a price level. The long wick shows that the price moved far in one direction but then reversed, closing near the opposite end of the body. Some types of pin bar candlesticks are:
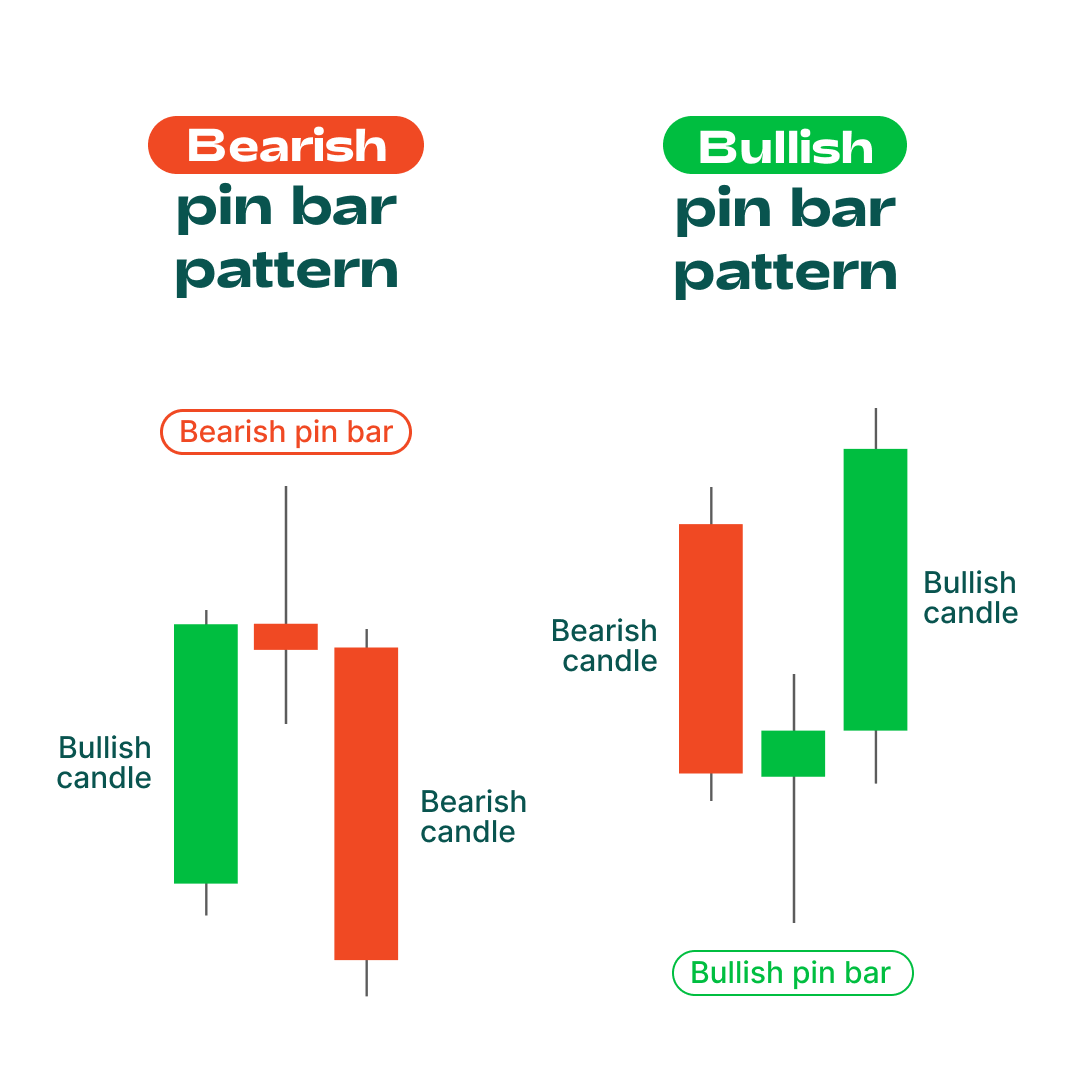
- Bullish pin bar: A reversal pattern with a long lower wick and a small body at the top can be a sign of buying interest emerging after a prior decline, depending on overall market conditions.
- Bearish pin bar: A reversal pattern with a long upper wick and a small body at the bottom, may be viewed by some traders as reflecting selling pressure following a prior advance, depending on the broader market context.
- Inside pin bar: A pin bar whose body is entirely within the range of the previous candle, suggesting indecision or consolidation
- False pin bar: Appears as a valid reversal signal but fails to follow through, indicating the market might continue in the original direction
Characteristics of a pin bar
- Long tail or wick: Reflects a noticeable rejection of a particular price level within that trading period in one direction
- Small body: The opening and closing prices are close together
- Clear rejection of price: Shows that the market attempted to move in one direction but reversed
- Direction of the tail: The tail points in the direction of the price rejection (up for bearish, down for bullish)
- Closed near the open: The price closes close to where it opened, reinforcing the reversal signal
How to spot pin bars on the chart
- Identify the trend direction: Determine if the market is in an uptrend or downtrend. Pin bars are commonly observed after strong trends and are sometimes interpreted as possible signs of changing price momentum.
- Locate potential pin bar formations: Look for candlesticks with long wicks and small bodies, usually after a strong price move.
- Confirm the wick’s placement: Ensure the wick is long, at least twice the length of the body, and points in the direction where price rejection occurred.
- Ensure the body is at one end of the candle: The small body should be positioned near one end of the candlestick, either the top or bottom, showing that the price closed near its open.
- Check for strong price rejection: The long wick should reflect a significant move in one direction followed by a reversal, showing the market’s rejection of that price level.
- Look for confirmation from the next candlestick: Look for additional technical factors to assess whether the pin bar aligns with broader market conditions by seeing if the next candlestick moves in the expected direction (up for bullish, down for bearish).
- Analyze volume: Check if the volume is higher than usual, especially during the pin bar formation, as it can confirm the strength of the reversal.
Top trading strategies with the pin bar candlestick
Pin bar reversal at support/resistance
The pin bar reversal at support/resistance strategy involves spotting a pin bar at a key price level, such as support or resistance. A bullish pin bar at support or a bearish pin bar at resistance signals a potential reversal.
After confirming the pattern, some traders wait for the price to trade beyond the pin bar’s high or low before making a decision and use nearby levels as reference points.
Trend continuation with pin bar pullback
In a trending market, the trend-continuation approach using a pin bar pullback involves observing when a pin bar forms during a retracement within an existing trend. Some traders interpret this formation as a sign that the pullback may be losing momentum, while considering broader market context and risk factors.
After spotting the pin bar at a key level, like a moving average, enter above the high of a bullish pin bar or below the low of a bearish pin bar. Set the target at the next trend level.
Pin bar with breakout confirmation
The pin bar with the breakout confirmation strategy works well in consolidating markets. When a pin bar forms after a period of sideways price action, it signals a potential breakout.
A bullish pin bar followed by a breakout above its high suggests an upward move, while a bearish pin bar indicates a downward move. Enter the trade after the breakout, placing a stop-loss just beyond the pin bar. Target the next significant price level for the exit.
How to identify entry/exit points with pin bars
- Spot pin bar at key levels
Look for pin bars formed at significant support or resistance levels, trendlines, or moving averages, as these areas are more likely to experience reversals.
- Wait for a confirmation candle
Wait for the next candlestick to confirm the pin bar’s reversal signal. A strong close in the expected direction (up for bullish, down for bearish) strengthens the setup.
- Enter above/below pin bar high/low
Once the confirmation candle closes, enter the trade just above the high for bullish pin bars or just below the low for bearish pin bars.
- Place stop-loss beyond the pin bar’s opposite end
Set the stop-loss beyond the farthest point of the pin bar’s wick (below the low for bullish, above the high for bearish) to protect from false breakouts.
- Target the nearest support/resistance
Set the target at the nearest support or resistance level. This is an area where price has previously reacted, and some traders monitor it as a level that may attract renewed buying or selling interest.
- Ensure a favorable risk-to-reward ratio
Ensure the potential reward (from entry to target) is at least two times the risk (from entry to stop-loss), maintaining a favorable risk-to-reward ratio.
- Monitor for trend reversal/continuation
Keep an eye on price action after entry. A pin bar formation may be interpreted by some traders as suggesting a possible shift in market momentum, but it’s important to watch for continuation or consolidation before finalizing the exit.
Strategize forex trades with pin bars
Traders should ensure pin bars form at key support/resistance levels, confirm signals with the next candle, and use proper risk management. They should avoid trading pin bars in choppy markets and always consider the broader trend to provide additional confirmation before considering an entry.
Disclaimer: All material published on our website is intended for informational purposes only and should not be considered personal advice or recommendation. As margin FX/CFDs are highly leveraged products, your gains and losses are magnified, and you could lose substantially more than your initial deposit. Investing in margin FX/CFDs does not give you any entitlements or rights to the underlying assets (e.g. the right to receive dividend payments). CFDs carry a high risk of investment loss.