


Hidden divergence is a crucial concept in forex trading, revealing subtle shifts in market momentum that can influence trend continuation. The divergence serves as a confirmation tool for traders, enhancing their ability to make informed decisions within the broader scope of technical analysis and risk management strategies.
In this article, we will thoroughly discuss what a hidden divergence trading strategy is.
What is hidden divergence?
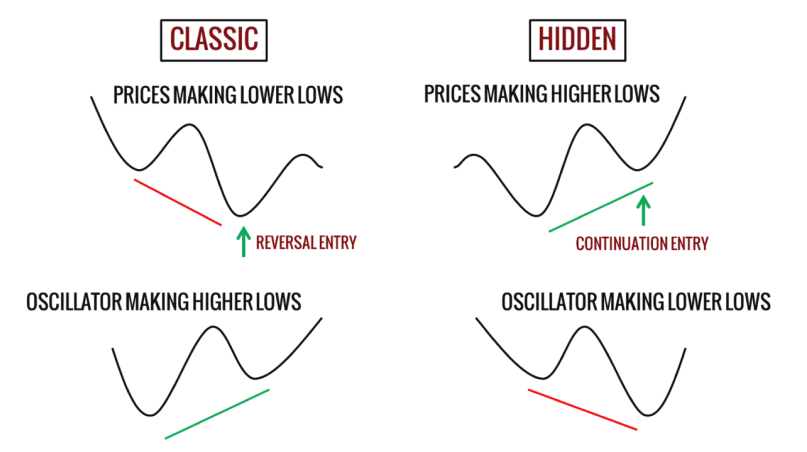
Hidden divergence is a type of technical analysis that identifies potential trend continuation or trend reversal in financial markets. It involves comparing price action with an oscillator, such as the Relative Strength Index (RSI), Moving Average Convergence Divergence (MACD), or Stochastic Oscillator. It occurs in a situation where the price and an oscillator indicator move in opposite directions, signaling that the prevailing trend is likely to continue.
There are two types of hidden divergences –
Bullish hidden divergence
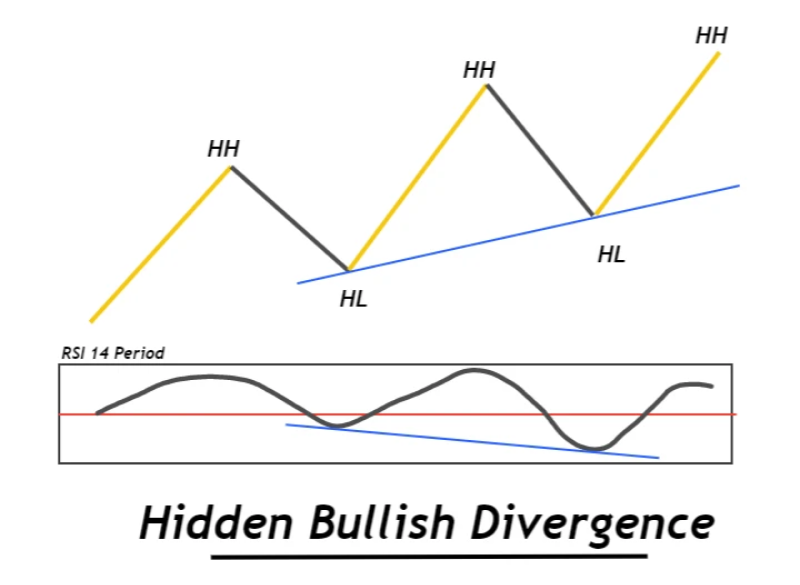
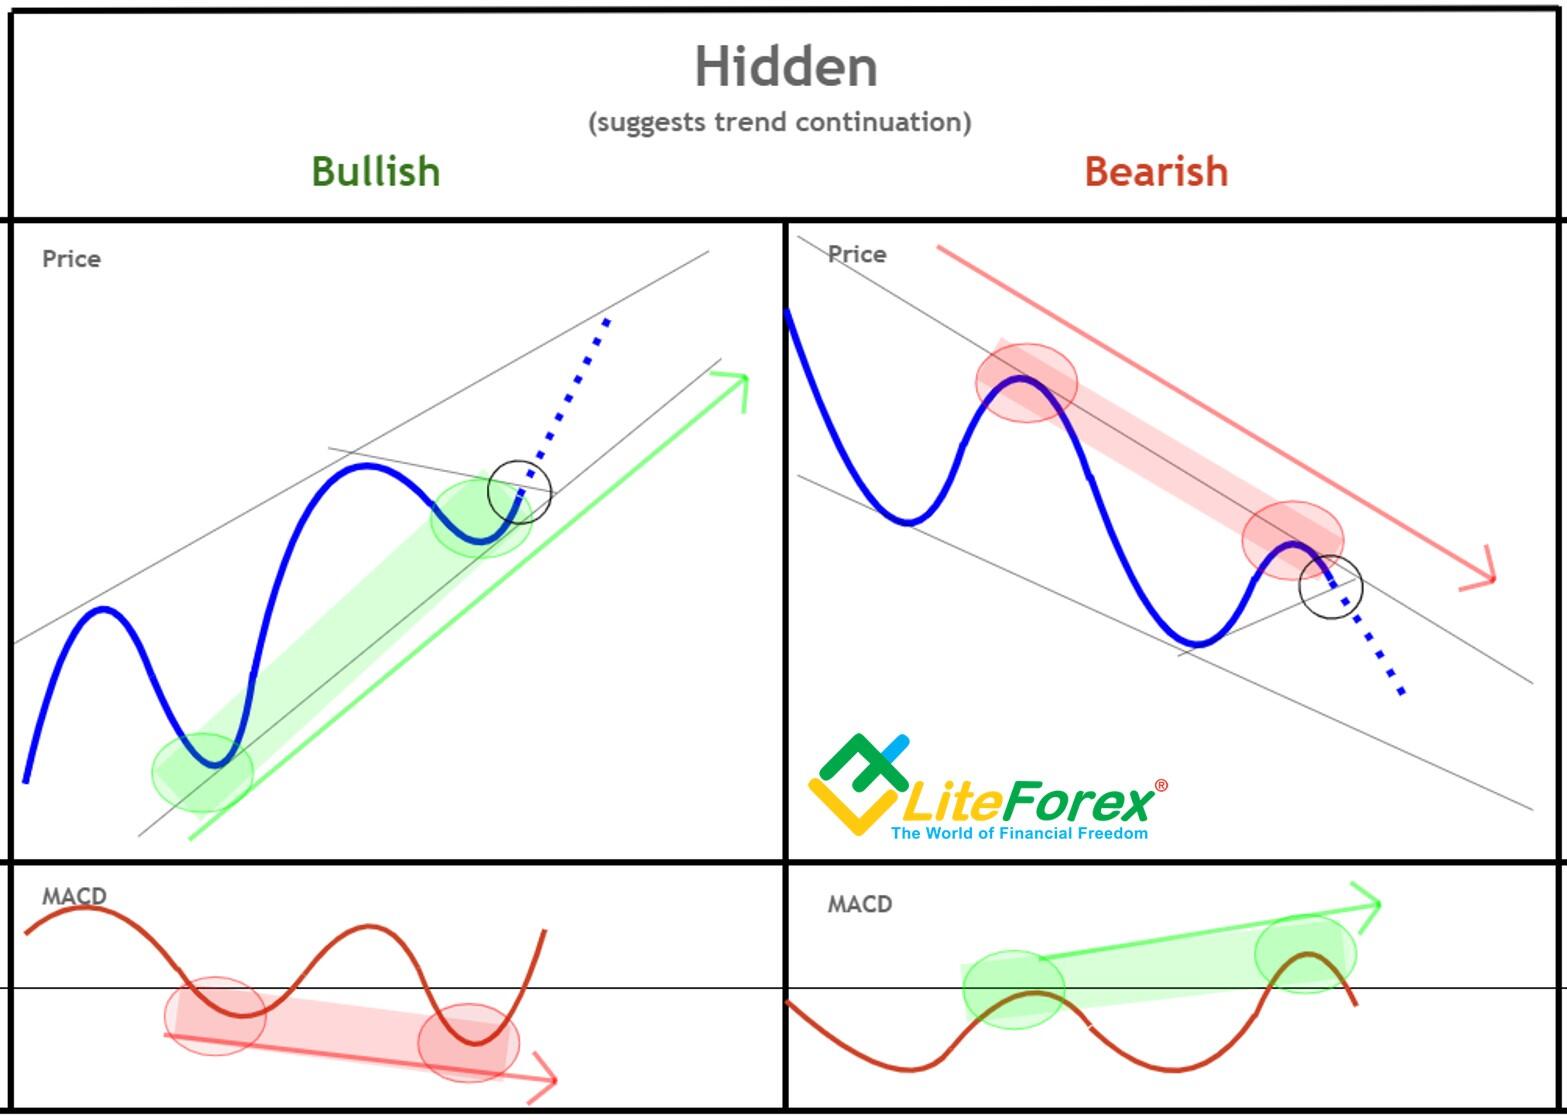
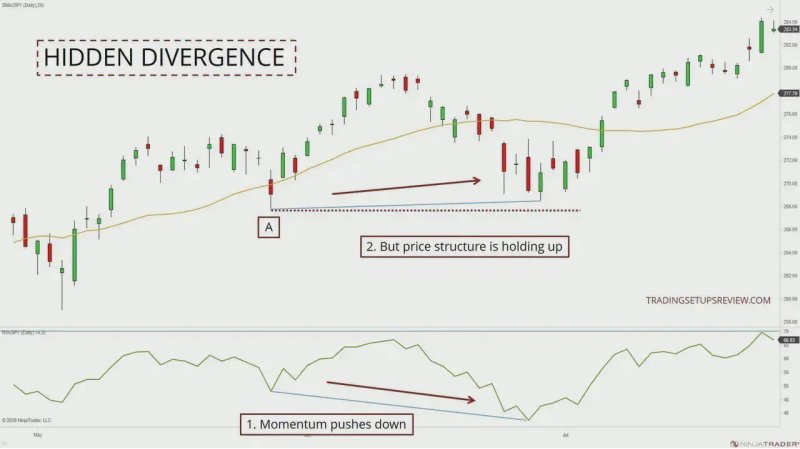
Bullish hidden divergence occurs within a downtrend, signaling a potential reversal or a weakening of the downward momentum. In this scenario, the price creates a lower low, indicating a new low point that surpasses the previous one. Simultaneously, the oscillator, such as the RSI or MACD, forms a higher low. This discrepancy between price action and the oscillator suggests that, despite the ongoing downtrend, the underlying momentum is shifting. Traders interpret this as a sign that the bears are losing strength, and a bullish reversal or a continuation of the trend to the upside may be in the offing, signaling them to place long orders.
Bearish hidden divergence
Bearish hidden divergence is observed within an uptrend, indicating a possible reversal or a weakening of the upward momentum. In this case, the price forms a higher high, surpassing the previous peak. Concurrently, the oscillator, such as the RSI or MACD, forms a lower high. This discrepancy signals that, even though the price is making new highs, the underlying momentum behind the uptrend is diminishing. Traders interpret bearish hidden divergence as a cautionary signal, suggesting that the bulls might be losing control, and a bearish reversal or a continuation of the downtrend could be on the horizon. It serves as a warning for traders involved in long positions and can be a prompt for considering potential exits, short trades, or adjustments to their trading strategy.
How to identify a hidden divergence on a price chart in forex?
Identify the trend
Determine the prevailing trend in the market, whether it is an uptrend or a downtrend. This can be done by observing the series of higher highs and higher lows in an uptrend or lower highs and lower lows in a downtrend.
Select an oscillator
Choose an oscillating indicator to use for identifying hidden divergence. Common oscillators include the Relative Strength Index (RSI), Moving Average Convergence Divergence (MACD), or Stochastic Oscillator.
Compare price action and oscillator
For bullish hidden divergence:
- Look for a lower low in the price chart.
- Simultaneously, check the oscillator to see if it forms a higher low.
- The divergence occurs when there is a discrepancy between the price and the oscillator.
For bearish hidden divergence:
- Identify a higher high in the price chart.
- Check the oscillator to see if it forms a lower high.
- The divergence occurs when there is a disagreement between the price and the oscillator.
Confirmation and caution
Use the identified hidden divergence as a signal, but be aware that it should not be considered in isolation. Confirm the signal with other technical analysis tools, such as trendlines, support, and resistance levels, and other indicators, to strengthen the analysis.
Trading decisions
- If a bullish hidden divergence is identified during a downtrend, traders may consider it a potential signal for a bullish reversal or continuation of an uptrend. This could be an opportunity for a long position.
- If a bearish hidden divergence is identified during an uptrend, it may be considered a warning sign of a potential bearish reversal or continuation of the downtrend. Traders might use this information to assess the risk and make decisions about existing long positions and entering short positions.
Note that this only provides insight into potential trend reversals or continuations of the strategy, and traders should exercise caution and consider market conditions and risk management.
Advantages and risks of the hidden divergence trading strategy
Advantages
- Early trend reversal identification: hidden divergence trading strategy provides a tool for identifying potential trend reversals early in the process, allowing traders to enter positions at the beginning of a new trend.
- Confirmation of existing trends: It helps confirm the strength of existing trends, providing traders with additional confidence in their analysis and aiding in decision-making.
- Clear entry and exit signals: hidden divergence signals can offer clear entry and exit points, making it easier for traders to plan and execute their trades with defined parameters.
- Versatility across timeframes: This strategy is versatile and can be applied across different timeframes, making it adaptable to various trading styles and preferences.
Risks
- False signals in ranging markets: hidden divergence signals may produce false indications during ranging or consolidating market conditions, leading to potentially incorrect trading decisions.
- Complex pattern recognition: Identifying hidden divergence patterns requires a certain level of skill and experience in technical analysis, and misinterpretation can lead to errors in trading decisions.
- Overemphasis on divergence signals: Relying solely on hidden divergence signals without considering other technical factors may lead to overemphasis and potentially overlooking crucial market information.
Top technical Indicators for hidden divergence trading
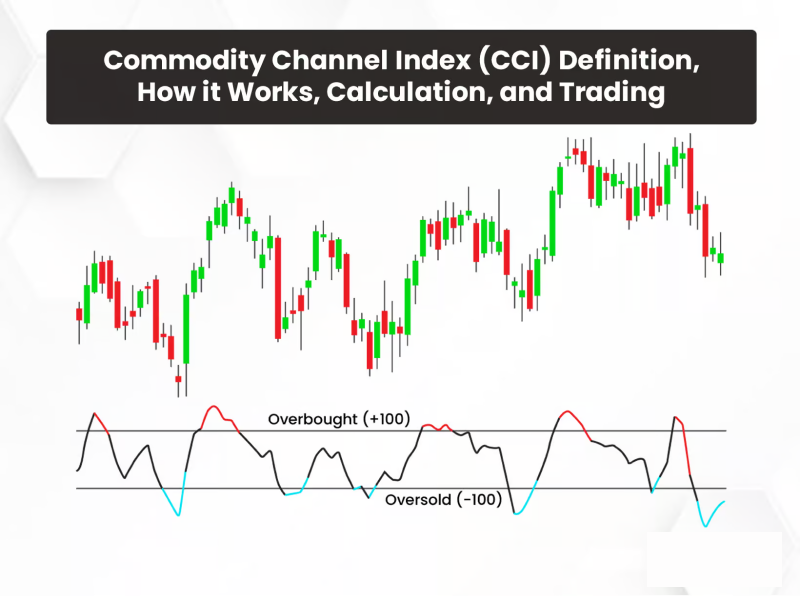
Commodity Channel Index (CCI)
The Commodity Channel Index (CCI) is a helpful indicator in hidden divergence trading due to its ability to measure an asset's price deviation from its statistical average. This measurement helps identify overbought or oversold market conditions. In hidden divergence trading, CCI divergence with the price can be a crucial signal for potential trend reversals. Traders often look for discrepancies between CCI movements and price action as early indications of hidden divergence, providing them with insights into potential shifts in market momentum.
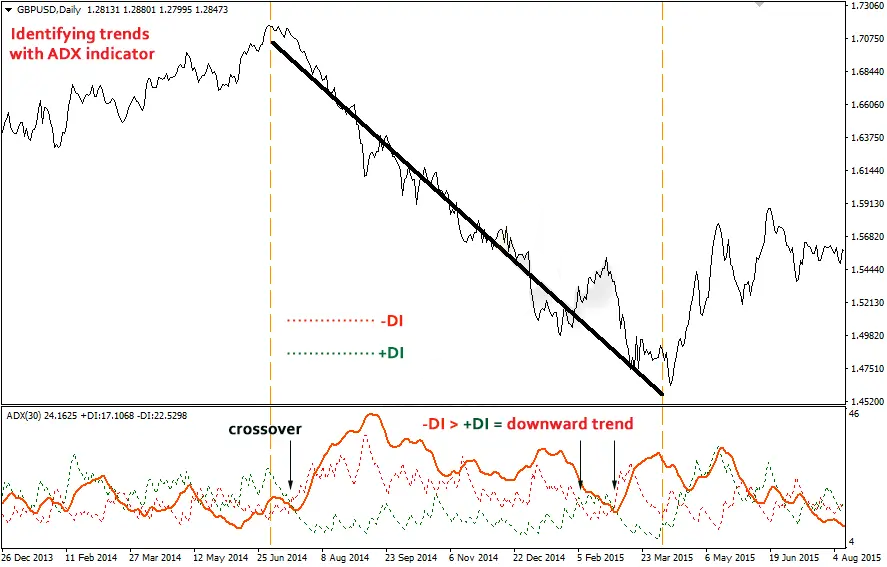
Average Directional Index (ADX)
The Average Directional Index (ADX) quantifies the strength of a trend. By distinguishing between trending and non-trending market conditions, ADX complements hidden divergence analysis by confirming the strength of identified trends. Traders can use ADX to validate hidden divergence signals, adding an additional layer of confirmation to their trading decisions. When hidden divergence is identified, the presence of a strong trend, as indicated by ADX, enhances the trader's confidence in the potential validity of the signal.
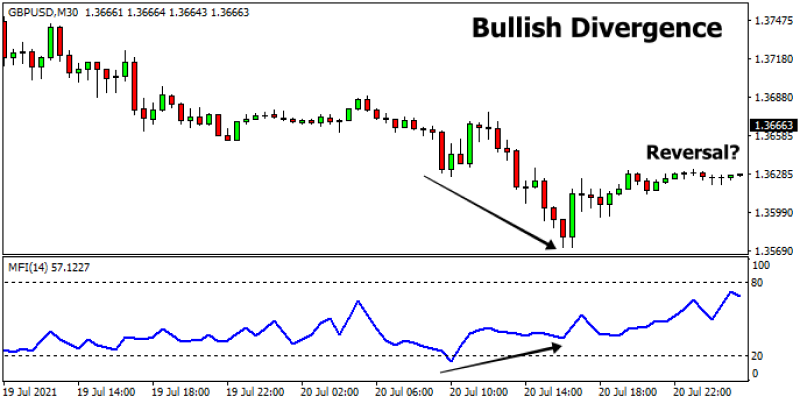
Money Flow Index (MFI)
The Money Flow Index (MFI) measures the flow of money into and out of an asset such as a currency pair. By providing insights into overbought or oversold conditions, MFI can act as a confirmation tool in hidden divergence analysis. Traders look for divergence between MFI and price action to identify potential trend reversals. When hidden divergence is observed alongside MFI divergence, it strengthens the trader's conviction in the likelihood of a significant market move, enhancing the overall effectiveness of the trading strategy.
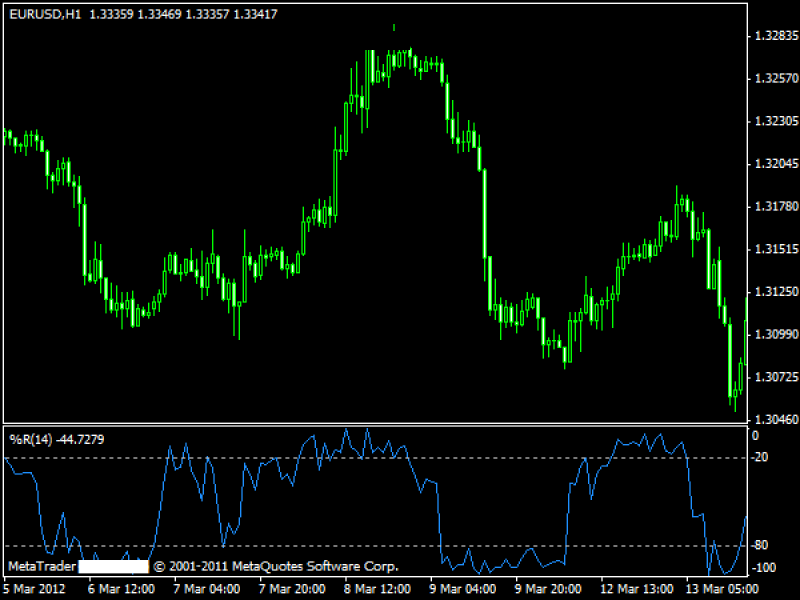
William's %R
William's %R is a momentum oscillator that plays a key role in hidden divergence trading as this indicator gauges overbought or oversold conditions by comparing the closing price to the high-low range. In hidden divergence analysis, traders closely observe William's %R for divergence with the price, seeking discrepancies that may signal potential trend reversals. Identifying hidden divergence through William's %R can serve as an early warning, enabling traders to anticipate and prepare for changes in market direction.
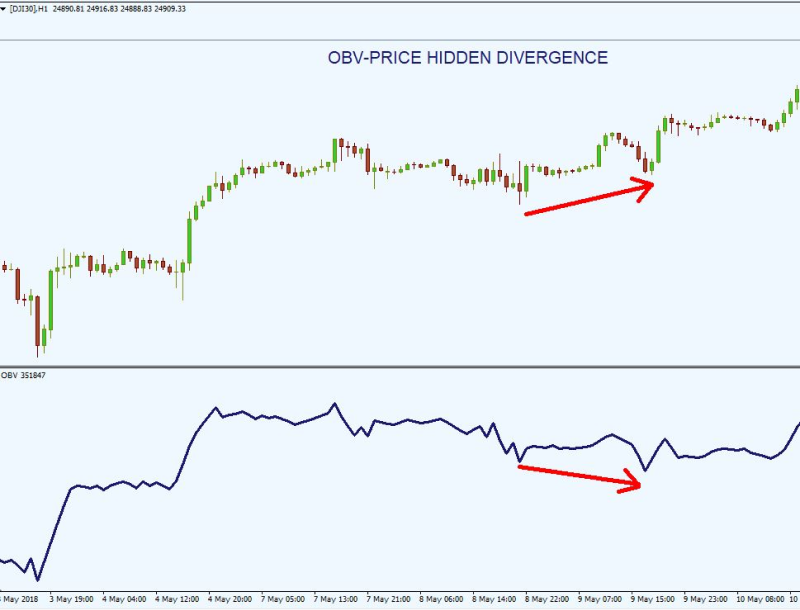
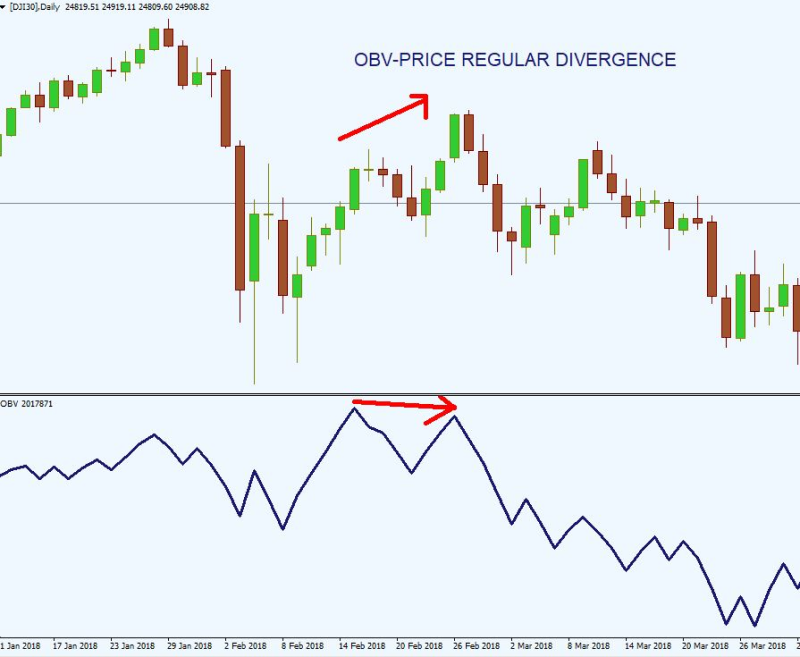
On-Balance Volume (OBV)
On-Balance Volume (OBV) is a volume-based indicator that measures the cumulative long and short pressure in the market. It adds or subtracts volume based on price direction, providing valuable insights for hidden divergence trading. When analyzing hidden divergence, traders observe OBV for divergence with price movements. Such discrepancies can act as confirmation or warning signals for hidden divergence, helping traders assess the likelihood of impending trend changes and make more informed trading decisions.
Force Index
The Force Index combines both price and volume to assess the strength behind market movements, making it a useful tool in hidden divergence trading. Traders use the Force Index to identify hidden divergence by observing discrepancies between the indicator and price action. Force Index divergence can indicate potential shifts in market momentum, offering traders valuable insights into hidden divergence and helping them anticipate and respond to changes in trend direction.

Top types of hidden divergence trading strategies
Double Confirmation hidden divergence strategy
The Double Confirmation hidden divergence strategy involves the use of two different oscillators, such as the RSI and MACD, to enhance the reliability of hidden divergence signals. These oscillators assist in identifying hidden divergences by comparing their movements to the price action. Traders execute this strategy by entering trades only when both oscillators independently signal hidden divergence in the same direction. This dual confirmation provides a more robust indication of potential trend reversals, helping traders make more informed decisions.
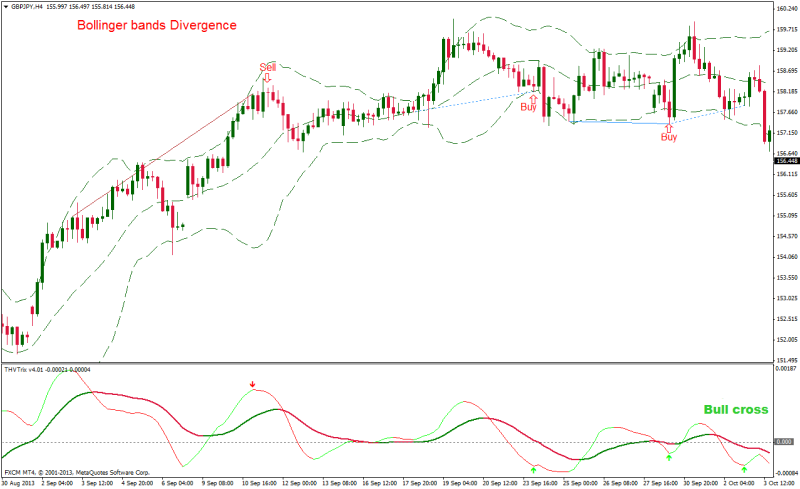
Bollinger Bands hidden divergence strategy
The Bollinger Bands hidden divergence strategy combines the Bollinger Bands and an oscillator, such as the RSI, to identify hidden divergence and potential trend reversals. In this strategy, traders first identify hidden divergence using the selected oscillator within the Bollinger Bands framework. They then look for hidden divergence signals occurring when the price is outside the bands, suggesting a potential trend reversal. Confirmation of the hidden divergence signal may involve observing a bounce off the bands or a contraction in bandwidth. Trades are executed based on this confirmed hidden divergence signal.
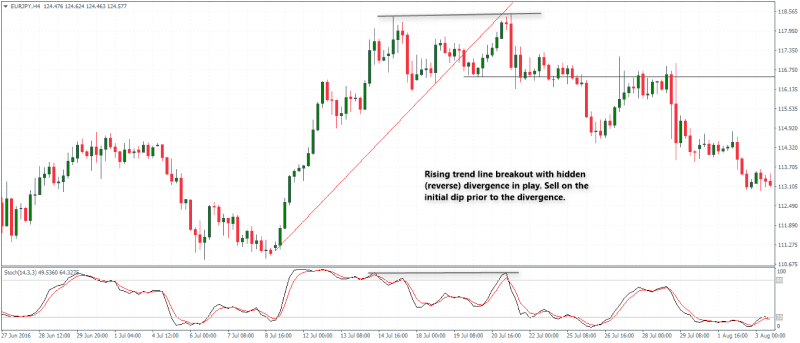
Trendline Break hidden divergence strategy
The Trendline Break hidden divergence strategy incorporates trendlines and an oscillator, such as the Force Index, to identify hidden divergences and potential trend reversals. Traders identify hidden divergence using the chosen oscillator and draw trendlines connecting significant highs or lows on the price chart. The strategy involves looking for hidden divergence signals occurring near trendline support or resistance. Trades are executed when hidden divergence aligns with a breakout or bounces off a trendline.
Volume Profile hidden divergence strategy
The Volume Profile hidden divergence strategy utilizes the Volume Profile and an oscillator, such as the Money Flow Index (MFI), to identify hidden divergences and potential trend reversals. Traders overlay the Volume Profile on the price chart to identify areas of high and low volume, and then look for hidden divergence signals occurring near significant volume nodes. Trades are executed when hidden divergence aligns with key volume levels, providing additional confirmation. Traders may also consider volume-related factors, such as volume spikes or divergences, for further insight into potential shifts in market momentum.
Identifying hidden divergences for effective trading
Hidden divergences provide traders with early warnings and confirmation signals, enhancing the precision of their entry and exit decisions. Overall, it is a versatile tool across various timeframes, offering forex traders a dynamic strategy to navigate dynamic market conditions.
As with any trading strategy, the Hidden Divergence approach is not without its risks. Traders should be mindful of the potential for false signals, especially in ranging markets, and the complexity of pattern recognition. A diligent and research-driven approach is crucial to mitigating risks and optimizing the effectiveness of the Hidden Divergence strategy in the dynamic forex market.
Disclaimer: All material published on our website is intended for informational purposes only and should not be considered personal advice or recommendation. As margin FX/CFDs are highly leveraged products, your gains and losses are magnified, and you could lose substantially more than your initial deposit. Investing in margin FX/CFDs does not give you any entitlements or rights to the underlying assets (e.g. the right to receive dividend payments). CFDs carry a high risk of investment loss.