Trading indicators help you understand the volatile price movements of the Forex market. As a Forex trader, you cannot leave everything on luck. In fact, there is hardly any role luck plays in successful trades. If you want to maximise your profits in the Forex market, you need to make informed decisions that are backed by real facts, figures, and data. This is where trading indicators can help you.
What are trading indicators?
Trading indicators are technical analysis tools that highlight price signals and trends. They depict warnings, reversals, and market situations in the Forex market. Moreover, trading indicators can be used for both bullish and bearish markets.
The biggest advantage of using trading indicators is that they can help predict the market’s direction, which you can refer to for making further trade decisions. They also provide you with specific market information like when the currencies are oversold or overbought, and can even predict a pullback or a complete trend reversal.
Both beginners and experienced traders can use indicators to understand market movements. You can identify ideal market entry and exit points and prepare for unexpected market movements with the help of trading indicators. Several indicators can also be used together to make more informed and accurate predictions. In fact, it is recommended that you use at least two trading indicators for confirmation.
The top 10 Forex trading indicators
There are heaps of Forex trading indicators that you can use. The following list mentions just some of the most commonly used among beginner and experienced traders. Feel free to take what you can and apply them to your strategy accordingly.
1. Moving averages
Moving averages represent the average closing price of a currency pair over a specific time period. It gives you the average point where the falling prices stop falling and start raising, and vice versa.
This indicator also identifies support and resistance levels, and filters out random short-term price fluctuations to give you the average price to base your exit or entry strategies on.
Here’s how moving averages work:
- When the moving average shows the price trading above the average, it indicates that buyers are in control which is a good sign to buy the currency.
- When prices are below the moving average price, it means that sellers are in control, and short positions should be opened.
2. Average true range
The average true range (ATR) is a lagging indicator derived from the currency pair’s average prices in the past 14 days. It shows you how much the currency pair moves and in which direction during the day. This helps traders understand when they should initiate a trade or place the stop-loss order.
Here’s how ATR works:
- When the market is volatile, it signals that a market reversal will soon take place. The ATR can help you place long and/or short positions accordingly.
- When market volatility is low, this signals a trend continuation, letting you decide if you want to hold your current position or exit.
The ATR is one of the best technical indicators for day trading because it allows you to add or subtract ATR prices from the average closing price of the day. Traders can essentially use it to develop their entire trading system. It also helps them identify key exit and entry signals for their trading strategy.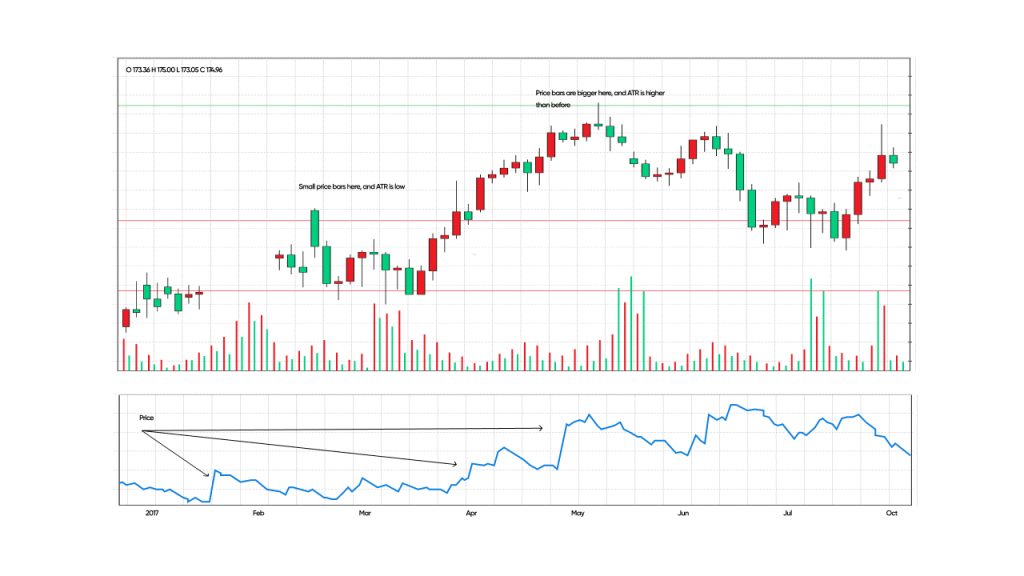
3. Exponential moving average
Exponential moving average (EMA) measures trend directions over a specific period. With EMA, greater weight is placed on recent prices, making the data more responsive and relevant to newer information in the market.
Since it considers recent prices, it works well for Forex traders who enter the market when prices are low and expected to increase. Market moves are confirmed with more precision, and decisions are made based on the latest trends.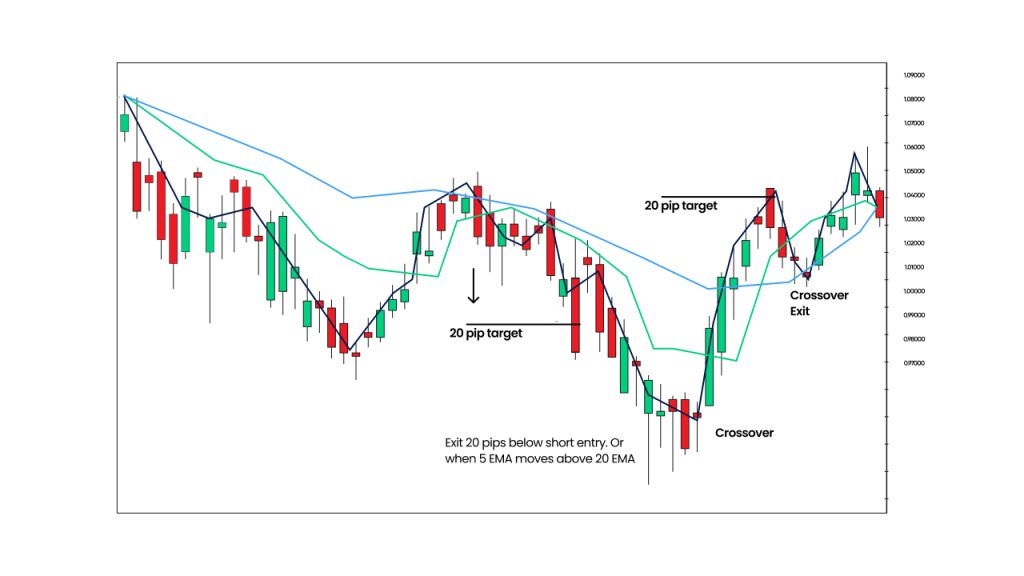
4. Relative strength index
The relative strength index (RSI) indicator tells you if currency pairs are being overbought or oversold in the market. It does so by analysing price changes and gives a reading out of 100.
- Any reading below 30 indicates an oversold currency pair and gives a buy signal to the trader.
- Any reading above 70 is an overbought market condition for the currency pair, signalling you to sell and exit the market.
Since it is both a leading and a lagging indicator for possible market reversals, it may provide you with opportunities that you might not be aware of otherwise. It lets you identify market momentum and warning signals for any potential price movements that can be dangerous for you.
5. Fibonacci retracements
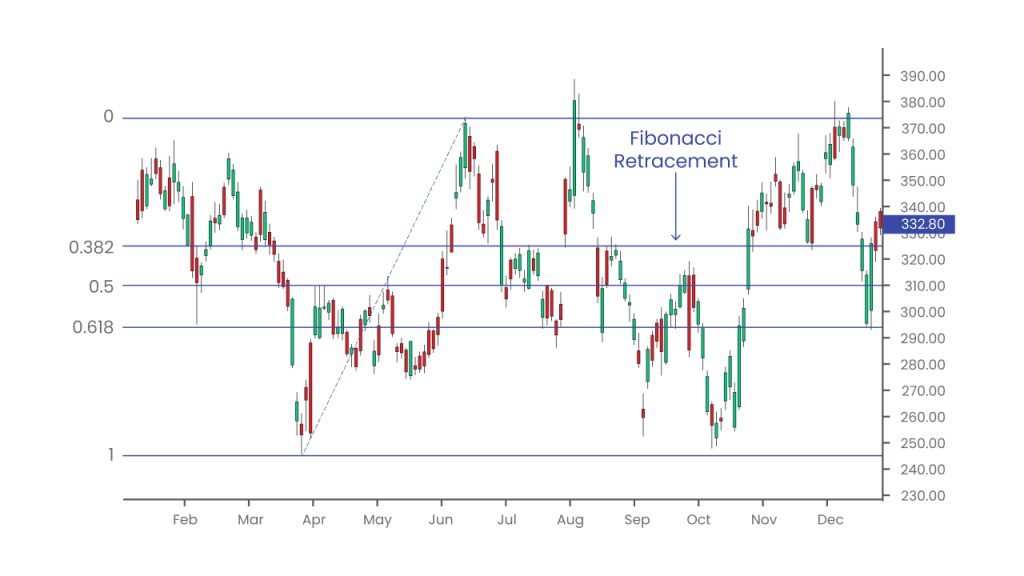
Fibonacci retracements are depicted by a certain set of numbers that tell you where support and resistance levels will occur. The resistance level is a point at which the rising prices stop and reverse directions, while the support level is where the falling prices stop and reverse to the upside.
The price levels are determined by the Fibonacci numbers 23.6%, 38.2%, 61.8%, and 78.6%, which tell you how much a currency pair’s price retraced in the past. When you think that the market will witness a potential dip or make a forward move, this trading indicator will help you confirm both assumptions.
Through support and resistance levels, you can decide where to apply your stop and limit orders. It also helps you identify where to open and close positions.
- When a price enters a resistance level, it indicates that this may be the time to sell and exit the market.
- When a price enters a support level, it is best advised to enter the market and go long since the market will see an upward trend.
6. Moving average convergence divergence
The moving average convergence divergence (MACD) indicator shows the relationship between the currency pair’s two moving average prices. It is used to identify the highest high and the lowest low of a currency pair over a certain period.
The MACD can be used to identify ideal entry and exit points because it measures the direction, duration, and strength of a particular trend before giving you ideal entry or exit points. The highest upward trend depicts an ideal exit point and the lowest downward trend showcases an ideal entry point in the Forex market.
7. Bollinger bands
Bollinger bands is a lagging indicator used to plot trend lines, which are two standard deviations away from the currency pair’s simple moving average price. It tells you if the currency pair price is high or low on a relative basis. Further, it also tells you when to exit or enter the position accordingly.
Bollinger bands give you a range in which the currency pair usually trades, with the range width depicting the market volatility. The larger the width, the greater the volatility.
- When a currency pair price touches the upper band, it is known as an overbought situation, where you should consider selling and exiting the market.
- When the price touches the lower band, it is in an oversold condition where it is better to buy more of that currency pair to potentially maximise profits.
8. Stochastic oscillator
The stochastic oscillator is a trading indicator that identifies momentum in the market. It measures momentum by comparing the currency pair’s closing price to its trading range over a specific period. Whenever these two lines intersect, it depicts that the trend will soon make a reversal.
It also helps identify overbought and oversold zones. Whenever the graph steeps excessively low or rises extremely high, it is most likely to witness a market reversal in the following ways:
- If it's an oversold zone, prices are predicted to rise from thereon. Hence, you could choose to enter the market and go long.
- On the other hand, if you see an overbought zone, the prices are most likely to dip further. Hence, you should consider exiting the market by going short and avoid further losses.
9. Standard deviation index
The standard deviation index (SDI) measures the size of the currency pair’s recent price movement to predict the price volatility.
- When the SDI comes out too high, it indicates that a big price change has taken place and a future decrease in volatility.
- When the SDI is too low, future volatility is predicted to be high.
If you see current prices getting higher, it may be wise to exit the market because the future holds a market reversal. On the contrary, if the current prices are going lower, you may choose to either enter the market or keep holding onto your position because large volatility is expected, which will involve an uptrend.
Since the SDI compares current against historical price movements, it gives you an estimate of the future market direction by analysing the past and present market trends.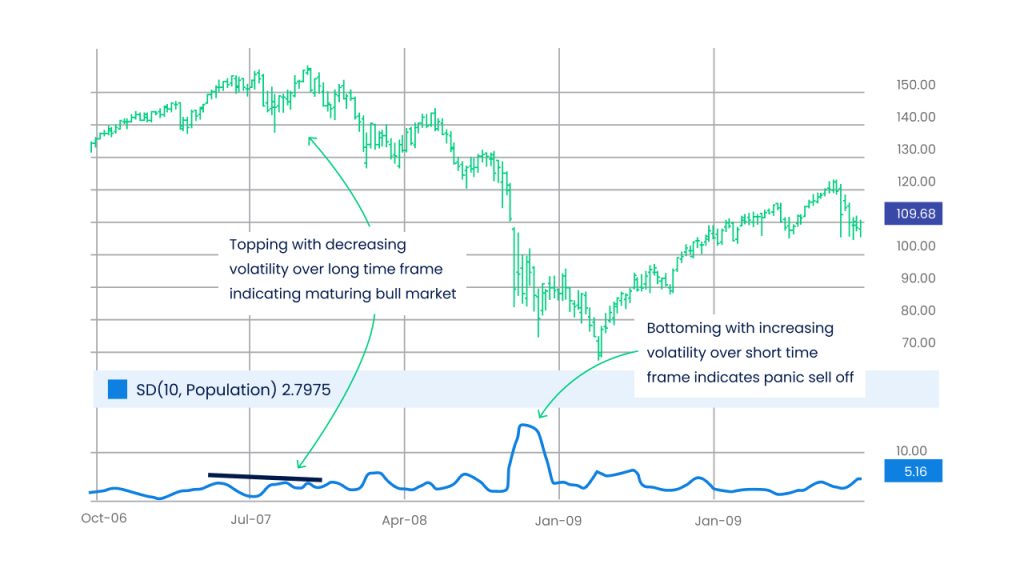
10. Pivot points
Pivot points are trading indicators used to identify overall market trends and reversals, usually in a ranging market. They are calculated to understand the levels in which market sentiments change from bearish to bullish and vice versa.
If the price goes beyond the pivot point, it is a sign that the demand for the currency pair is higher. In such a situation, the prices are predicted to rise. Alternatively, if the currency pair prices dip below the pivot point, it means that the supply of the pair is higher than its demand. This situation predicts falling prices due to excess supply.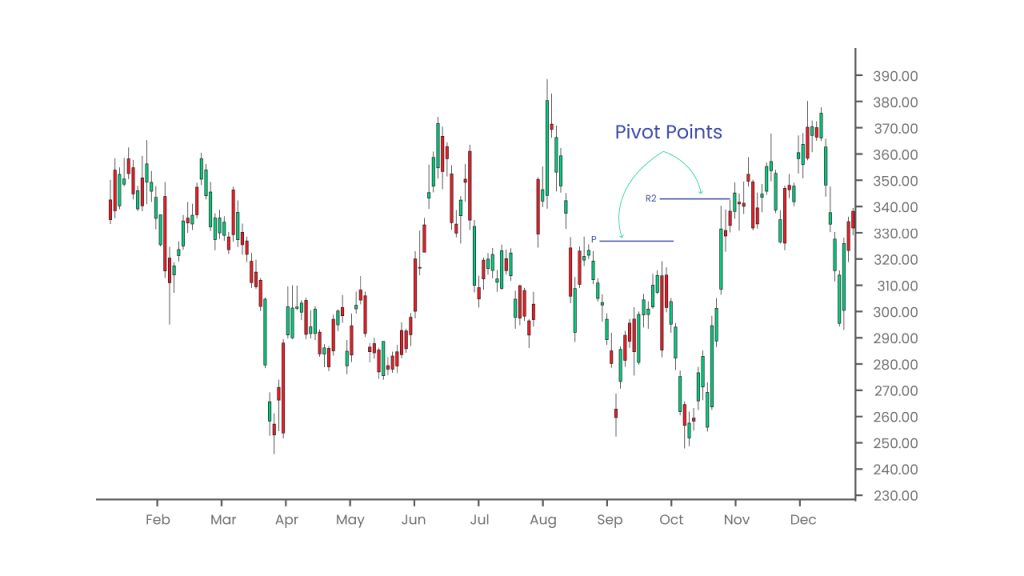
Learn more about Forex trading indicators
Forex indicators are essential trading tools that are proven to be useful for all types of Forex traders. Mixing up a few indicators together can help cross-check and confirm initial assumptions. They also provide you with more accurate exit and entry points in the market.
Blueberry. makes it easy for you to understand Forex trading indicators through our streamlined interface, powerful trading platforms, and free digital library of trading resources. Open a live account with us to start trading.
Disclaimer: All material published on our website is intended for informational purposes only and should not be considered personal advice or recommendation. As margin FX/CFDs are highly leveraged products, your gains and losses are magnified, and you could lose substantially more than your initial deposit. Investing in margin FX/CFDs does not give you any entitlements or rights to the underlying assets (e.g. the right to receive dividend payments). CFDs carry a high risk of investment loss.


