

Using a trailing stop-loss order in Forex trading is one of the best ways you can maximise profits and minimise risks. A trailing stop-loss order protects your market gains by letting you keep an open position as long as the currency pair price moves in your favour.
The moment the price changes direction, the stop-loss order closes your position immediately to minimise losses. It plays a significant role in risk management and protects your profit by setting a fixed stop-loss level.
What is a trailing stop-loss order?
It is a trade order that allows you to set a maximum value of loss that you are willing to incur. This limits a trader’s loss extent in Forex trading. It is designed so you can lock in profits while limiting losses at a particular trade.
For example, you open a position at the EUR/USD market for $500 and set your stop-loss order at $10. The price increases to $520, then falls to $510. Since you have a stop-loss order at $10, the trade is automatically closed if the price falls below $510. This locks in your total profit at $10.
3 powerful stop-loss techniques
Average True Range trailing stop-loss technique
An Average True Range (ATR) is a technical indicator that provides you with the degree of price volatility. With the ATR trailing stop loss technique, you can set an order based on the market’s volatility.
You will need to decide on an ATR multiplier first, which signifies the number of times you need to subtract or add the ATR. Once you’ve settled on a multiplier like 2, 3, 4, etc., you can set your ATR stops below the price if the market is in an uptrend. In case of a downtrend, the order is put above the currency price.
For example, if your multiplier is 2 and the ATR is 1.5. You need to place the trailing stop-loss 3 points below the currency price at the highest highs. In a downtrend, the trailing stop-loss should be placed 3 points above the lowest low.
Here are other tips that might help you:
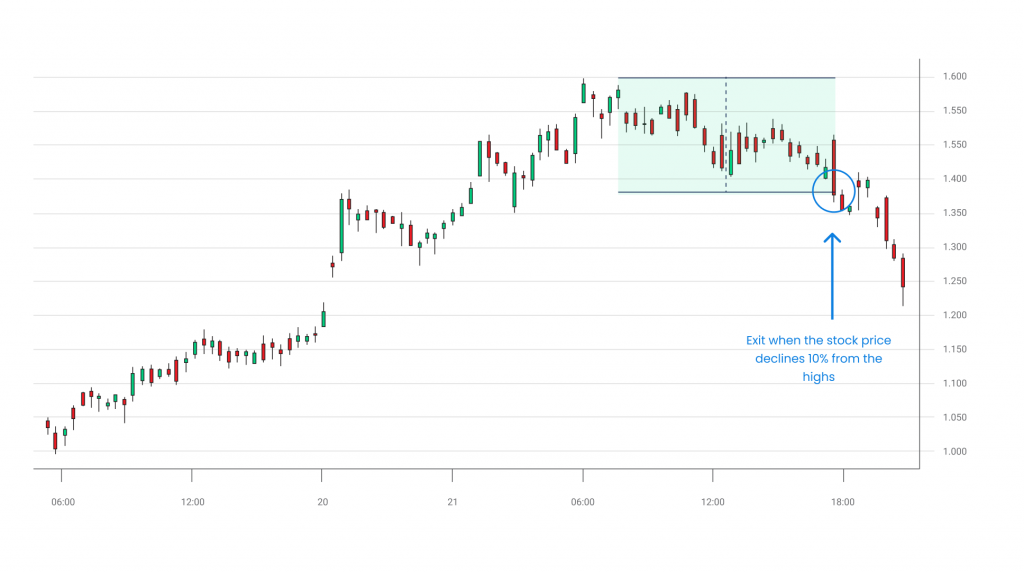
- You can use 2 as your ATR multiplier for a short-term trade and 4 if you are trading a medium-term trend. However, if you are trading long-term, you could use 6 as your multiplier. For example, the ATR indicator shows a 100-pip movement. If you are trading short-term, you can use 2 as your ATR multiplier (100*2=200). In this case, the stop-loss should be placed 200 pips away from the price.
- If you’re aiming for a long-term trade, you must subtract the price point level (200 pips) from the highs and place your stop-loss. Otherwise, you may add the price point level to the current price lows.
Zero indicator method
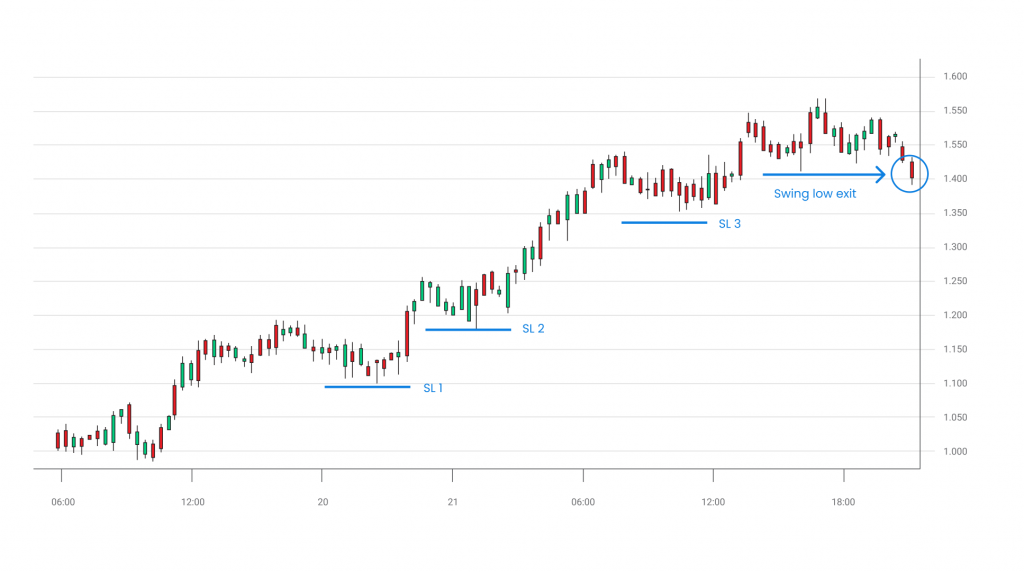
The Zero Indicator method helps identify low swings and an ideal stop-loss level. If the price closes below the low swing, the trade is automatically closed. Since uptrends consist of higher highs and lows, the lows can be used as a potential stop-loss level. This is because even if the trend holds onto the position, there is little to no chance it would close below the higher low.
You can use this technique by following the steps below:
1. Identify the recent low in an uptrend, which is lower than its surrounding prices.
2. Place the trailing stop-loss below the low.
3. If the price closes below this level, you may consider exiting the trade immediately to minimise losses.
Parabolic trailing stop-loss technique
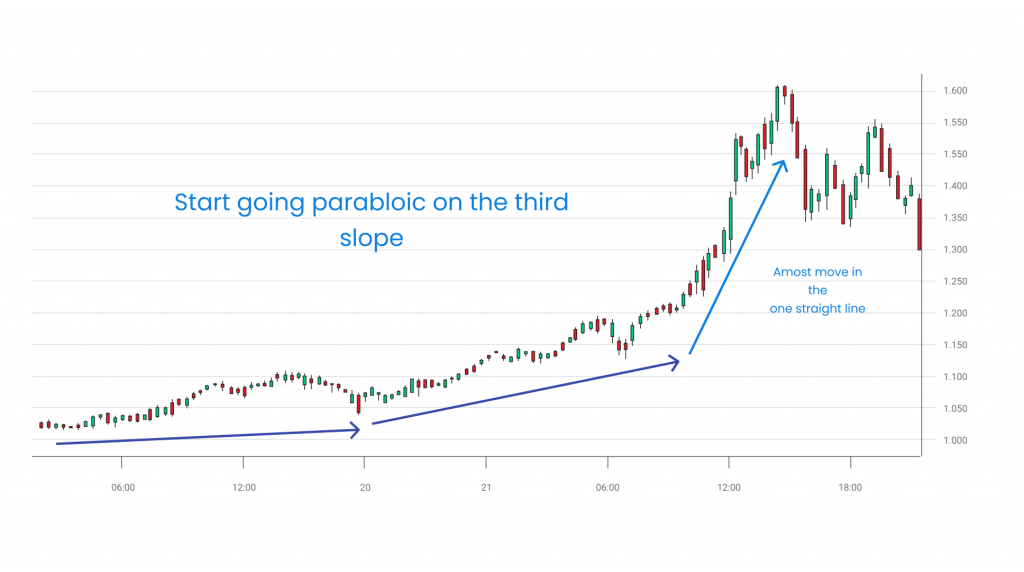
The Parabolic trailing stop-loss allows you to identify stop-loss levels in both bullish and bearish markets. When a trend makes a parabolic shape, it is considered risky since it can lead to a reversal. Hence, it is essential that you trail your stop-loss. Here is how you can do it:
- Identify the market’s direction. If the price is rising, trail your stop-loss on the previous low price point. If you see the price breaking below it, you may exit the market and collect your profits.
- Alternatively, it is best to place the stop-loss on the previous high when the price falls.
Start trading with trailing stop-loss orders
Using a trailing stop-loss order is one of the easiest risk management techniques you can do in the Forex market. It helps you protect existing profits and safeguard you against significant losses.
Blueberry. allows you to start trading Forex with just a few clicks. You can also start with a demo account to get accurate, hands-on experience on how to trade effectively with trailing stop-loss orders.
Disclaimer: All material published on our website is intended for informational purposes only and should not be considered personal advice or recommendation. As margin FX/CFDs are highly leveraged products, your gains and losses are magnified, and you could lose substantially more than your initial deposit. Investing in margin FX/CFDs does not give you any entitlements or rights to the underlying assets (e.g. the right to receive dividend payments). CFDs carry a high risk of investment loss.