
 ภาษาไทย
 Tiếng Việt
The GBPUSD price has rallied significantly as the USD begins to weaken. Could this offer us long opportunities?
Watch the video to learn more…
GBPUSD Analysis
The GBPUSD price has rallied today as the USD has weakened as the USD Index rejected the major 100.50 level. This combined with the seasonal analysis and commitment of trader report analysis for the GBP which suggests a bullish move coming has seen the GBPUSD break back of the 1.3100. The recent CoT reports show us that the commercials are increasing their long positions and decreasing their short positions offering long ideas.
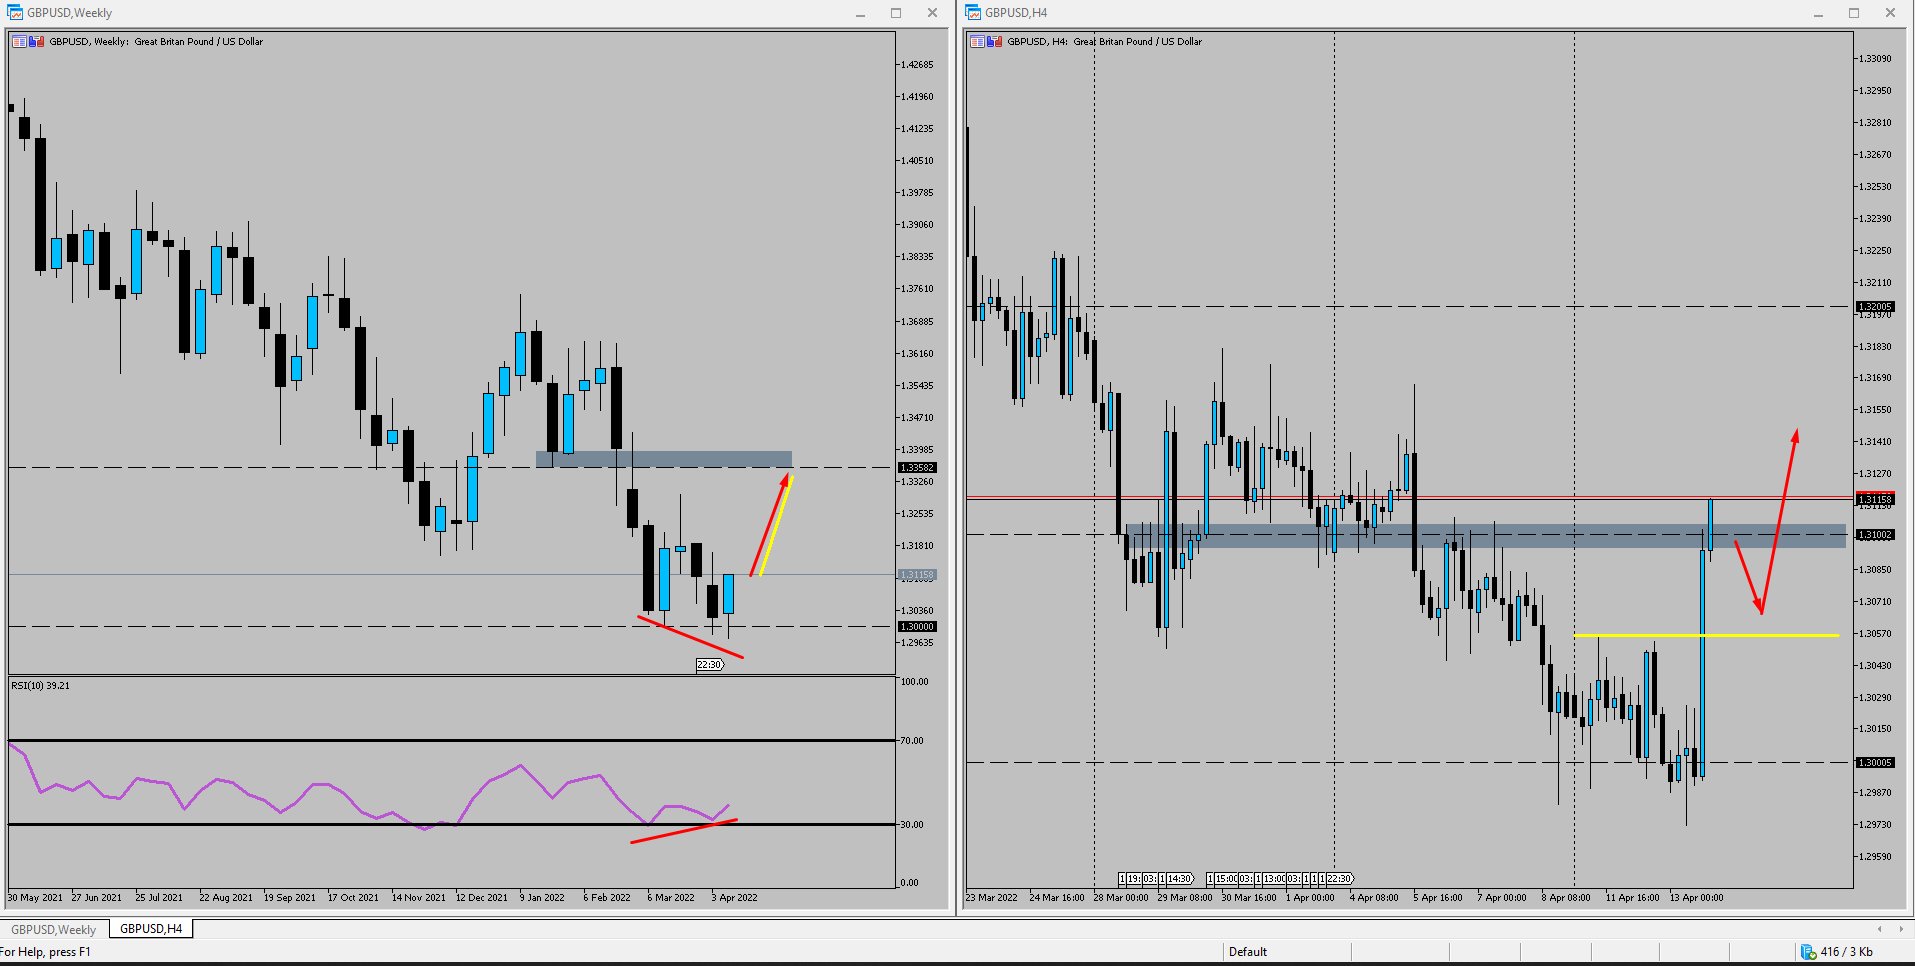
The weekly chart shows the price has rejected the previous swing lows around 1.3000. Not only this but the RSI indicator is showing triple bullish divergence as the price continued to make lower lows but the RSI made higher lows. This tells us that the lows being formed may not be as strong as appeared. If the price is going to move higher then we should see a 4hr uptrend form. The price has currently made a new high and is trading above the key 1.3100 level. If we hold above this level we can continue to look for long opportunities in line with the current reversal.
Do you trade GBPAUD? see our previous analysis here.
Enjoy low spreads and quick trade executions with a live account. Our highly committed customer support team will assist you from your quick account setup to any future concerns. Start trading with Blueberry Markets today.

