


In forex, the right timing isn’t optional; it’s mandatory. Buy too early, and the trader might lose money before the market turns. Sell too late, and one leaves gains on the table. Without clear entry and exit signals, even smart strategies fall apart. Guesswork can result in losses, whereas precision can produce gains. Mastering the timing of all forex trades is what separates calculated risk from costly mistakes, and it’s the difference between trading and mere speculation.
Follow the guide below to learn when to buy/sell a currency pair in the forex market.
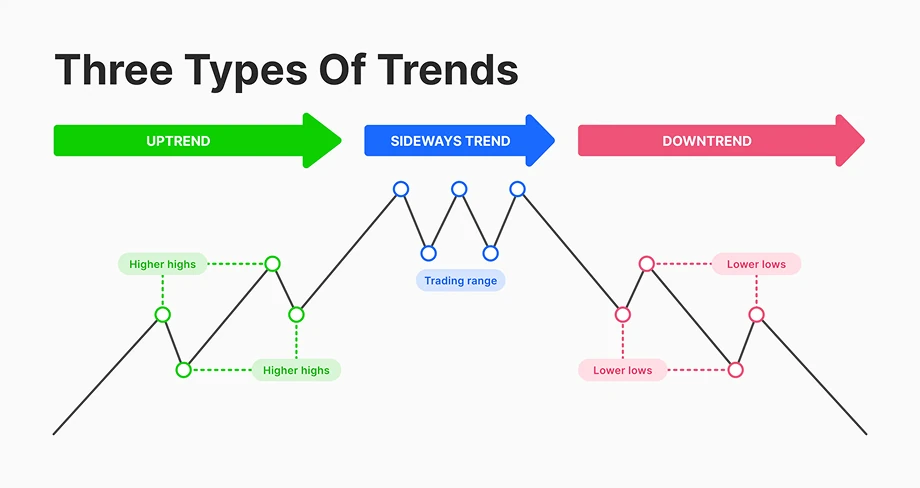
1. Understand the market trend
Before making any buy or sell decision, traders need to identify the prevailing market trend. Understand if the currency pair is in an uptrend, downtrend, or moving sideways. Use higher timeframes (like daily or weekly charts) to get a macro view.
For example, if EUR/USD has been making higher highs and higher lows, traders are in an uptrend, and buy opportunities are more favorable. Conversely, lower highs and lower lows signal a downtrend, indicating potential sell setups. Always align the trade direction with the broader trend to improve win rates.
2. Check economic indicators
Economic indicators provide clues about a country’s financial health and help forecast currency movement. For example –
- GDP growth reflects the economic strength of a country. A rising GDP often strengthens a currency and vice versa.
- Inflation (CPI/PPI) impacts interest rate decisions. Higher inflation may prompt central banks to raise rates, strengthening the currency and vice versa.
- Unemployment rate reveals labor market conditions. A falling unemployment rate often increases investor confidence and vice versa.
- Interest rate decisions directly influence currency strength. A rate hike generally leads to buying interest in that currency and vice versa.
- Consumer confidence and business sentiment surveys can also indicate increased future economic activity and vice versa.
Check the latest data for the countries involved in the currency pair and weigh the probable market reaction.
3. Use technical indicators
Technical indicators help confirm entry and exit points. Use them in combination for better accuracy. Some technical indicators one can add to their trading strategy for buy/sell signals are –
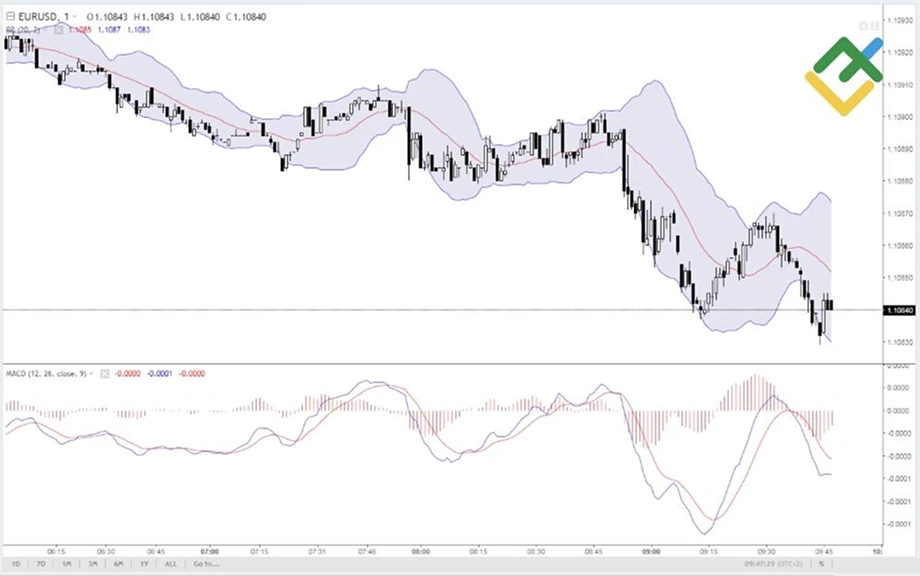
- MACD (Moving Average Convergence Divergence): It helps identify trend reversals and momentum. A MACD crossover above zero suggests a buy; below zero, a sell.
- Bollinger bands: These are useful for identifying overbought and oversold levels. If the price touches the upper band, consider selling; if it touches the lower band, consider buying.
- Stochastic oscillator: The stochastic oscillator measures momentum and identifies potential reversals. A reading above 80 is considered overbought (sell zone), and below 20 is oversold (buy zone).
- Fibonacci retracement: this indicator helps identify potential pullback levels during trends. Common retracement levels like 38.2%, 50%, and 61.8% are good entry points.
- RSI (Relative Strength Index): the RSI indicates strength and speed of price movements. A value above 70 suggests overbought conditions; below 30 indicates oversold.
To avoid false signals, traders can use all these tools (and more) in confluence.
4. Observe price action
Price action refers to the natural movement of price on a chart. Candlestick patterns like pin bars, engulfing candles, and inside bars offer valuable clues.
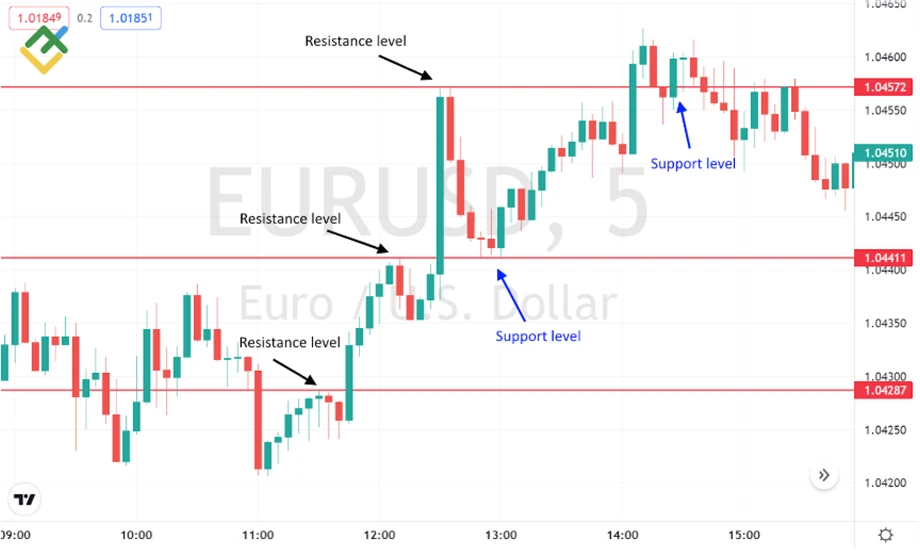
For example, a bullish engulfing candle on a support level suggests strong buying interest. Similarly, rejection wicks at resistance zones may indicate selling pressure. Combine these with trendlines, support/resistance levels, and chart patterns like head-and-shoulders or double tops for accurate entry points.
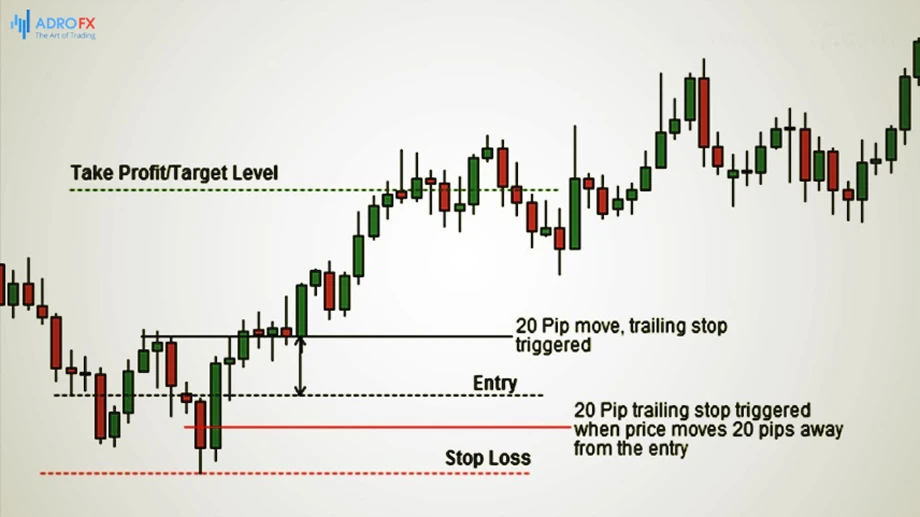
5. Set stop-loss and take-profit levels
Every trade needs a risk management plan. A stop-loss protects one’s capital if the market moves against the trader. A take-profit protects their gains at a predefined level.
- Place stop-losses just beyond support/resistance or invalidation levels of the trade idea.
- Take-profit levels can be based on previous highs/lows, Fibonacci extensions, or risk-reward ratios (e.g., 1:2 or 1:3).
This step prevents emotional decision-making and keeps trading discipline intact.
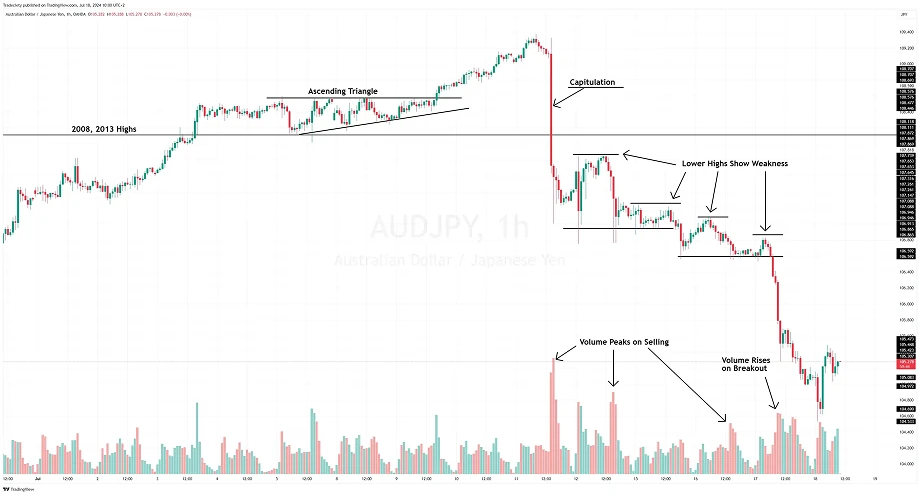
6. Confirm with volume
The volume shows the strength behind a price move. Tick volume (number of price changes) is often used in forex. A breakout backed by high volume is more reliable than one with low volume.
For example, if EUR/USD breaks a key resistance level with a spike in volume, it signals strong buying interest. This is ideal for initiating a long position. On the other hand, low-volume breakouts are more prone to failure and false signals.
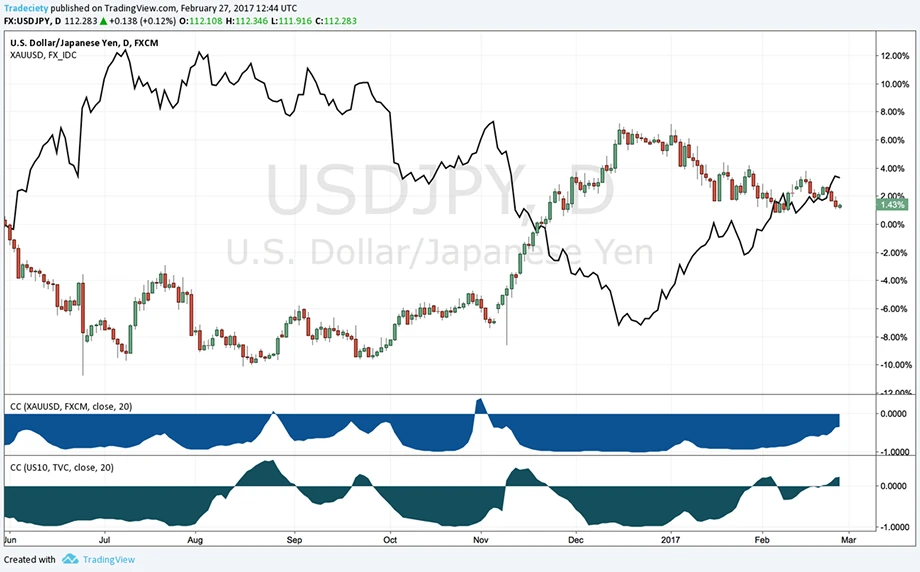
7. Monitor currency correlations
Currencies don’t move in isolation. Some pairs are positively correlated (move together), while others are negatively correlated (move in opposite directions).
- EUR/USD and GBP/USD have a strong positive correlation. If GBP/USD starts falling while the trader is planning to buy EUR/USD, it might be a warning sign.
- EUR/USD and USD/CHF are negatively correlated. If both are moving in the same direction, something’s likely off.
Use these correlations to confirm or filter trade setups. Ignoring them can lead to poor decisions and conflicting trades.
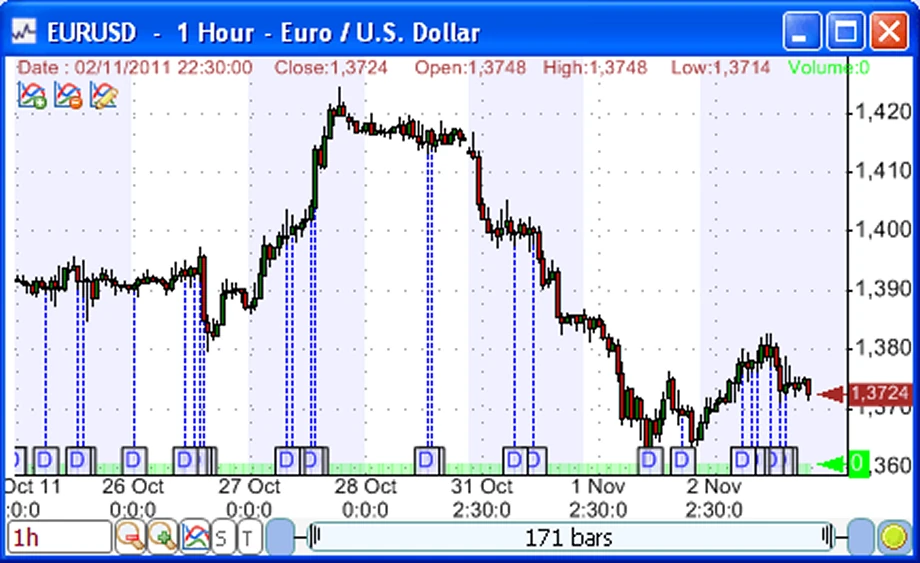
8. Use economic calendar
An economic calendar helps traders stay ahead of major news events that move markets, like non-farm payrolls, Fed interest rate decisions, or CPI reports.
Trading right before such events can be risky due to volatility and slippage. Instead, traders can –
- Avoid placing trades minutes before high-impact releases.
- Consider waiting for the market to digest the news before entering.
- If the trader is already in a trade, adjust stop-loss or close the position before news hits to avoid unnecessary risk.
Economic calendars also help traders plan trades around expected outcomes and market consensus.
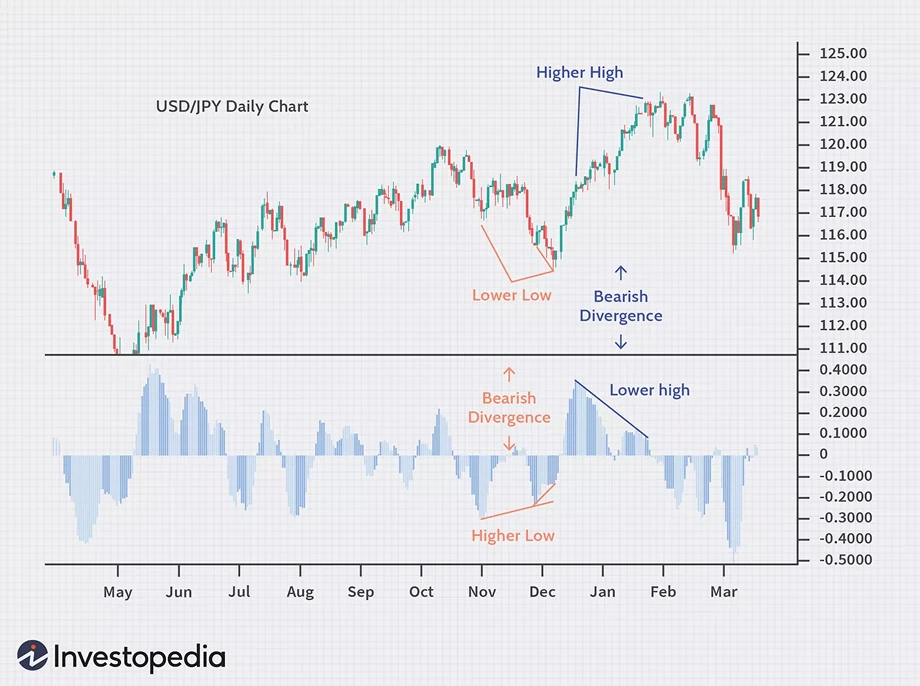
9. Look for divergence
Divergence occurs when the price moves in the opposite direction of an indicator, signaling a potential reversal.
- Bullish divergence: Price makes lower lows, but RSI or MACD forms higher lows. This indicates weakening bearish momentum and a possible buy signal.
- Bearish divergence: Price makes higher highs, but the indicator makes lower highs. This suggests a potential reversal and sell opportunity.
Spotting divergence, especially near strong support or resistance zones, increases the trade setup's probability. Combine it with trend analysis and volume for added confirmation.
The critical role of timing in forex trading
Knowing when to buy or sell currency pairs is the backbone of accurate forex trading. It helps traders ride strong trends, avoid false signals, and protect their capital. Without it, even the right strategies fail, and with it, traders can turn analysis into gainful action.
Disclaimer: All material published on our website is intended for informational purposes only and should not be considered personal advice or recommendation. As margin FX/CFDs are highly leveraged products, your gains and losses are magnified, and you could lose substantially more than your initial deposit. Investing in margin FX/CFDs does not give you any entitlements or rights to the underlying assets (e.g. the right to receive dividend payments). CFDs carry a high risk of investment loss.