


Triple top patterns can signal trend reversals and help identify key resistance levels. Traders looking to enter short positions at the peak of an uptrend can maximize their gains by identifying trend reversals with this pattern.
Let's dive into understanding the triple top candlestick trading strategy.
What is the triple top candlestick pattern?
The triple top is a bearish reversal pattern that occurs after an uptrend. It consists of three distinct peaks at roughly the same price level. It forms a shape similar to the letter' M.' The triple top pattern suggests that the long pressure is weakening, and the price may soon fall.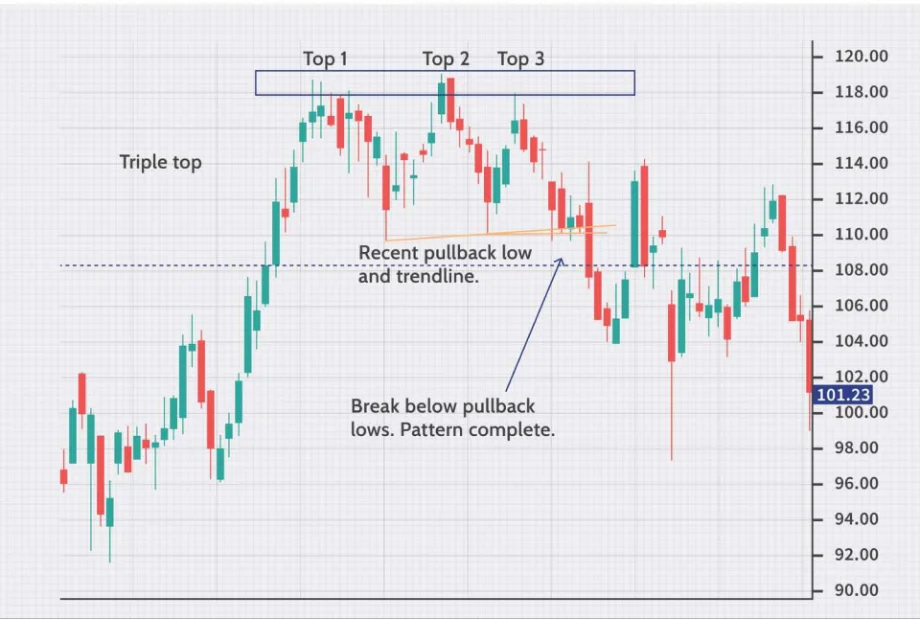
How to identify the triple top candlestick pattern
- Look for a prior uptrend: The triple top forms after a sustained uptrend. Ensure the market has been moving higher before spotting the pattern.
- Identify three similar peaks: Look for three distinct peaks at or near the same level. These peaks indicate strong resistance where the price fails to move higher.
- Spot dips between peaks: There should be dips between the peaks that act as support. The price will drop after each peak but not significantly lower until the breakout.
- Monitor volume behavior: Volume typically decreases as the pattern forms. Watch for an increase in volume when the price breaks below the support, confirming the pattern.
- Wait for the breakdown: The pattern is confirmed when the price breaks below the support level formed between the peaks.
- Look for confirmation of the breakdown: Ensure the breakdown is followed by strong downward momentum and volume, confirming the bearish reversal.
This is an example only to enhance a consumer's understanding of the strategy being described above and is not to be taken as Blueberry providing personal advice.
What does the triple top candlestick pattern signal?
- Resistance level failure: The pattern confirms a strong resistance level where the price fails to break higher three times. This repeated rejection of higher prices shows that bears are taking control, signaling a potential reversal
- Trend reversal: The triple top pattern indicates a bearish trend reversal. After an uptrend, the price forms three peaks at the same resistance level. This shows that bullish momentum is fading, and bears are starting to take over
- Market exhaustion: When the price forms three peaks at similar levels, it suggests that the bulls are losing momentum. The repeated failure to break resistance indicates market exhaustion and a likely shift in direction
- Breakdown confirmation: The triple top signals the confirmation of a breakdown when the price breaks below the support formed by the dips between the peaks. This breakdown, supported by higher volume, confirms that the market has reversed its trend
Top indicators to use with the triple top candlestick pattern
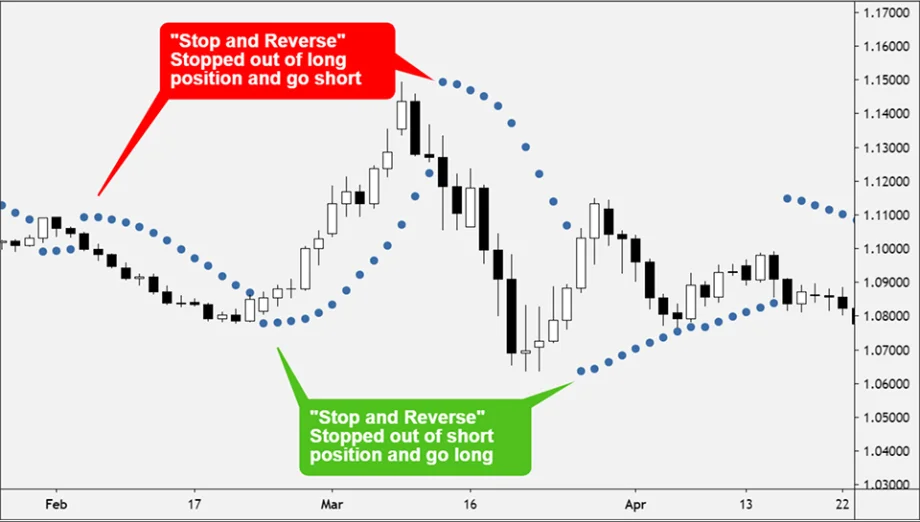
Parabolic SAR (Stop and Reverse)
Use the Parabolic SAR to confirm the trend direction. When the price breaks below the support after the third peak, the Parabolic SAR will flip, indicating a shift from an uptrend to a downtrend.
Exponential Moving Averages (EMA)
The EMA helps identify the overall trend. If the price breaks below the resistance and the short-term EMA crosses below the long-term EMA, it confirms a trend reversal.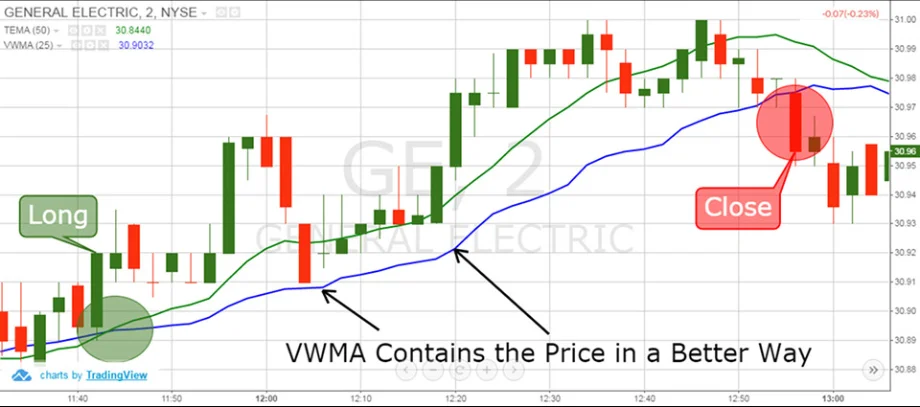
On-Balance Volume (OBV)
OBV tracks volume flow. It should show increasing volume on the downside when the price breaks below support, confirming the breakdown and the pattern's validity.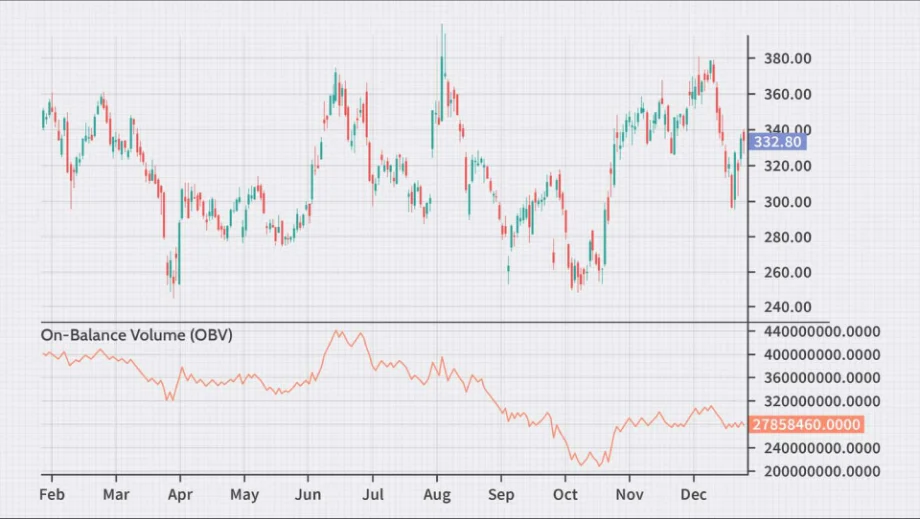
Trading strategies for the triple top pattern
Breakout strategy
Wait for the price to break below the support level formed by the dips between the peaks. This confirms that the uptrend is losing strength, and a reversal is underway. Once the breakdown is confirmed, enter a short position.
Traders can target the projected downside movement. The target can be set by measuring the distance from the resistance level to the support level and then projecting that distance down from the breakout point.
Divergence strategy
Look for divergence between the price action and an oscillator like the RSI. If the price forms higher highs while the RSI shows lower highs, it indicates weakening bullish momentum.
This divergence suggests the long pressure is fading, reinforcing the triple top pattern's bearish signal. Traders can use this as additional confirmation to enter a short position before the trend fully reverses.
Trend Following with retest
After the breakdown below support, wait for the price to retest this level. The price level becomes the resistance.
If the price fails to rise above this level and starts to fall again, it confirms that the downtrend is resuming. Enter a short position at this retest, as the failure to break resistance strengthens the bearish outlook and provides a better entry point for the downward move.
Stepwise guide to enter the market with the triple top candlestick pattern
- Identify the triple top formation: Look for three peaks at similar levels. This signals a potential reversal after an uptrend.
- Confirm the trend: Ensure the chart pattern forms after a sustained uptrend. This indicates a possible trend reversal.
- Wait for the price to break support: Wait for the price action to break below the support level. This is formed by the dips between the peaks.
- Check for volume confirmation: Ensure volume increases during the breakdown, confirming the validity of the chart pattern.
- Place an exit order: Once the breakdown is confirmed, enter a sell order below the support level.
- Set stop-loss above the third peak: To limit risk in case of a false signal breakdown, place a stop-loss slightly above the third peak.
- Set a gain target: Set a target based on the expected price move, using the distance from the peaks to support.
- Monitor for signs of reversal or continuation: Watch for signs of reversal or continuation to adjust the strategy if needed.
- Adjust stop-loss to break-even: Once the price moves in favor, move the stop-loss to break-even. This will protect the trade against unwanted reversals.
Entering the forex market with the triple top candlestick strategy
The triple top pattern provides clear reversal signals, identifiable resistance levels, and a high probability of trend reversal. This makes it ideal for swing trading. However, it has drawbacks like false breakouts and late confirmation. It can also be unreliable in choppy markets and needs strong volume confirmation. Traders should combine it with other indicators to reduce risks and improve accuracy.
Disclaimer: All material published on our website is intended for informational purposes only and should not be considered personal advice or recommendation. As margin FX/CFDs are highly leveraged products, your gains and losses are magnified, and you could lose substantially more than your initial deposit. Investing in margin FX/CFDs does not give you any entitlements or rights to the underlying assets (e.g. the right to receive dividend payments). CFDs carry a high risk of investment loss.