


Triple bottom patterns signal strong trend reversals, helping traders identify financial market bottoms and potential long opportunities. By recognizing this pattern, traders can improve their entry points, leading to better long-term gains.
Let's dive into understanding the triple bottom candlestick pattern strategy.
What is the triple bottom candlestick pattern?
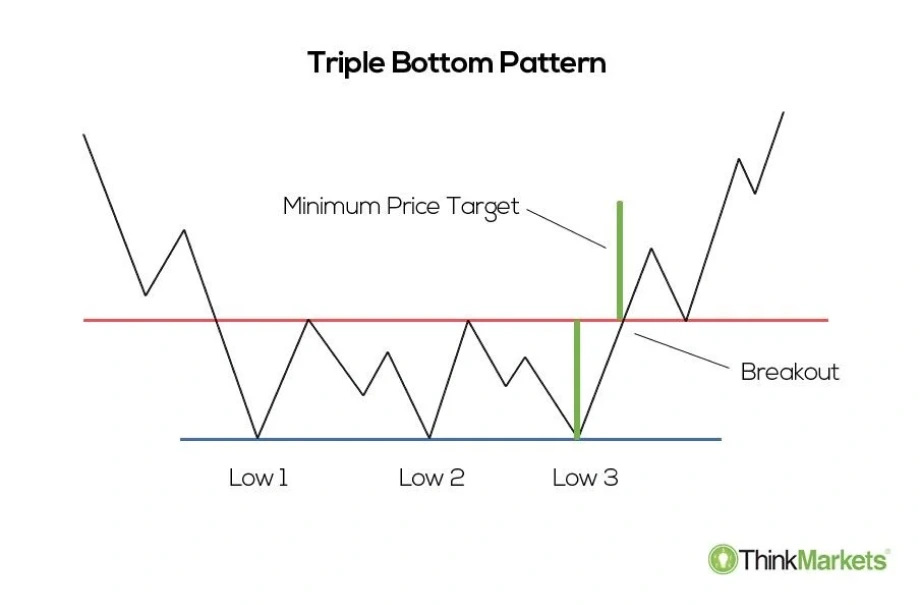
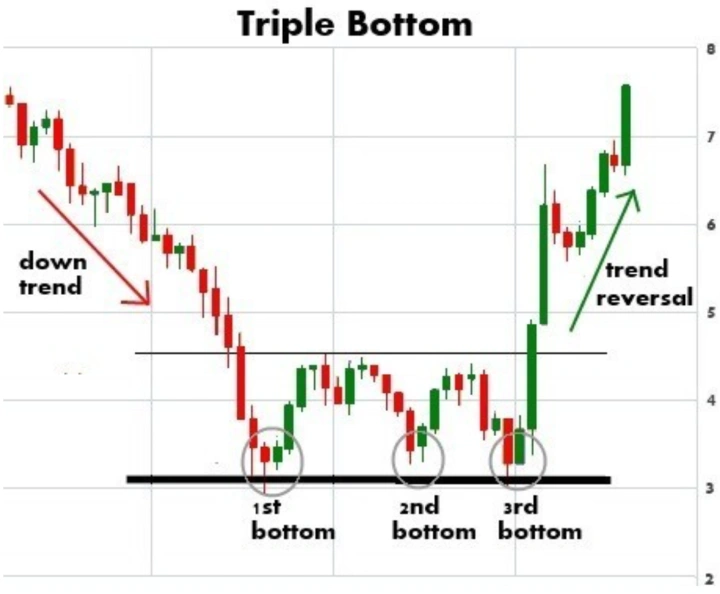
The triple bottom candlestick pattern is a bullish reversal chart pattern seen after a downtrend. It consists of three distinct lows roughly at the same price chart level, resembling the letter 'W.' This chart pattern signals that exit pressure has diminished, and the price may begin to rise.
How to identify the triple bottom candlestick pattern
- Look for a prior downtrend: The triple bottom chart pattern forms after a sustained downtrend. Before spotting the pattern, check for a clear downward trend on the chart.
- Identify three similar lows: Look for three distinct lows at or near the same level. These lows should indicate strong support where the price bounces upwards after each drop.
- Spot rising peaks between lows: Between the lows, there should be higher peaks that act as resistance. The price will rise after each low but not exceed the peaks until the breakout.
- Monitor volume behavior: Volume will typically decrease as the pattern forms. Watch for an increase in volume when the price breaks above the resistance, signaling the pattern's completion.
- Wait for a breakout point above resistance: The chart pattern is confirmed when the price breaks above the resistance formed by the peaks between the lows. This is a key signal of a trend reversal.
- Look for confirmation of the breakout: Ensure the breakout is followed by strong upward momentum and volume. A sustained rise above resistance confirms the bullish reversal pattern.
This is an example only to enhance a consumer's understanding of the strategy being described above and is not to be taken as Blueberry providing personal advice.
What does the triple bottom candlestick pattern signal?
Support level confirmation
The chart pattern confirms a strong support level. Here, the price bounces off the same point three times. This repeated rejection of lower prices shows that bulls are stepping in at this price. At this point, bulls prevent the market from falling further. This suggests that the support level is strong and can hold the price, signaling a potential price reversal.
Trend reversal
The triple bottom pattern indicates a bullish trend reversal. After a downtrend, the price chart forms three lows at the same support level. This signals that exit pressure is weakening. The pattern also suggests that the market is shifting from a downtrend to an uptrend, as bulls are beginning to take control after multiple attempts by bears to push the price lower.
Market exhaustion
When the price forms three bottoms at similar levels, it suggests that the bears are losing momentum and have failed to push the price lower after multiple attempts. The repeated failure to break support suggests that the market may be exhausted on the downside, and a reversal to the upside is likely.
Breakout confirmation
The triple bottom pattern signals the confirmation of a breakout when the price breaks above the resistance formed by the peaks between the lows. This breakout, when accompanied by higher volume, confirms that the market has reversed its trend. It signals that the bulls are taking control. The breakout point above the resistance signals the start of a potential uptrend.
Top indicators to use with the triple bottom candlestick pattern
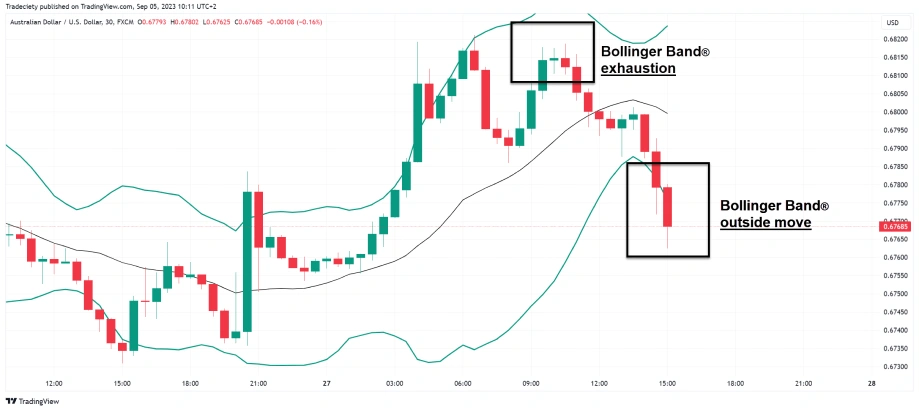
Bollinger bands
Traders can use Bollinger bands to assess volatility and price reversals. When the triple bottom pattern forms, the price may touch the lower band, signaling oversold conditions and suggesting a potential bounce. After the third bottom, if the price breaks above the middle band (the 20-period moving average), it confirms the trend reversal and breakout.
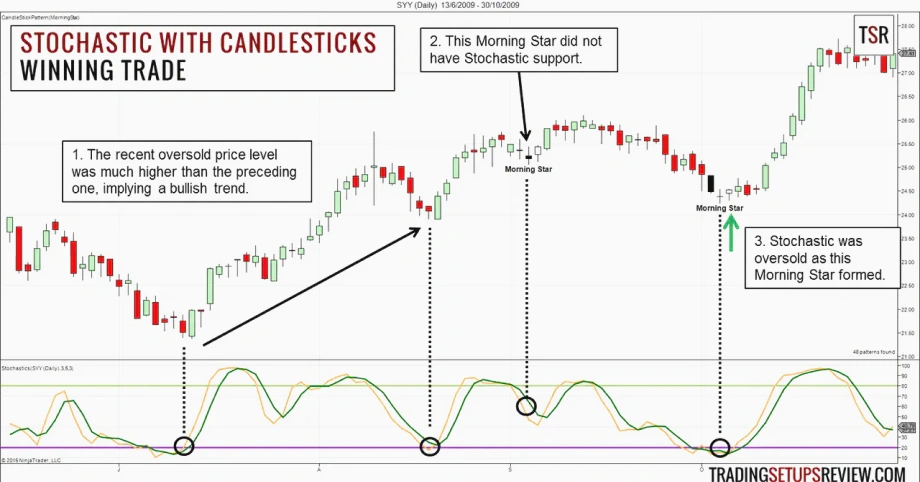
Stochastic oscillator
The stochastic oscillator helps identify overbought or oversold conditions. When traders spot a triple bottom, check if the stochastic is below 20 at each low. This shows the market is oversold. Once the price breaks above resistance, the stochastic should rise above 20, confirming momentum is shifting upwards and supporting the reversal.
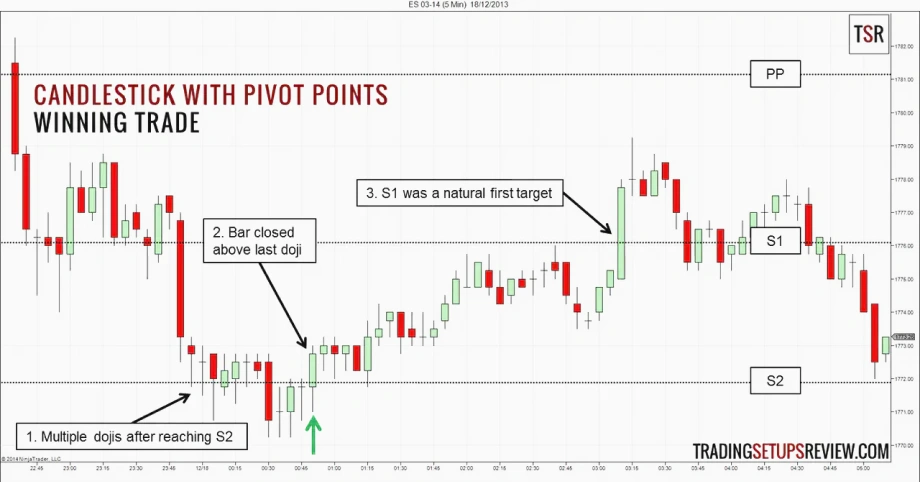
Pivot points
Pivot points show potential support and resistance levels. During the triple bottom pattern, the price may test key pivot levels. A breakout above a significant resistance pivot after the third bottom confirms the trend reversal. It also helps traders set price action targets for the uptrend.
Commodity Channel Index (CCI)
The CCI helps spot cyclical trends and overbought/oversold conditions. When the triple bottom forms, check if the CCI is below -100 at each low. This indicates the market is oversold. After the breakout, the CCI should move above 100, confirming that the market is gaining upward momentum and supporting the trend reversal.
Stepwise guide to enter the market with the triple bottom candlestick pattern
- Identify the triple bottom formation: Look for three distinct lows at similar levels, signaling a potential trend reversal after a downtrend.
- Confirm the downtrend: Ensure the chart pattern forms after a sustained downtrend, indicating a possible trend reversal.
- Wait for the breakout above resistance: Wait for the price action to break above the resistance level formed by the peaks between the bottoms.
- Check for volume confirmation: Ensure volume increases during the breakout, confirming the validity of the chart pattern.
- Place a long order: Once the breakout is confirmed, enter a long order above the resistance level.
- Set stop-loss below the third bottom: Place a stop-loss slightly below the third bottom to limit risk in case of a false signal breakout.
- Set a gain target: Set a gain target based on the expected price move, often using the distance from the bottoms to resistance.
- Monitor for signs of reversal or continuation: Watch for any signs of reversal or continuation to adjust the strategy if needed.
- Adjust stop-loss to break-even: Once the price moves in favor, move the stop-loss to break-even to protect against potential reversals.
Navigating opportunities and challenges in forex with the triple bottom pattern
The triple bottom pattern is reliable in trending markets, works across timeframes, and helps identify market bottoms. It also pairs well with Fibonacci levels for target setting. However, it can fail in sideways markets, lead to premature entries without volume, and be affected by news or economic factors. Traders should navigate the forex market by using this pattern alongside other indicators and confirming breakouts with volume.
Disclaimer: All material published on our website is intended for informational purposes only and should not be considered personal advice or recommendation. As margin FX/CFDs are highly leveraged products, your gains and losses are magnified, and you could lose substantially more than your initial deposit. Investing in margin FX/CFDs does not give you any entitlements or rights to the underlying assets (e.g. the right to receive dividend payments). CFDs carry a high risk of investment loss.