Gear Up for the first forex trading week of the new year! Dive into our latest video for an in-depth analysis of key economic events 📊💡 From US ISM manufacturing PMI to FOMC meeting minutes and NFP report - get the insights you need to trade smart! #ForexAnalysis #ForexTrading #Trading
Watch the video to learn more…
Forex Week Ahead Analysis
As we dive into a new week in the forex markets, several key economic releases and events are poised to shape the trading landscape. Here's a detailed look at what traders should be watching:
US ISM Manufacturing PMI: A Slight Uptick Expected
The Institute for Supply Management (ISM) Manufacturing Purchasing Managers' Index (PMI) is a significant indicator of economic health in the manufacturing sector. For the first release of the year, the forecast suggests a modest rise from 46.7 to 47.2. While still below the 50.0 threshold indicating expansion, this anticipated increase could signal a slight improvement in manufacturing conditions. Forex traders should monitor this release closely as it can influence the US dollar's strength, particularly against major pairs like EUR/USD and GBP/USD.
US FOMC Meeting Minutes: Language Toward Rate Cuts
The Federal Open Market Committee (FOMC) meeting minutes are always a market mover, but this release is even more crucial as it's the first one in 2024. Traders and investors will be scrutinizing every word, looking for hints about the Federal Reserve's stance on interest rates. There's a particular focus on any language that might suggest rate cuts in the year ahead. Clues about dovish shifts or ongoing hawkish stances can significantly impact market sentiment and consequently, the value of the USD.
NFP Report: Anticipated Decline in Job Growth
The Non-Farm Payrolls (NFP) report is a key employment indicator and often a volatility catalyst in the forex market. The forecast for this release indicates a decline in jobs added, from 199,000 down to 168,000. This potential decrease in job growth could be a sign of a cooling labor market, which might influence the Federal Reserve's monetary policy decisions. A lower-than-expected number could weaken the USD, whereas a surprise increase might strengthen it.
USD Index
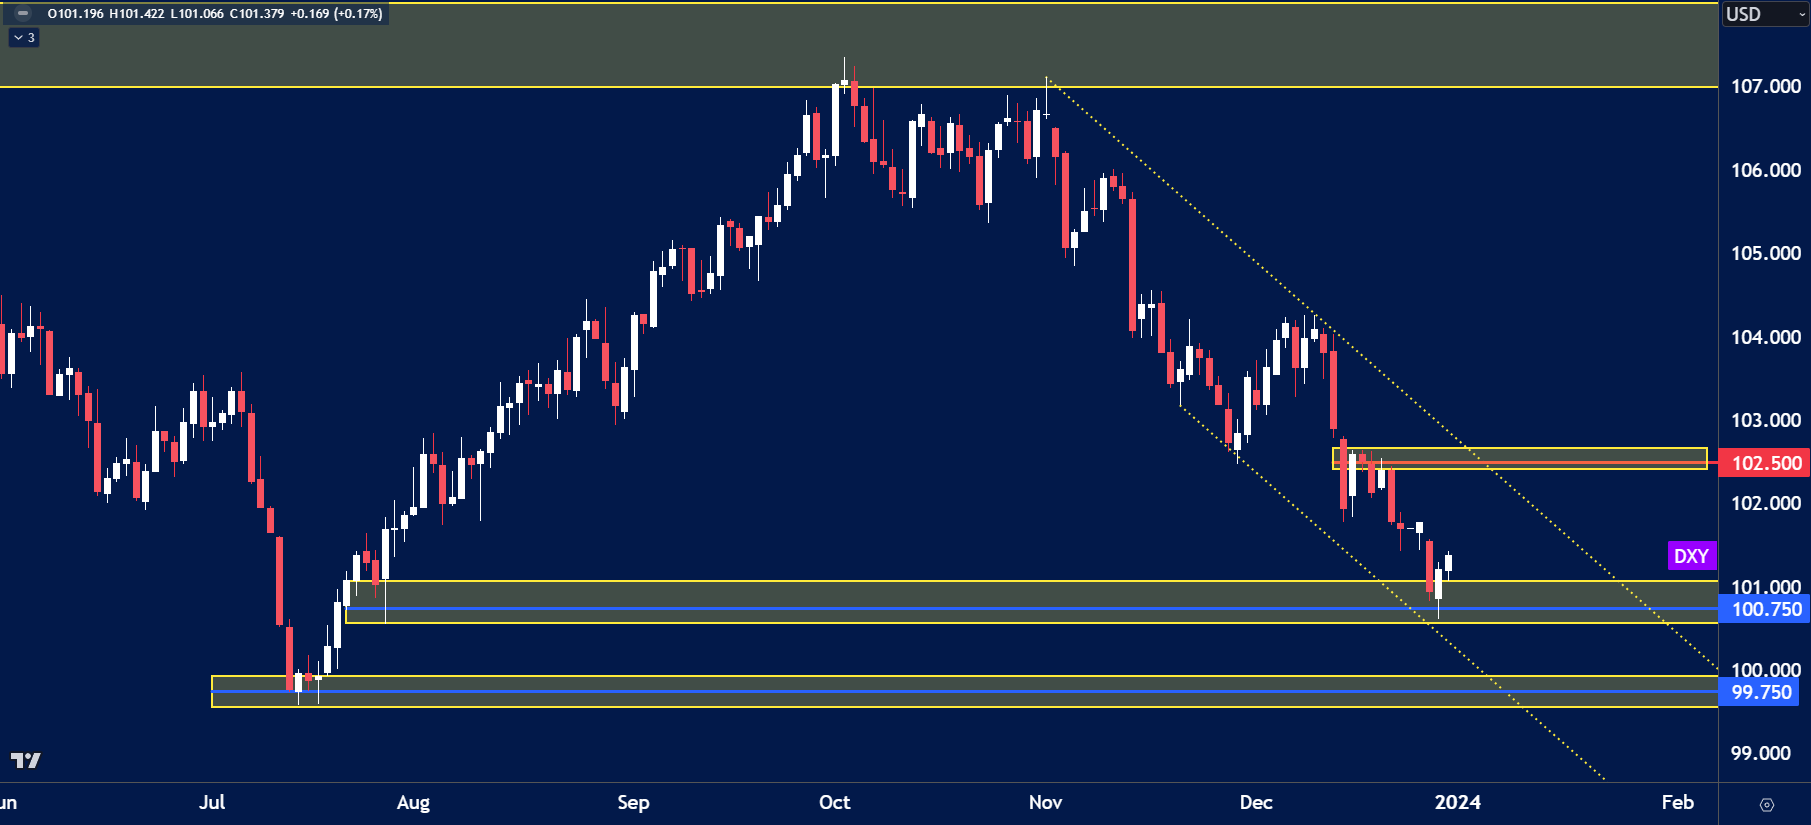
The price on the chart has traded through multiple technical levels and some observations included:
- Price has found support at the key lows of 100.75.
- Weekly support is below at 99.75, if USD weakness continues this level could be tested.
- Resistance above price is 102.50.
GBPUSD
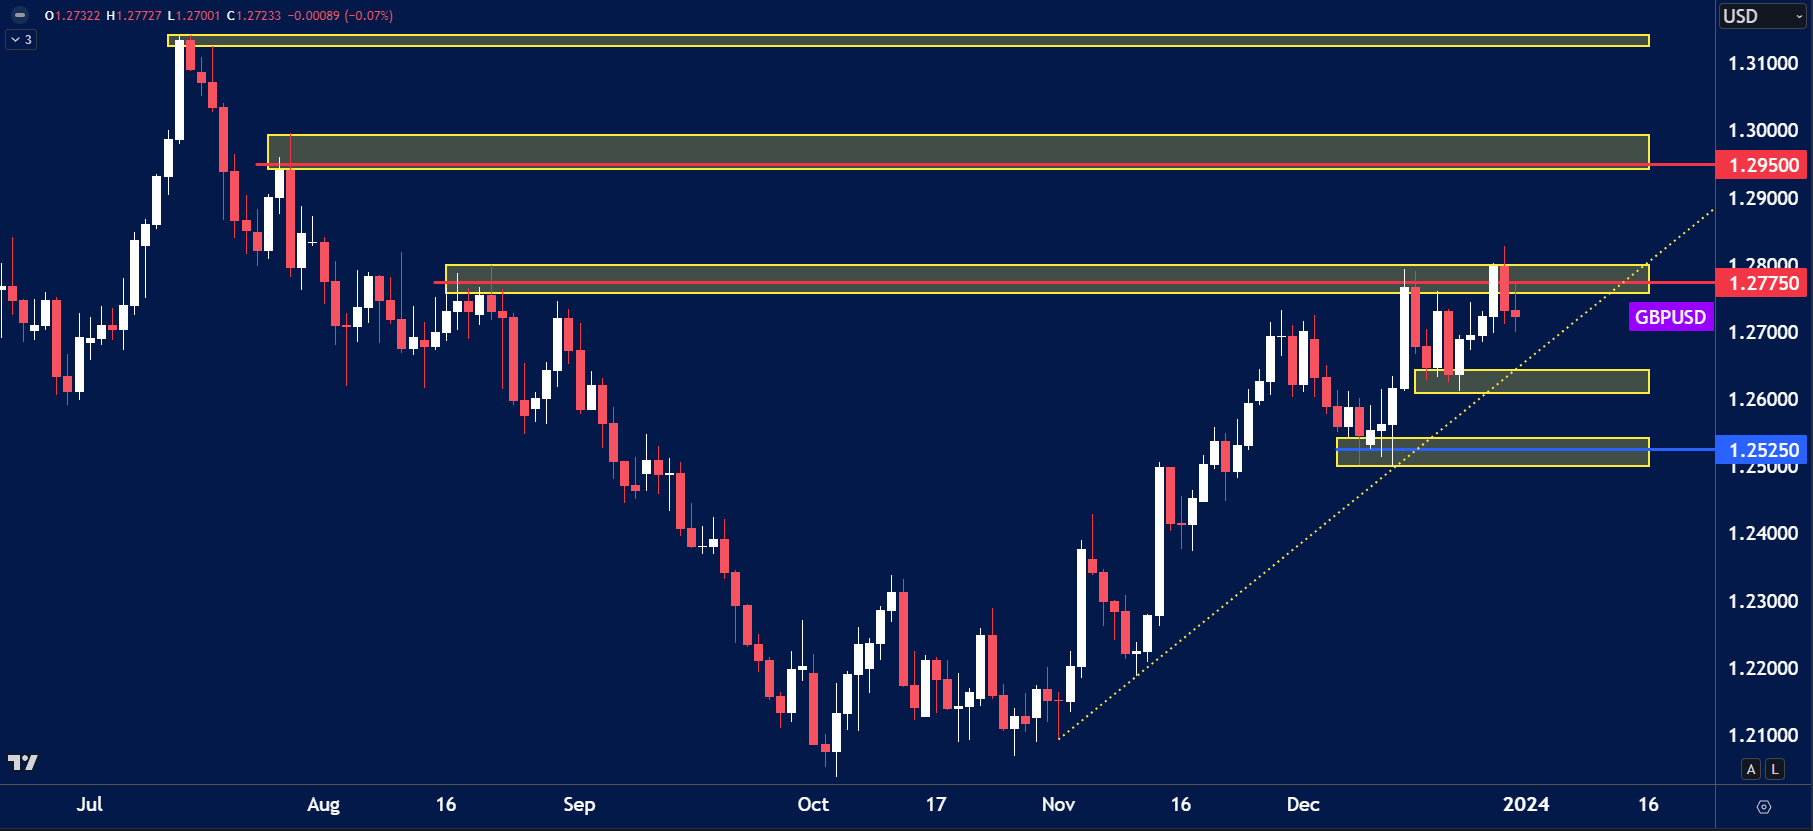
The price on the chart has traded through multiple technical levels and some observations included:
- Price has failed above the 1.2800 key resistance.
- A break and close above the 1.2800 level, it could see price trade to support of 1.2950.
- Price holding below could see a move towards 1.2600.
USDJPY
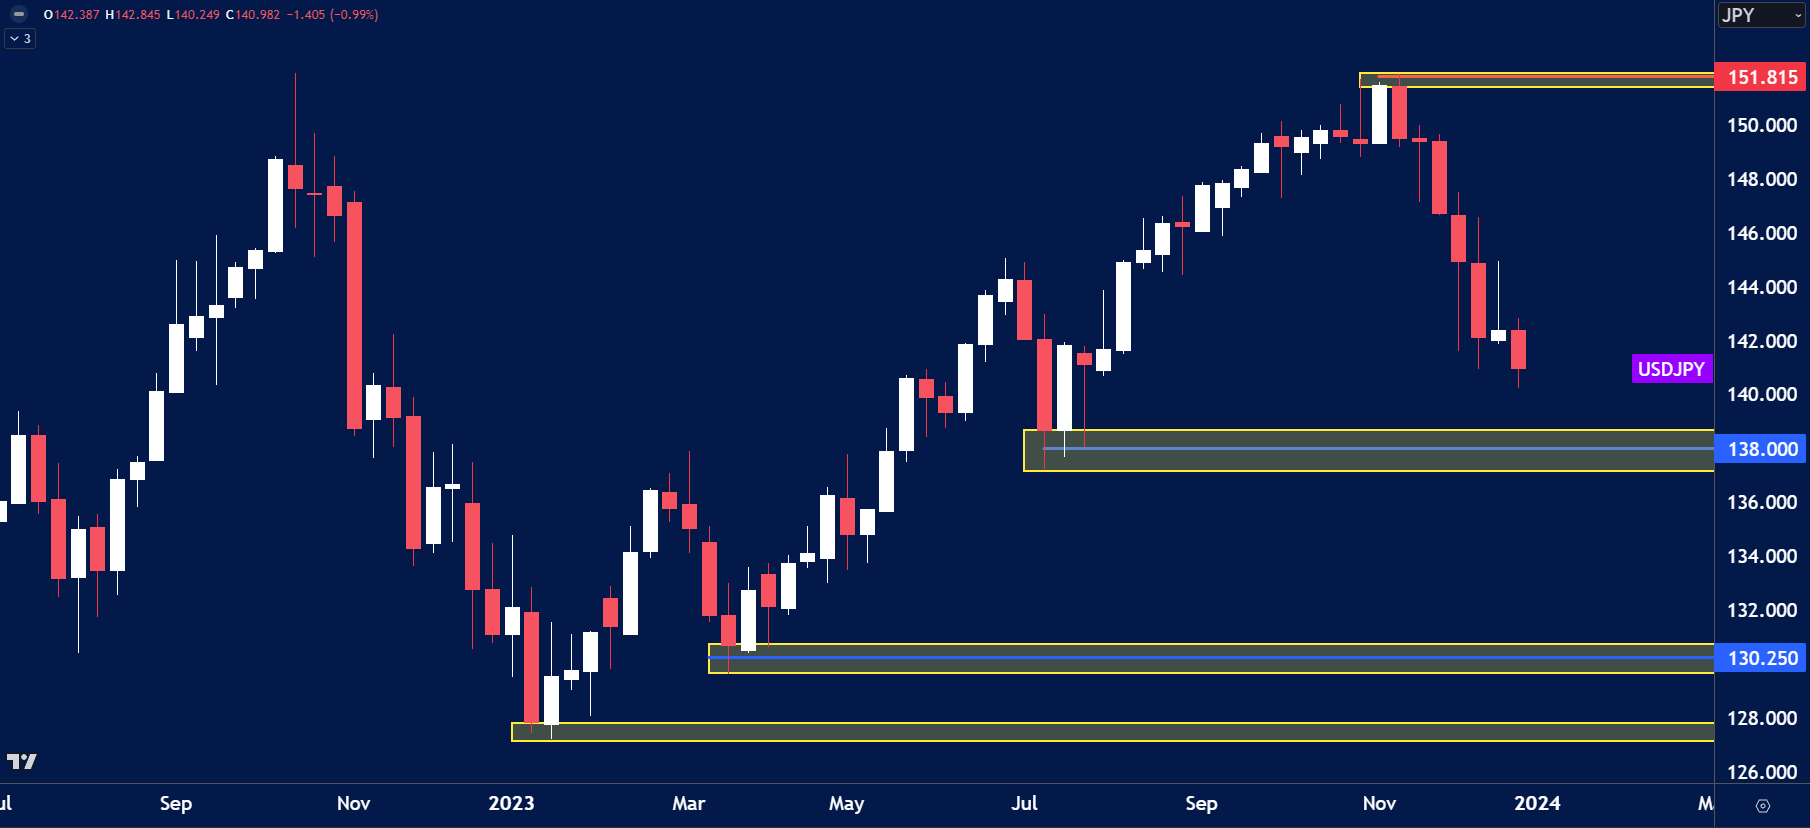
The price on the chart has traded through multiple technical levels and some observations included:
- Currency strength meter shows these two currencies on opposite ends of the scale.
- USDJPY is hovering above the key weekly support zone of 138.00.
- If price can reach this level we could see a reversal form.
USDCAD
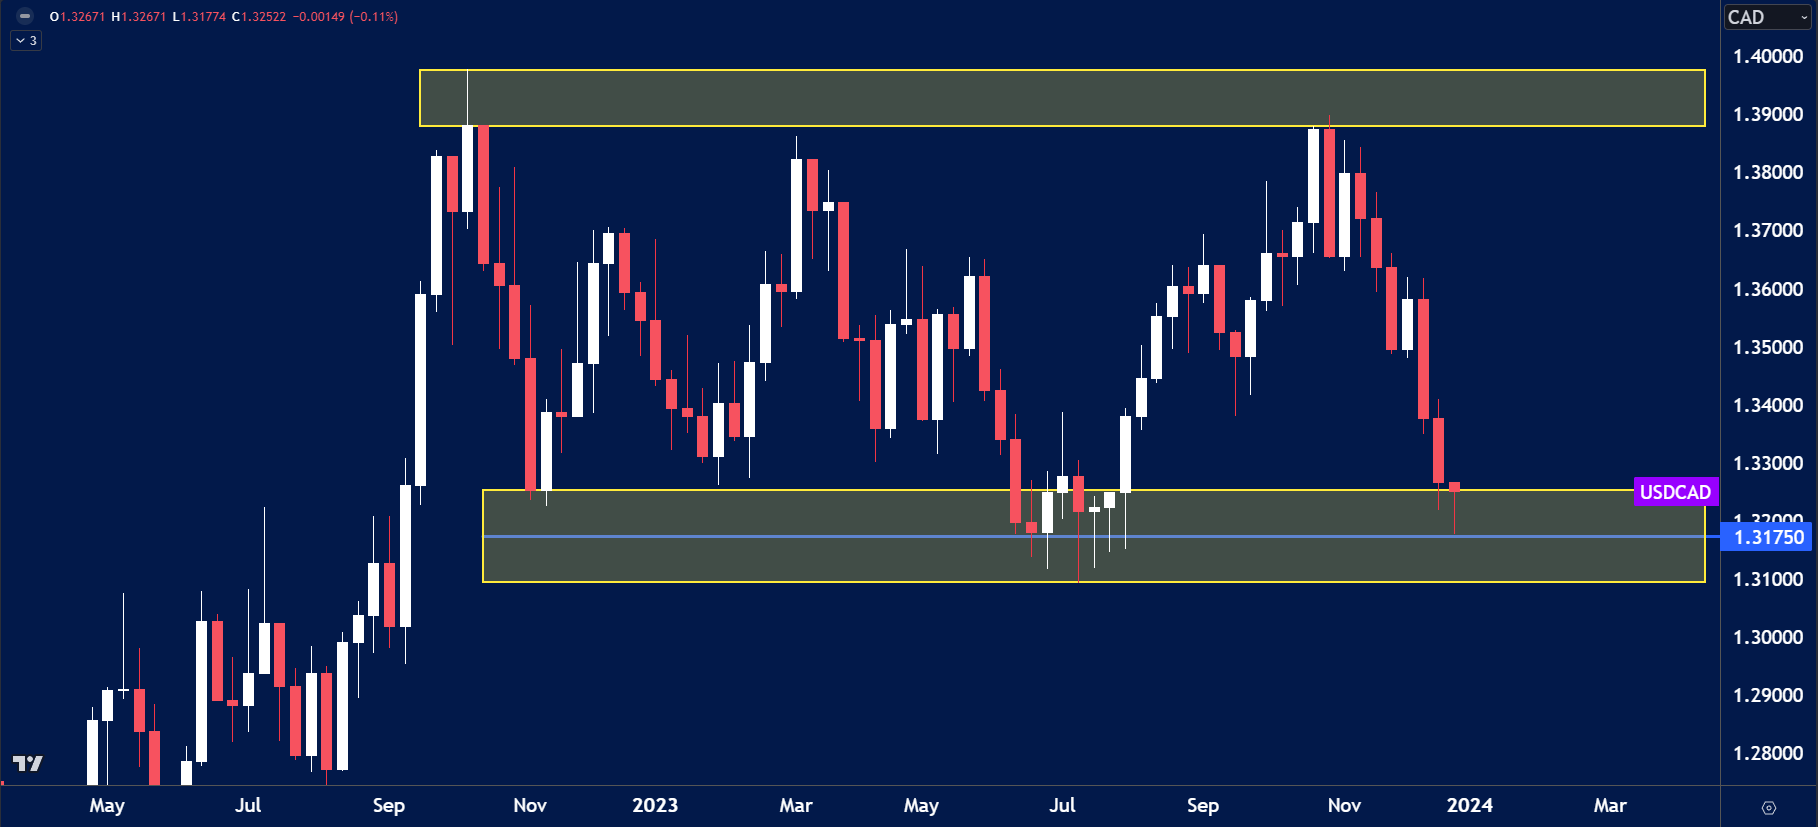 The price on the chart has traded through multiple technical levels and some observations included:
- The weekly chart shows prices in a strong range between highs of 1.3900 and 1.3175.
- If price finds support at this zone we could see price remain in the trading range.
Have you watched our latest video update? You can see it here.
Enjoy low spreads and quick trade executions with a live account. Our highly committed customer support team will assist you with your quick account setup for any future concerns. Start trading with Blueberry today.
Disclaimer: All material published on our website is intended for informational purposes only and should not be considered personal advice or recommendation. As margin FX/CFDs are highly leveraged products, your gains and losses are magnified, and you could lose substantially more than your initial deposit. Investing in margin FX/CFDs does not give you any entitlements or rights to the underlying assets (e.g. the right to receive dividend payments). CFDs carry a high risk of investment loss.


