


Fair value gap (FVG) in forex identifies price imbalances where institutional traders have moved the market quickly, leaving unfilled areas. Traders may reference this concept when reviewing potential areas of interest and assessing market conditions within their broader analysis.
In this article, we will cover the FVG concept in depth.
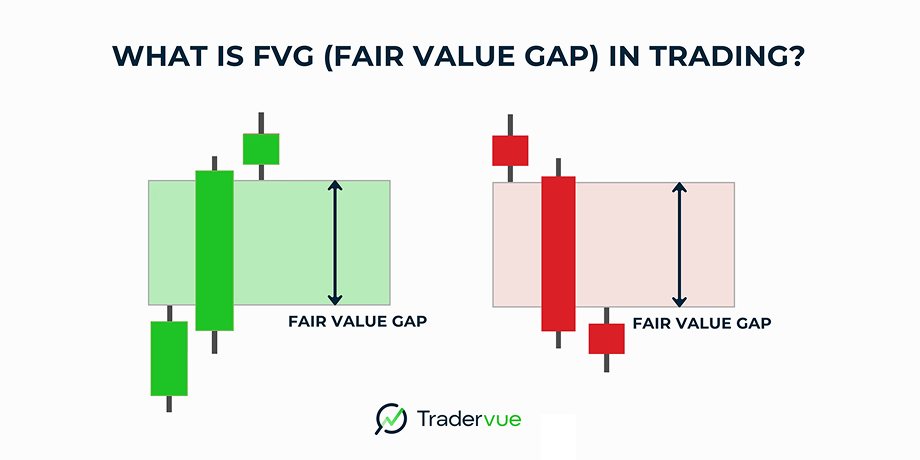
What is a fair value gap?
FVG is a concept from smart money trading strategies that is often used in price action and institutional order flow analysis. It refers to an imbalance in price movement caused by a sudden shift in entry or exit pressure, leaving behind an unfilled price range on the chart.
For example, in a bullish market, if candle 1 closes at 1.1200, candle 2 opens at 1.1210 and closes at 1.1250, and candle 3 opens at 1.1260 and has a low of 1.1235, the gap between 1.1200 and 1.1235 is a fair value gap. This may indicate an area where a pullback could occur, offering context for how price is interacting with the level.
How is an FVG formed?
The steps outlined below are for educational purposes only and should not be considered personal advice or a recommendation to trade margin FX/CFDs.
A fair value gap forms when there's a sudden surge in price, creating a price imbalance. This typically happens in a three-candle sequence on a chart. Here's how it works –
Step 1: Formation of the first candle (candle 1)
The market moves normally in this step. Then, candle 1 forms with a regular high and low. This candle is important because its high or low sets one boundary of the potential gap.
Step 2: Impulsive move by the second candle (candle 2)
A strong, bullish, or bearish candle appears. This candle creates fast price movement (displacement), often skipping over price levels.
Further, the body and wick of candle 2 do not overlap much with those of candles 1 or 3. This sudden move may suggest heightened participation during that period.
Step 3: Formation of the third candle (candle 3)
The candle then continues the move or stalls slightly. Most importantly, its wick does not fully retract into candle 1's range. This may indicate that a portion of the gap has not yet been retraced between:
- Candle 1's high and candle 2's low (in a bearish move)
- Candle 1's low and candle 2's high (in a bullish move)
Step 4: Identifying the fair value gap
The unfilled space between candle 1 and candle 3 is the fair value gap. It shows a price imbalance, suggesting that not all long/short orders were processed.
Step 5: Expecting price to revisit the gap
Finally, the price returns to this gap before resuming the original trend. This retracement offers traders high-probability entry zones.
How to identify FVGs on a chart
- Identify a strong impulsive move: Observe whether there is a sharp, directional price move with larger candles and limited pullback. This may suggest increased activity during that period, though it should be considered alongside broader market context or a shift in market sentiment.
- Spot the three-candle formation: Find the classic three-candle pattern: candle 1 (before the move), candle 2 (strong momentum), and candle 3 (doesn't wick into candle 1's range).
- Locate the price gap between wicks: In a bullish setup, check the gap between candle 1's low and candle 3's low. In a bearish setup, look between candles 1's high and 3's high.
- Mark the fair value gap zone: Highlight this gap area on your chart as the FVG. This is where the price may return to rebalance orders.
- Confirm with market context and trend direction: Ensure the FVG aligns with the broader trend. Traders may observe bullish FVGs forming during periods of upward movement in uptrends and bearish ones in downtrends. Add confluence like support/resistance or volume if needed.
Why institutional traders use FVG
Efficient entry and exit points
FVGs may highlight areas that traders monitor for possible price interaction. This allows them to enter or exit trades efficiently without chasing the market or triggering large volatility.
Addressing Price Imbalances
FVGs highlight areas where price has moved rapidly, leaving limited traded activity within the gap. Some traders view these zones as potential areas of imbalance and may observe whether price interacts with them again as part of broader market analysis. This interpretation focuses on how the market has behaved previously rather than suggesting that gaps must be revisited or that orders remain unfilled.
Liquidity zones for large orders
Liquidity zones associated with larger orders may appear within FVGs, which some traders monitor as areas that can attract market interest and contribute to understanding price activity.
High-probability trade setups
Fair value gaps are often reviewed as part of analysing potential trade setups, though they should be considered alongside broader market context and other factors require careful risk and reward consideration.
Alignment with smart money concepts
FVGs may be reviewed within the broader context of market dynamics, offering traders additional insight into how price is interacting with prevailing trends.
Minimizing slippage and maximizing control
By entering trades near FVGs, institutions avoid executing orders in thin markets, reducing slippage may support more consistent trade execution and offer additional context for evaluating pricing and risk parameters on large-volume trades.
Fair value gap trading strategy
FVG and order block confluence
The strategy combines FVG zones with nearby order blocks (areas where institutions previously placed large orders). When both align, it may highlight the relevance of the zone. Traders may reference the FVG, together with the order block, as part of their broader analysis rather than as a signal for entry and more reliable market direction confirmation.
Reversal trades from unfilled FVGs
When the price returns to an unfilled FVG from a previous impulse move, it can may indicate that sentiment is shifting. Traders often monitor price reactions within this imbalance zone as part of evaluating whether market conditions are changing, without assuming movement in the opposite direction will occur, using confirmation like candlestick patterns or divergence to validate the reversal setup.
Break-and-retest with FVG support or resistance
After the price breaks a key level, it often returns to retest the breakout area, which may align with a fair value gap. When price revisits the FVG area, traders may review whether it aligns with potential support or resistance levels as part of their broader analysis in the breakout direction.
Multi-timeframe FVG alignment for confirmation
The approach involves identifying FVGs across multiple timeframes (such as daily, 4H, and 1H). When FVGs appear in similar areas across different timeframes, traders may view this alignment as adding context to their understanding of prevailing market conditions. This confluence is typically incorporated into broader market analysis rather than interpreted as confirmation of any specific trend direction. Traders use this confluence for confident entries, tighter stop-losses, and improved trade accuracy through top-down analysis.
The verdict on fair value gap strategies in the forex market
Fair value gap trading provides a structure for reviewing areas of interest, interpreting market behaviour, and considering how risk and reward factors fit within a broader analysis. However, it requires strong price-action skills and multi-timeframe analysis and may produce false signals in low-volume or choppy markets, making discipline and context play an important role in how traders approach their decision-making.
Disclaimer: All material published on our website is intended for informational purposes only and should not be considered personal advice or recommendation. As margin FX/CFDs are highly leveraged products, your gains and losses are magnified, and you could lose substantially more than your initial deposit. Investing in margin FX/CFDs does not give you any entitlements or rights to the underlying assets (e.g. the right to receive dividend payments). CFDs carry a high risk of investment loss.