


A Break of Structure (BoS) marks a change in recent price movement. It may indicate that momentum is shifting, but it should be considered within broader market context and not relied on as a standalone basis for decisions, as outcomes can vary.
BoS offers a way to interpret recent market movement, but it does not indicate the probability of any particular outcome when combined with volume, confluence zones, and higher timeframe context.
Let's discuss in depth how traders can analyze market trend changes with BoS.
What is a break of structure (BoS) in trading?
A Break of Structure (BoS) in trading refers to a clear violation of a market's existing price structure. It often signals a continuation of the current trend. BoS occurs when the price breaks above or below a significant swing high or swing low, providing additional context when assessing potential changes in market behaviour.
In a bullish BoS, the price breaks above a previous lower high or resistance level, and recent movement suggests that buyers have been active, though future direction will depend on how price interacts with upcoming levels. This often follows a series of higher highs and higher lows.
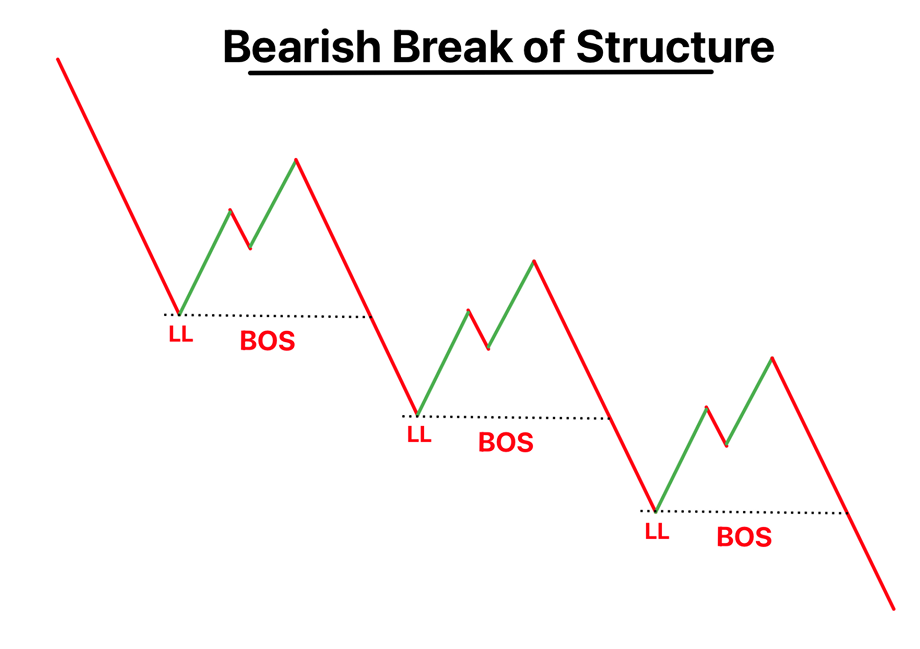
However, in a bearish BoS, the price drops below a previous higher low or support level, this sequence of lower highs and lower lows may indicate that selling activity has been present. Traders may consider this information within their broader analysis rather than treating it as a directional signal in line with the trend.
How to identify a valid BoS on the chart?
- Consider identifying the existing trend structure: Determine if the market is forming higher highs/lows or lower highs/lows. This trend context helps identify which structural point, once broken, may highlight an area that traders watch for potential structural changes, depending on how price develops.
- Spot the most recent swing high or low: Locate the latest significant high or low in the price action. These levels act as structural markers that, when breached, indicate a potential shift or continuation in trend.
- Wait for a clean break with a full-bodied candle: A valid BoS could be suggested by a full-bodied candle closing beyond the previous swing point, which may help avoid false breakouts
- Confirm with increased volume on the breakout: A noticeable rise in trading volume during a breakout may suggest heightened participation at that moment, offering additional context for how actively the market is engaging with the move.
- Use confluence from key support or resistance zones: If the BoS occurs near major support or resistance, it carries more weight. These zones act as decision areas, making the break more significant for future price direction.
- Validate with higher timeframe structure alignment: Check if the BoS aligns with the trend or structure of a higher timeframe. This top-down confluence improves reliability and avoids trading against the dominant market flow.
Why BoS is key to spotting trend continuation
BoS may offer context on how the prevailing trend is unfolding the current trend direction, though it does not confirm the strength of that trend.
A BoS reaffirms that the market continues to favor the prevailing trend. Breaking past previous swing points signals that bulls or bears remain in control and maintain ongoing directional momentum. This also helps traders align with the dominant side.
Helps filter out false reversals or pullbacks
A BoS may provide context on whether recent movement aligns with a broader shift or a short-term pullback. While the price may temporarily move against the trend, a lack of BoS indicates it's just a correction. Traders use this filter to avoid premature entries based on misleading reversal patterns.
Supports entry timing with higher probability setups
BoS may offer a structured signal that traders might use for entering trades with more precision. Once the structure confirms continuation, traders can plan entries at retracement zones, combining BoS with confluences like supply-demand areas or trendlines for more accurate setups.
Reinforces market structure for smart money traders
For smart money traders, BoS is a core concept that helps them interpret changes in market activity. It indicates that large players are continuing to drive prices in a direction, allowing retail traders to follow the footprint of stronger hands rather than trading against momentum. While larger participants may influence price movement, this should not be interpreted as guidance for individual traders.
Offers a framework for analysing potential continuation patterns
A BoS may draw attention to areas where continuation patterns could form, depending on how the price evolves, such as breakout trades or pullback entries. BoS can help traders define their strategy and improve consistency in their approach to entries, exits, and risk management.
How to trade forex with BoS
Note: The following guidance is provided solely for educational purposes and does not constitute personal advice or a recommendation to trade margin FX/CFDs.
-
Identify the prevailing market trend
Analyze price action on higher timeframes to determine if the market is trending up, down, or moving sideways. -
Mark recent swing highs and lows
Plot the key structural points where the price made notable highs or lows to understand current support and resistance. -
Wait for a clear break of structure
Traders may observe whether a candle closes beyond a previous swing high or low to understand how price is behaving around key levels. -
Confirm the break with volume or indicator support
Check for increased trading volume or alignment with indicators like RSI or MACD to verify the breakout's strength. -
Wait for a retest of the broken level
Let the price return to the broken support or resistance level to test it as a new zone of interest. -
Enter the trade at the retest
Look for multiple confirmations, like price action patterns or zone alignment, before placing the trade during the retest. -
Set stop-loss below or above the retest zone
Place the stop beyond the rest structure to protect against false breakouts or volatility spikes. - Define the target using the next structure
Traders might consider aiming for targets, such as the next swing point or risk-reward levels, based on market structure.
Avoid mistakes while trading forex with BoS
BoS may suggest trend continuation in forex trading. However, traders must avoid common mistakes like acting on weak or incomplete breaks, ignoring higher timeframe context, or trading without confirmation.
Traders may review factors such as volume, retests, and confluence with key zones when assessing whether a BoS is forming. Many also wait to see a clear shift in structure before making any decisions. When incorporated into broader analysis, a BoS can provide additional context on market behaviour, though it does not imply or guarantee any specific outcome or performance.
Disclaimer: All material published on our website is intended for informational purposes only and should not be considered personal advice or recommendation. As margin FX/CFDs are highly leveraged products, your gains and losses are magnified, and you could lose substantially more than your initial deposit. Investing in margin FX/CFDs does not give you any entitlements or rights to the underlying assets (e.g. the right to receive dividend payments). CFDs carry a high risk of investment loss.