


Navigating the markets without the right tools can be frustrating–outdated data, cluttered charts, and missing key trade signals at the worst moments. That’s where TradingView comes in.
TradingView is a powerful charting platform designed for traders of all levels. It provides real-time market data, advanced charting tools, and a range of technical indicators for in-depth analysis.
In this guide, we’ll break down TradingView’s top features and more.
Top features of TradingView
How to get started with TradingView
- Create an account on TradingView using an email or social login.
- After signing up, log in to the TradingView dashboard to access the platform.
- Select the market or asset one wants to analyze, such as stocks, forex, or crypto.
- Customize the chart layout by choosing the timeframes and chart types that suit the analysis style.
- Add technical indicators like RSI, MACD, or moving averages to assess market trends.
- Set price or indicator alerts to get notifications when certain levels are reached.
- Use the stock, forex, or crypto screeners to filter assets based on specific criteria.
- Follow experienced traders and view their shared ideas to gain insights.
- Save the customized chart layouts for quick access in the future.
- Consider upgrading to a paid plan for more advanced features and tools.
*This is an example only to enhance a consumer's understanding of the strategy being described above and is not to be taken as Blueberry providing personal advice.
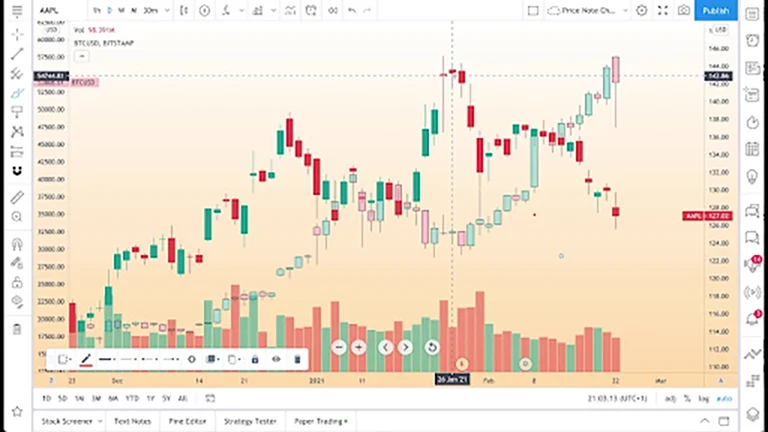
How to use TradingView charts
1. Log in to TradingView
The user should first sign in to their TradingView account using their credentials.
2. Search for the asset or market
Next, they can use the search bar to find the asset or market they wish to analyze, such as stocks, forex, or cryptocurrencies.
3. Click on the 'Chart' option
After selecting the asset, they should click on the Chart option to open the charting interface. Select the desired chart type.
The user can choose from different chart types, including candlestick, bar, or line charts, depending on their analysis preference.
4. Adjust the time frame for the analysis
Finally, the user should set the appropriate time frame for their analysis, ranging from seconds to months, based on whether they are analyzing short-term or long-term trends.
Top TradingView tools to know
Compare symbol
TradingView’s compare symbol tool allows users to compare assets. It overlays price charts for different assets on the same screen. Traders can identify correlations or divergences easily. It helps in analyzing market trends more effectively. By comparing symbols, users gain better market insights.
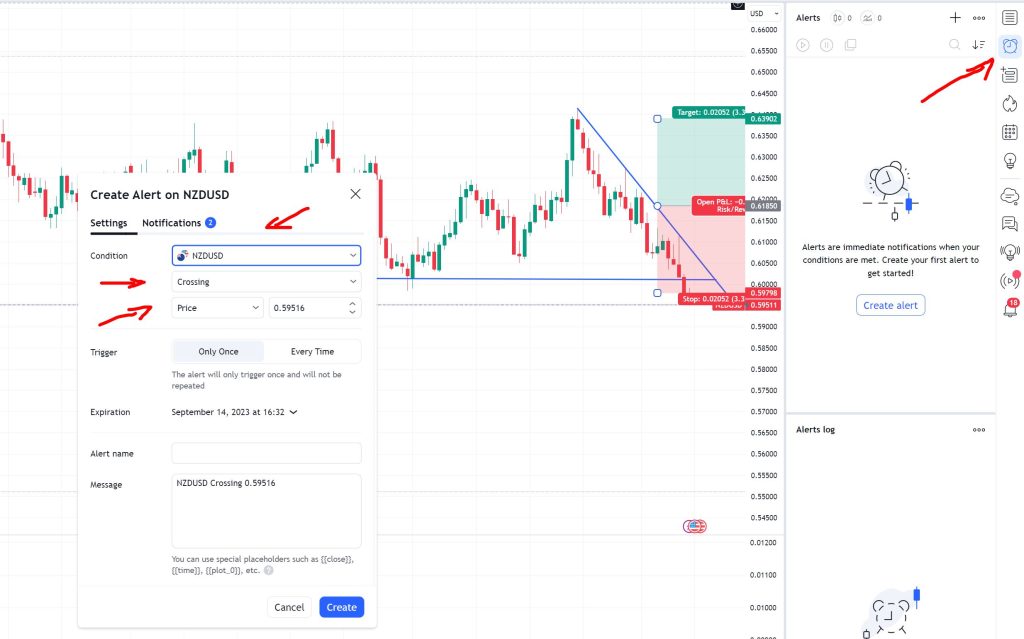
Price alert
Price alerts notify traders when an asset reaches a specific level. Users can set alerts for price movements, trends, or technical indicators. It keeps traders updated in real-time and prevents missed opportunities.
Shapes
Shapes in TradingView help users highlight key areas. They include rectangles, circles, and lines to mark price zones. Shapes are useful for visualizing support, resistance, or other chart patterns. Traders can adjust and move shapes as needed for a better technical analysis.
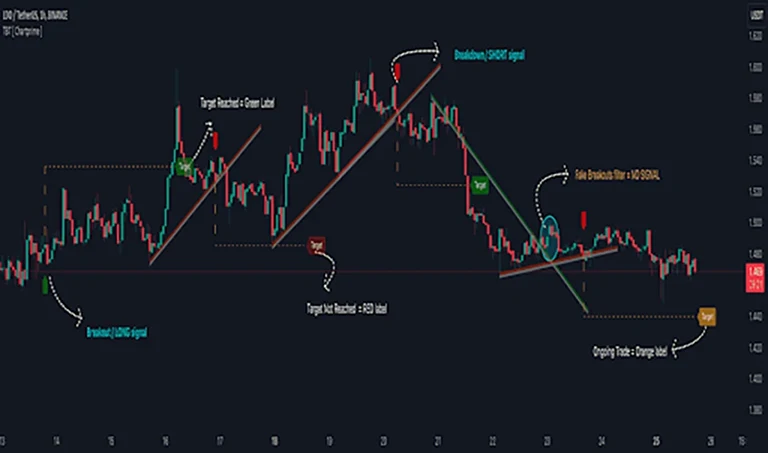
Trendline
Trendlines are important for identifying price direction on charts. Users draw lines to connect highs and lows. Trendlines help identify support, resistance, and potential breakout points. They are useful in recognizing market trends over time.
Text tools
Text tools allow traders to annotate charts with notes. Traders can add labels, comments, or explanations directly on the chart. This helps to document insights and trading strategies. Text tools also improve communication in shared charts. They are useful for both personal and collaborative analysis.
Waves/cycles
Waves and cycles help traders identify repetitive market patterns. They analyze price movement based on historical cycles and waves. This tool predicts market behavior and potential turning points. Traders use waves to identify trends and reversals in the long-term.
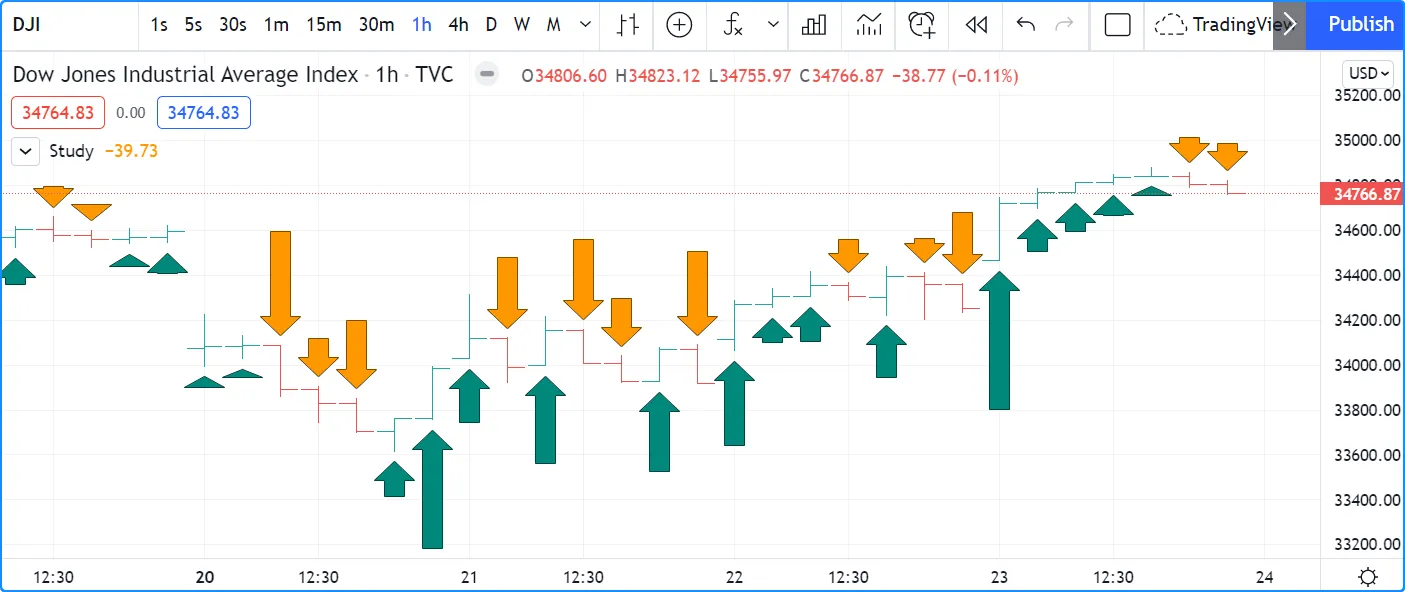
Arrows/graphics
Arrows and graphics are used to indicate price direction. Traders use arrows to mark entry, exit, or target points. Graphics like lines and symbols help visualize strategies clearly. This tool is important for illustrating trade setups. It simplifies communication and decision-making on charts.
How to add and manage indicators on TradingView
- Open the TradingView chart for the asset one wants to analyze.
- Next, click the Indicators tab located at the top of the chart.
- Use the search bar to find the specific indicator one wants to use, such as RSI, MACD, or moving averages.
- Click on the selected indicator from the list to add it directly to the chart.
- To customize the indicator, click the settings icon next to the indicator's name on the chart.
- If one no longer needs the indicator, they can click the x button next to its name to remove it.
- Finally, save the chart layout with all added indicators for future reference by clicking the Save icon.
*This is an example only to enhance a consumer's understanding of the strategy being described above and is not to be taken as Blueberry providing personal advice.
Top TradingView tips for beginners
Use default chart layout
Start with the default layout to keep things simple. It provides a clean view for beginners, allowing focus on essential chart elements without distractions.
Experiment with drawing tools
Try out the drawing tools like trendlines, shapes, and text. These tools help highlight important chart patterns and price levels, making it easier to analyze market movements.
Join the TradingView community
Engage with the TradingView community to gain insights from experienced traders. Follow ideas, share strategies, and ask questions to improve learning and expand one’s knowledge.
Save chart layouts
Save the custom chart setups to avoid reconfiguring them each time, allowing traders to quickly load one's preferred layout for consistent analysis and decision-making.
Practice with paper trading
Use TradingView's paper trading feature to practice strategies in real market conditions without real capital. It helps build confidence and experience before a trader trades live.
Maximize trading potential with TradingView
TradingView is a tool for traders of all levels. Its charting features, customizable layouts, and community-driven insights make it an ideal platform for analyzing markets and practicing strategies.
Disclaimer: All material published on our website is intended for informational purposes only and should not be considered personal advice or recommendation. As margin FX/CFDs are highly leveraged products, your gains and losses are magnified, and you could lose substantially more than your initial deposit. Investing in margin FX/CFDs does not give you any entitlements or rights to the underlying assets (e.g. the right to receive dividend payments). CFDs carry a high risk of investment loss.