


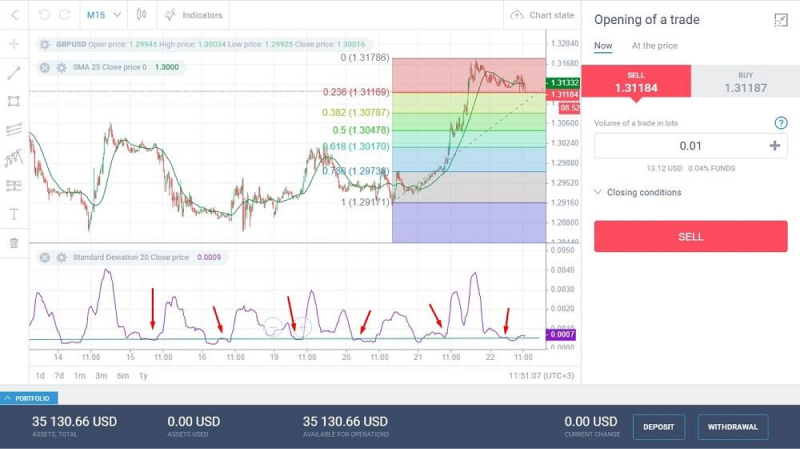
Traders in forex markets can incorporate the Raff Regression indicator as it depicts trends, providing a visual guide through its linear regression line and dynamically adjusted standard deviation bands.
Let’s take an in-depth look at the Raff Channel indicator:
Defining the Raff Channel indicator
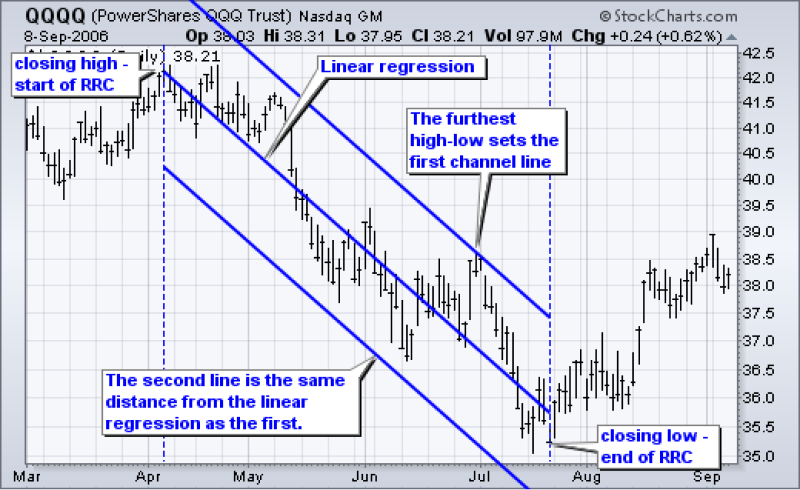
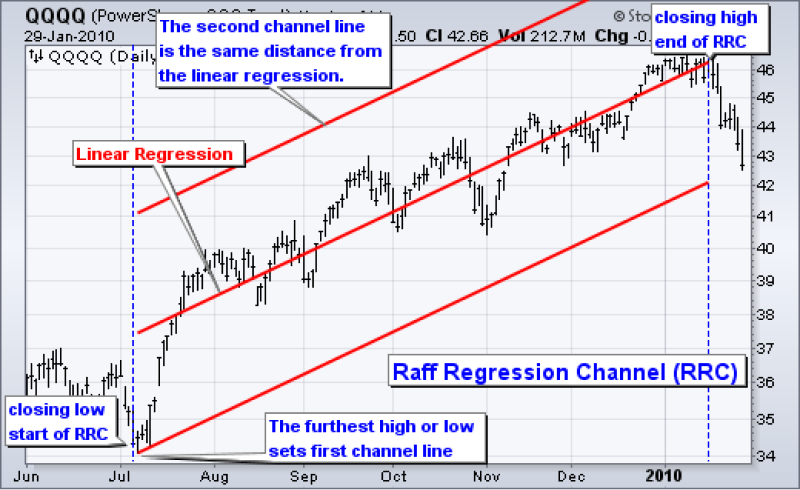
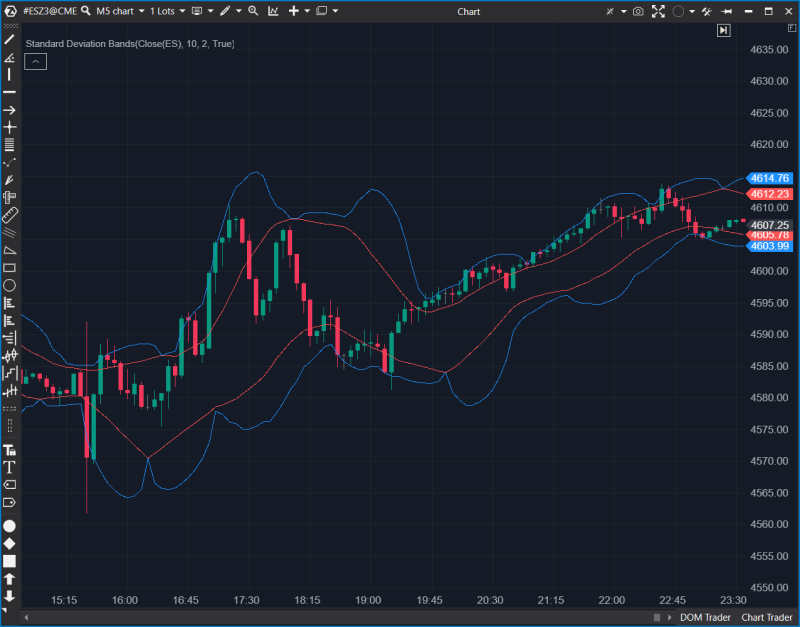
The Raff Regression Channel is a technical analysis tool used in trading to identify trends and potential support or resistance levels. The Raff Regression Channel is named after its creator, Gilbert Raff. It is a linear regression channel that plots a single line in the middle, with parallel lines on either side representing standard deviations from the linear regression line.
How does the Raff Channel indicator work?
The Raff Channel indicator combines linear regression and standard deviation to create a channel on a price chart. This tool helps traders identify trends, measure volatility, and recognize potential reversal points.
Here's a breakdown of its components:
Linear regression calculation
The central line of the Raff Channel is a linear regression line calculated over a specific period. This line represents the right fit through the historical price data. The linear regression line also helps identify the primary trend by capturing the general direction of price movements.
Determine standard deviation
The indicator calculates the standard deviation of the price data. This helps measure the volatility of the market during the specified period.
Set standard deviation bands
Two outer bands are plotted parallel to the linear regression line. A specified number of standard deviations determines the distance between these bands and the central line. Wider bands indicate higher volatility, while narrower bands suggest lower volatility.
Trend identification
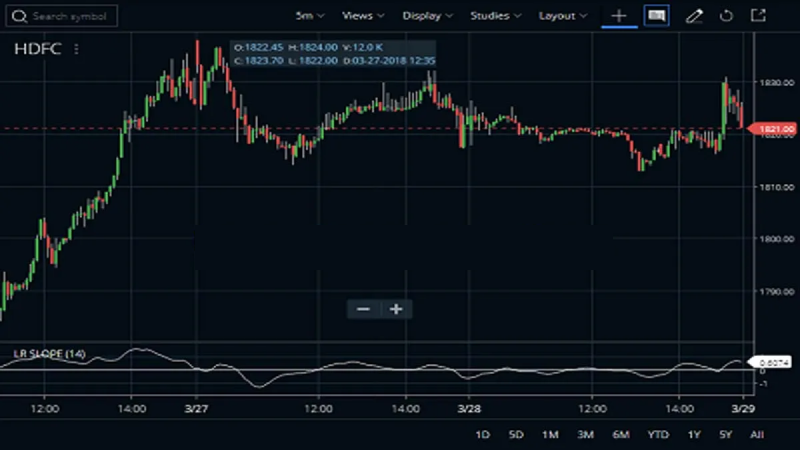
The slope of the linear regression line is used to identify the overall trend in the price movement. An upward slope suggests an uptrend, while a downward slope suggests a downtrend.
Support and resistance levels
The outer bands act as dynamic support and resistance levels. If the price approaches or touches the upper band, it may indicate overbought conditions, suggesting a potential reversal or pullback. If the price approaches the lower band, it may indicate oversold conditions, suggesting a potential reversal to the upside.
Monitoring breakouts
Traders watch for breakouts beyond the Raff Channel. Prices moving outside the bands may signal potential trend changes or significant price movements.
Confirmation with other indicators
Traders often use the Raff Channel in conjunction with other technical indicators or chart patterns to confirm signals and enhance their overall analysis.
Adjusting parameters
Depending on market conditions and trading preferences, traders may adjust the parameters of the Raff Channel, such as the period for calculating the linear regression or the number of standard deviations for the bands.
Advantages and risks of the Raff Channel Indicator:
Advantages
- Adaptability to different timeframes: The Raff Channel Indicator can be applied to various timeframes, making it adaptable for both short-term and long-term traders.
- Support and resistance levels: The outer bands of the Raff Channel act as support and resistance levels, providing traders with potential reversal or continuation signals.
- Visual clarity: The linear regression line and parallel bands offer a visually clear representation of the trend, making it easy for traders to interpret price movements.
- Combination with other indicators: Traders often use the Raff Channel with other technical indicators or chart patterns to enhance their analysis and confirm signals.
Risks
- Market whipsaws: Rapid and unpredictable price movements, known as whipsaws, can result in false signals, leading to potential losses for traders relying solely on the Raff Channel.
- Subjectivity in channel placement: The placement of the channel may vary depending on individual interpretation, leading to subjective analysis. This subjectivity can introduce inconsistencies in trading decisions.
- Limited in sideways markets: The Raff Channel is most effective in trending markets. The indicator may provide less reliable signals in sideways or ranging markets where there is no clear trend.
- Historical data dependency: The accuracy of the Raff Channel is dependent on historical price data. Sudden changes in market conditions or unexpected events may not be fully reflected in the historical data, potentially impacting the effectiveness of the indicator.
How to trade with the Raff Channel Indicator
Understanding how to utilize the Raff Channel in trading involves a systematic approach where traders can confirm signals with other indicators and monitor price movements relative to the standard deviation bands for potential overbought or oversold conditions. Here’s a stepwise guide to trade with the Raff Channel indicator:
Identify the trend
Use the slope of the linear regression line to determine the overall trend. An upward slope indicates an uptrend, while a downward slope indicates a downtrend.
Wait for touches or breakouts
Monitor price movements in relation to the outer bands of the Raff Channel. Look for touches or breakouts beyond these bands.
- A touch of the upper band may signal potential overbought conditions and a reversal or pullback, signaling traders to enter short trades.
- A touch of the lower band may signal potential oversold conditions and a reversal to the upside, signaling traders to enter long trades.
Confirm with other indicators
Consider using other technical indicators or chart patterns to confirm signals generated by the Raff Channel. This can enhance the reliability of your analysis.
Look for trend reversals
Changes in the slope of the linear regression line or breakouts beyond the Raff Channel can indicate potential trend reversals. Be prepared to adjust your trading strategy accordingly.
Navigating forex trades with the Raff indicator
Raff indicator's ability to signal trend reversals and compatibility with other indicators enhances overall analysis, empowering traders to make informed decisions amidst the complexities of the forex market. However, users should exercise caution, supplementing their signals with comprehensive risk management strategies.
Disclaimer: All material published on our website is intended for informational purposes only and should not be considered personal advice or recommendation. As margin FX/CFDs are highly leveraged products, your gains and losses are magnified, and you could lose substantially more than your initial deposit. Investing in margin FX/CFDs does not give you any entitlements or rights to the underlying assets (e.g. the right to receive dividend payments). CFDs carry a high risk of investment loss.