


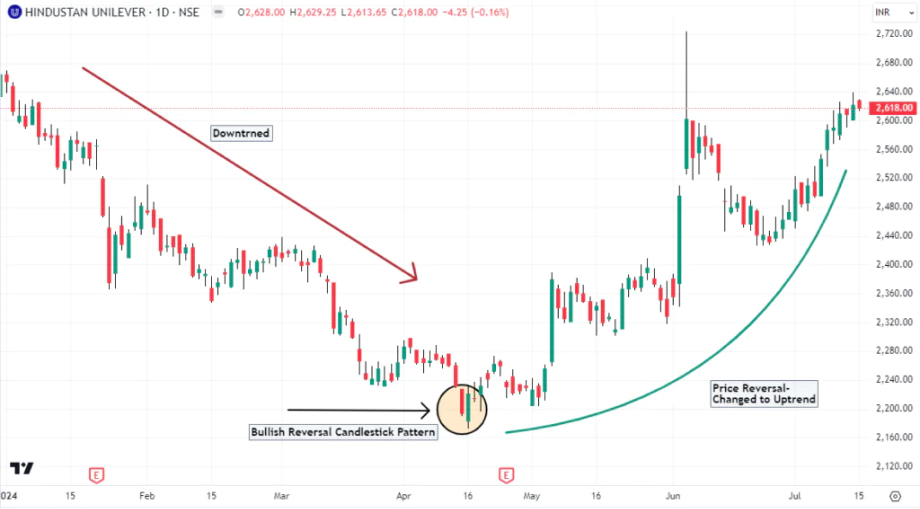
Reversal patterns hint when a trend is about to change before the rest of the market catches on. In trading, where timing can make or break a trade, spotting these clues can give traders a decisive edge. Whether it’s hammer signaling bulls are back or a shooting star warning of bears’ strength, reversal patterns help traders anticipate market turning points.
This article will cover how reversal candlestick patterns help recognize market turning points.
What are reversal candlestick patterns?
Reversal candlestick patterns are specific formations that suggest a possible change in the direction of the current price trend. The change is from a bullish to a bearish market. Traders use these patterns to anticipate market turning points and enter or exit positions at optimal times.
What do reversal patterns identify?
Trend exhaustion
Reversal patterns often signal that the current trend is losing strength. For instance, if a bearish Japanese candlestick pattern, such as a shooting star, appears in an uptrend, it suggests that bulls are struggling to push prices higher.
Similarly, a bullish pattern like the hammer indicates that bears may be losing control in a downtrend. This loss of momentum in the prevailing trend is a key indicator that a reversal could be on the horizon.
Support and resistance reactions
Reversal patterns frequently emerge near important support or resistance levels. When a bullish reversal pattern forms at a support zone, it suggests that bulls are defending that price level and may start to drive prices upward.
Conversely, a bearish reversal at resistance implies that bears are stepping in, rejecting higher prices. This behavior confirms that the market respects these zones and is reacting accordingly.
Sentiment shift
Candlestick reversal patterns reflect a shift in trader sentiment. For example, a bullish engulfing pattern shows a sudden increase in long pressure. This suggests that the mood has shifted from pessimism to optimism.
On the other hand, a bearish engulfing pattern indicates rising fear or exit interest as bulls retreat. This change in market psychology is what ultimately drives the reversal.
Entry and exit zones
Traders use reversal patterns to time their entries and exits. If a bullish pattern appears after a prolonged downtrend, it may indicate a potential opportunity to consider a long position.
Similarly, if a bearish pattern shows up after a strong uptrend, it may indicate a potential opportunity to consider exiting or monitoring for short opportunities. These patterns help traders act with more confidence and precision by aligning their decisions with potential trend changes.
How to confirm a candlestick reversal pattern?
Note: The following guidance is provided solely for educational purposes and does not constitute personal advice or a recommendation to trade margin FX/CFDs.
1. Identify the prevailing trend
Start by checking if the market is in a clear uptrend or downtrend. Reversal patterns are meaningful only when they appear after a strong directional move. If the trend is unclear or sideways, the pattern may not be reliable.
2. Look for support or resistance zones
Check if the reversal pattern is forming near a significant support (for bullish reversals) or resistance (for bearish reversals) level. These zones strengthen the likelihood of a genuine price reversal.
3. Wait for volume confirmation
Confirm the pattern with increased trading volume. Higher volume during the reversal indicates stronger conviction and improves the pattern’s reliability.
4. Use technical indicators
Support the pattern with technical tools like RSI, MACD, or moving averages. For example, if the RSI is oversold and a bullish reversal appears, it reinforces the signal.
5. Analyze multi-timeframe alignment
Check if the pattern aligns with trends or signals on higher timeframes. A reversal on a 1-hour chart backed by a trend on the daily chart adds strength to the setup.
6. Watch for follow-through candles
Wait for a confirming candle that continues in the direction of the reversal. This follow-through validates the shift in trend and reduces false signals.
7. Avoid signals during sideways markets
Don’t rely on reversal patterns when the market is moving sideways. In such cases, patterns are less reliable and often result in whipsaws instead of true reversals.
Top bullish reversal candlestick patterns to know
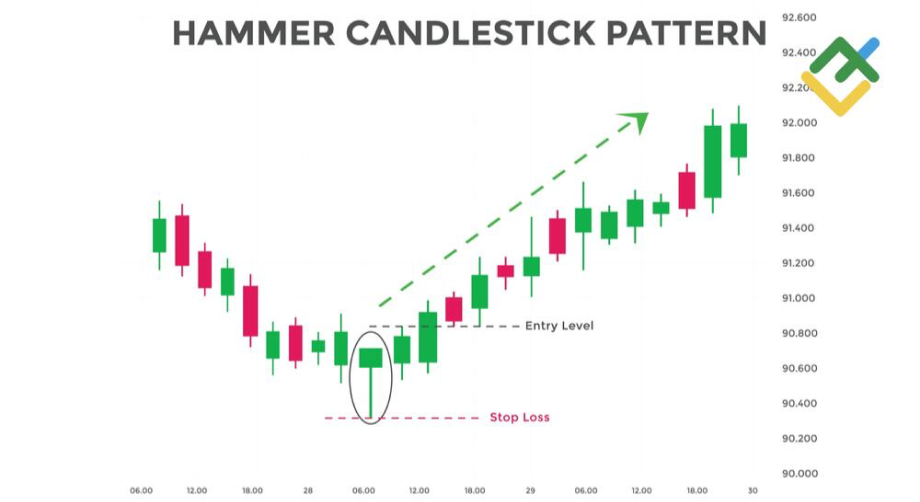
Hammer
The hammer forms after a downtrend and signals a potential bullish reversal. It has a small real body near the top with a long lower wick, showing that bears pushed the price down, but bulls regained control before the close. This price action may indicate a reduction in exit pressure.
A confirmation with a bullish candle on the next day adds reliability. It often appears near support levels and is more effective when combined with rising volume or momentum indicators.
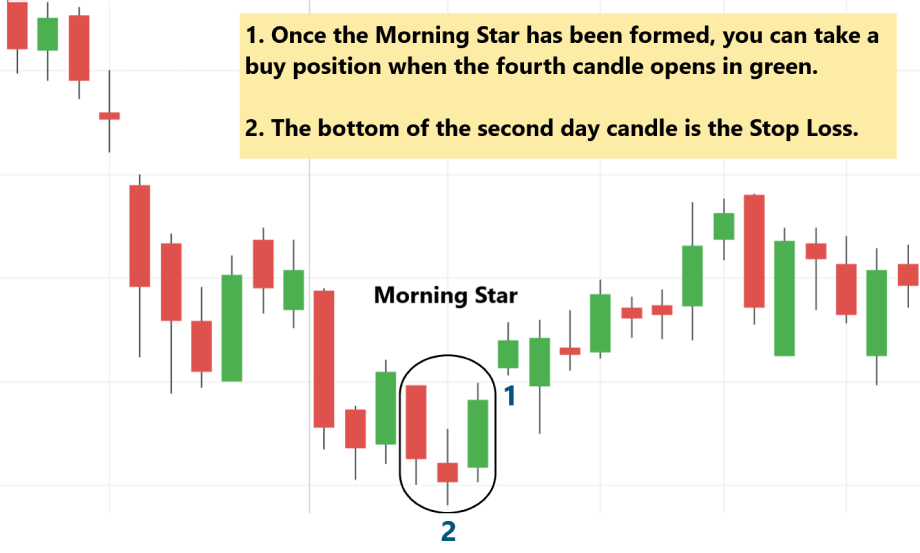
Morning star
The morning star is a three-candle pattern signaling a trend reversal from bearish to bullish. It begins with a long, bearish candle, followed by a small-bodied candle (showing indecision), and ends with a strong, bullish candle.
The pattern reflects a shift in sentiment as bears lose strength and bulls take over. It may be more reliable when it forms at a support zone, with confirmation through increased volume or bullish indicators like RSI turning upward.
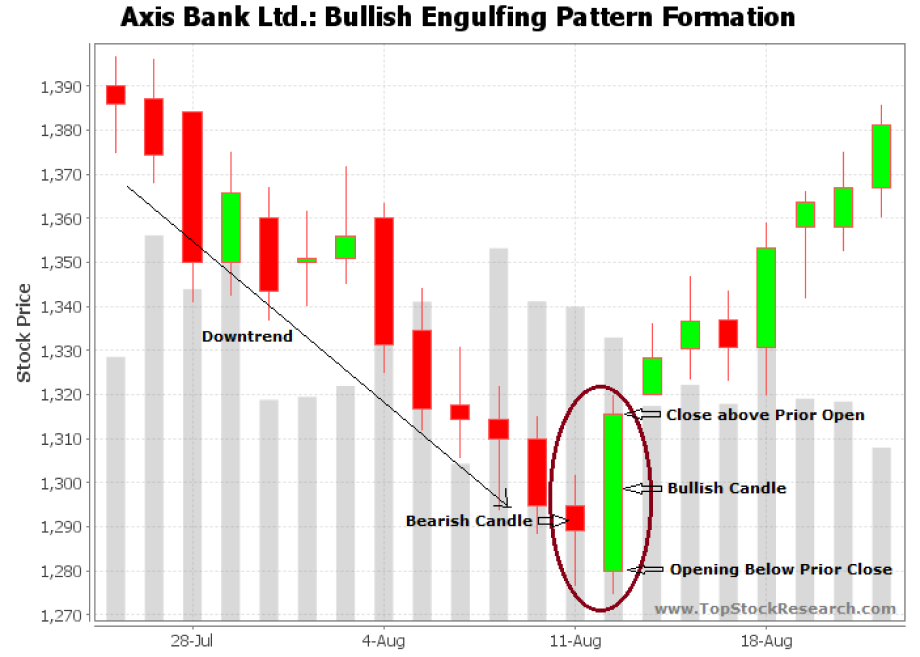
Bullish engulfing
A bullish engulfing pattern occurs when a small bearish candle is followed by a larger bullish candle that completely engulfs it. This pattern forms after a downtrend and shows that bulls have overwhelmed bears.
The strong upward momentum indicated by the second candle makes this a reliable signal for trend reversal. It becomes more powerful if it appears near support, is accompanied by high volume, or occurs after an extended period of exit pressure.
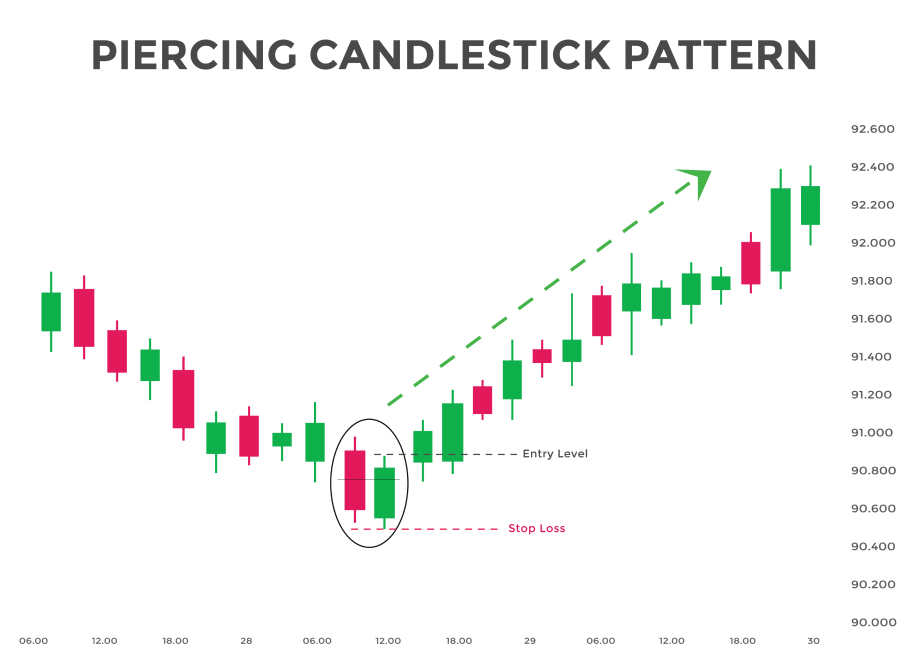
Piercing pattern
The piercing pattern is a two-candle bullish reversal pattern seen at the end of a downtrend. The first candle is long and bearish, while the second opens below the previous low and closes above the midpoint of the first candle.
Such a shift in momentum may indicate that bulls are gaining momentum. A confirmation candle with additional bullish movement may reinforce the pattern. This pattern is often observed near key support levels, particularly when accompanied by increasing volume.
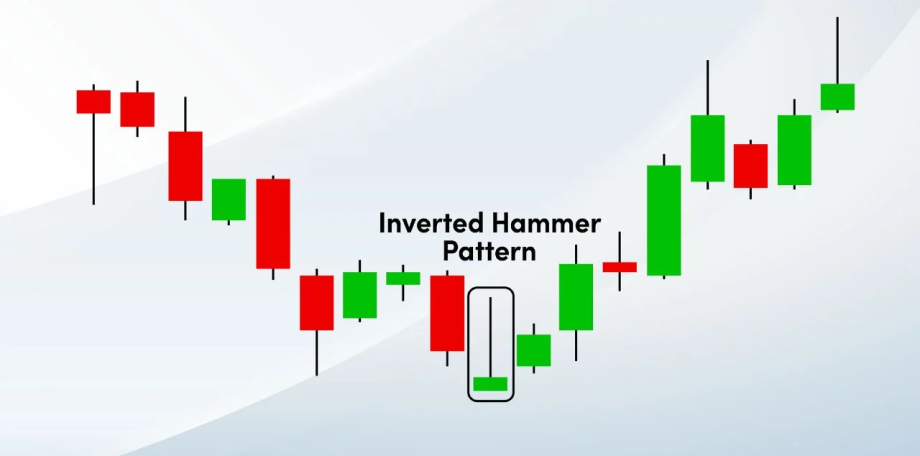
Inverted hammer
The inverted hammer appears after a downtrend and has a small real body at the bottom with a long upper wick. This indicates that bulls attempted to push the price higher, though it closed near the opening.
Despite the weak close, the long upper wick signals potential buying pressure. It requires confirmation with a strong bullish candle in the next session. The inverted hammer is more meaningful near support zones or when supported by bullish indicators.
Top bearish reversal candlestick patterns to know
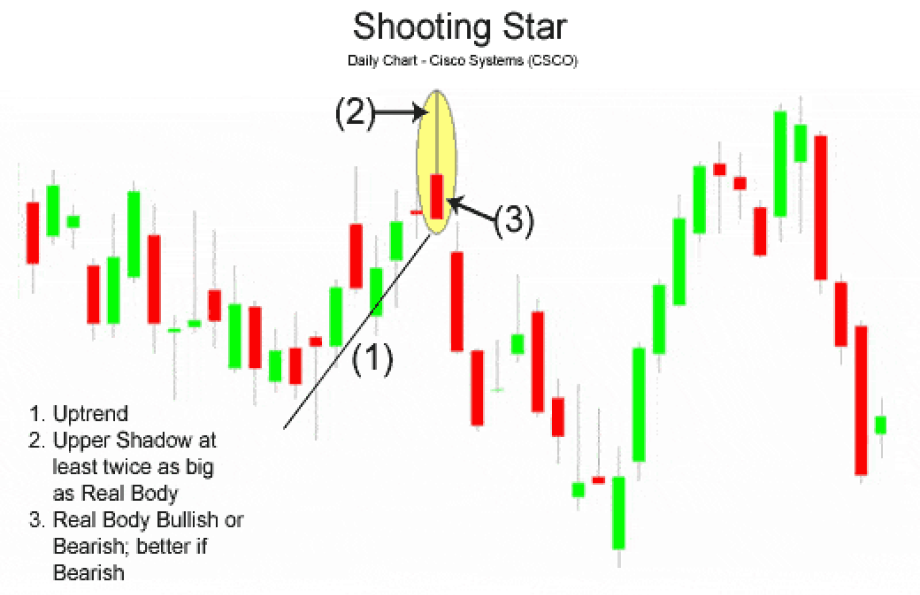
Shooting star
The shooting star forms after an uptrend and signals a potential bearish reversal. It has a small real body near the bottom and a long upper wick, showing that bulls drove the price higher but failed to maintain momentum, and bears pushed it back down.
The rejection of higher prices reflects weakening entry pressure. The pattern becomes stronger when it appears near resistance levels and is followed by a bearish candle with higher volume or bearish technical confirmation.
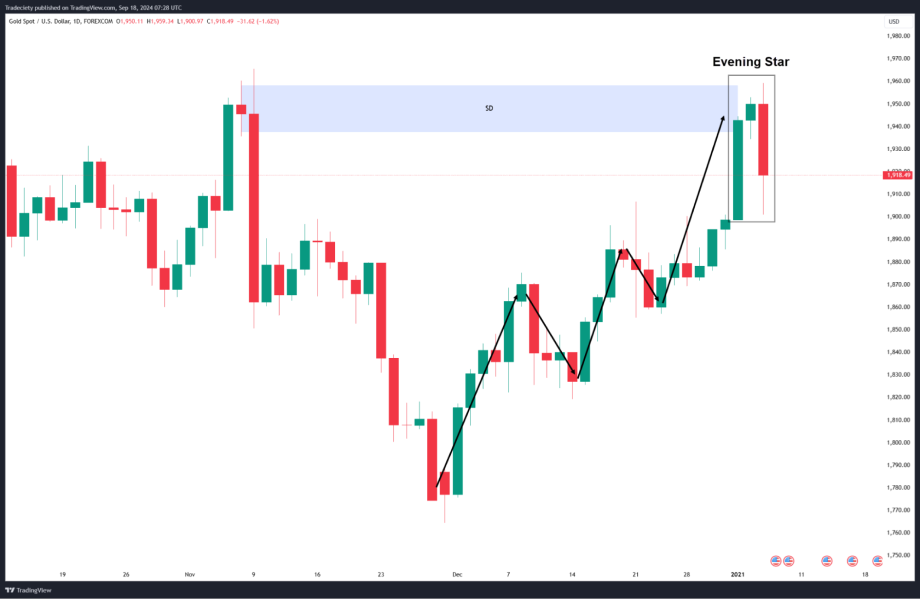
Evening star
The evening star is a three-candle pattern that signals a bearish reversal after an uptrend. It starts with a strong bullish candle, followed by a small-bodied candle that shows hesitation, and ends with a large bearish candle that closes well into the first candle’s body.
This formation indicates that entry pressure has peaked and bears are taking control. The evening star is especially effective in resistance zones and is confirmed by declining volume or bearish indicators like MACD.
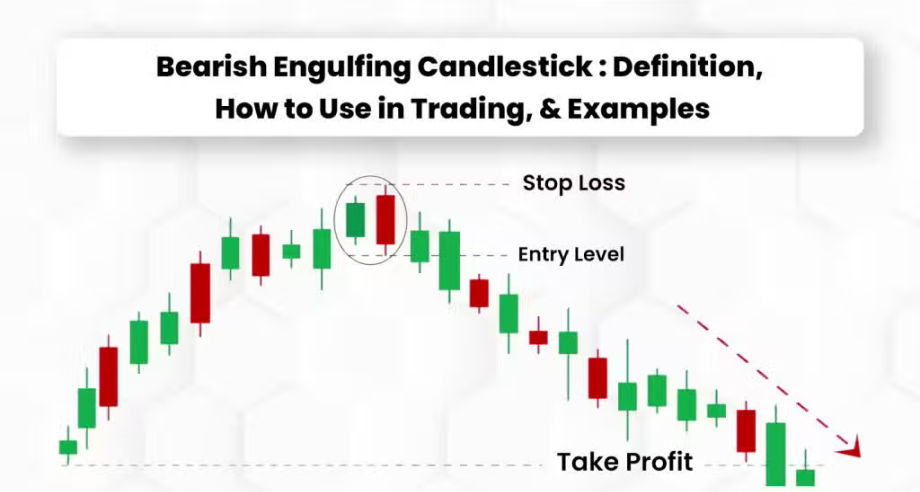
Bearish engulfing
A bearish engulfing pattern consists of a small bullish candle followed by a larger bearish candle that fully engulfs it. It appears after an uptrend and signals a strong shift in sentiment as bears take over.
This pattern is a sign of increased exit pressure and is often followed by further declines. It gains strength if accompanied by a high volume or if it forms near a resistance level. Traders often wait for confirmation before taking positions.
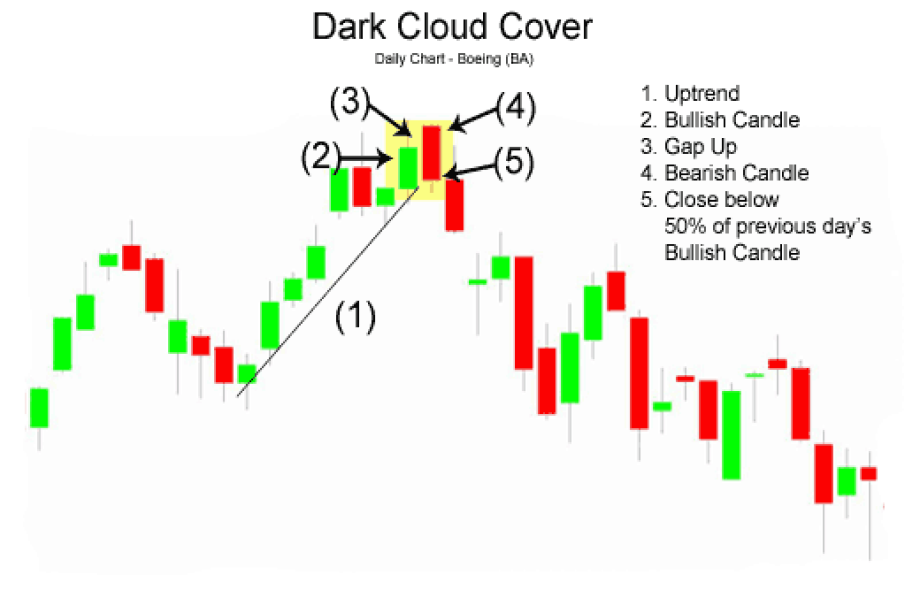
Dark cloud cover
The dark cloud cover is a two-candle bearish reversal candlestick pattern. The first candle is long and bullish, followed by a bearish candle that opens above the previous high but closes below its midpoint.
This shift shows a rejection of higher prices and rising exit pressure. It appears after an uptrend and is stronger when seen near resistance levels. Confirmation may come from a subsequent bearish candle and additional technical signals, such as a weakening RSI.
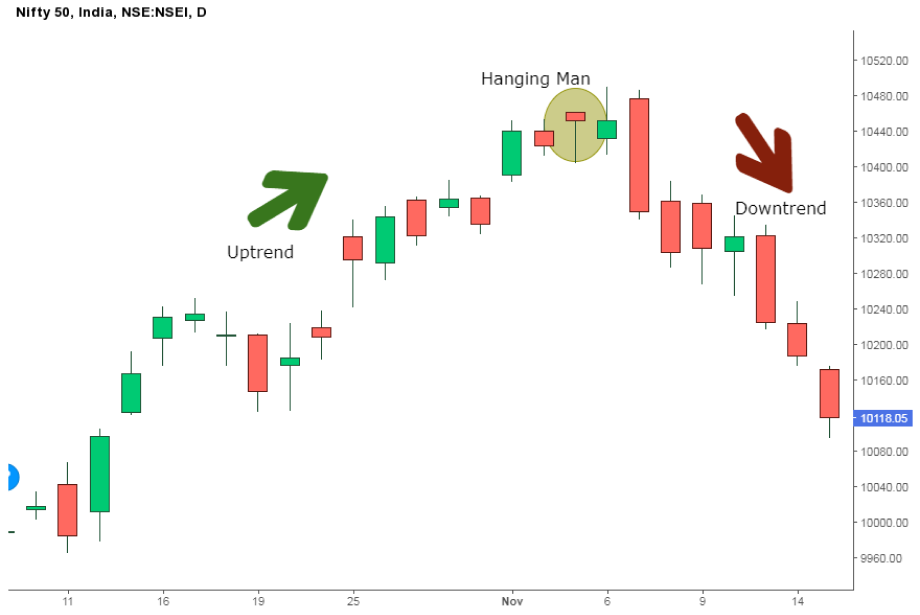
Hanging man
The hanging man appears at the end of an uptrend and resembles a hammer but has bearish implications. It has a small real body at the top with a long lower wick, showing that although bulls maintained control, there was significant exit pressure during the session.
It signals potential weakness in the uptrend. A bearish candle on the following day confirms the reversal. It is also more reliable when found at a resistance level or backed by rising volume.
Tips to trade reversal candlestick patterns
- Always trade in the direction of the higher timeframe trend: Aligning reversal setups with the dominant higher timeframe trend increases trade probability and filters out weak or counter-trend signals.
- Use indicators like RSI or MACD for added confidence: Combining reversal patterns with indicators like RSI or MACD helps confirm momentum shifts and adds confluence to trade decisions.
- Focus on quality setups over quantity: Prioritize clear, high-probability reversal patterns near key levels instead of trading every setup to maintain better accuracy and risk management.
Stepwise guide to trade forex with reversal patterns
Note: The steps outlined below are for educational purposes only and should not be considered personal advice or a recommendation to trade margin FX/CFDs.
Identify the existing trend
The trader should begin by analyzing the current market direction using price action or tools like moving averages. Reversal patterns are only effective when they follow a clear uptrend or downtrend.
Mark key support and resistance zones
Key support and resistance levels must be plotted on the chart. These zones increase the reliability of reversal patterns as they highlight areas where the price is likely to react.
Spot a valid reversal candlestick pattern
The trader needs to look for established patterns, such as the hammer, shooting star, engulfing, or morning or evening star. The pattern should be distinct and appear after a significant price move.
Wait for confirmation
It's important not to enter solely based on the pattern. The trader should wait for a follow-through candle or a spike in volume to confirm that the reversal is genuine.
Use a confluence of indicators
The trader can use additional tools like RSI, MACD, or Fibonacci levels to strengthen the setup. When multiple indicators align, the reversal signal becomes more trustworthy.
Define entry, stop-loss, and take-profit
The entry point should be set just above or below the confirmation candle. Stop-loss orders must be placed beyond the pattern’s wick, and take-profit targets should follow a sound risk-reward strategy.
Manage the trade actively
After entering the trade, the trader should monitor price movements closely. Active trade management includes adjusting stop-losses, booking partial gains, or using trailing stops to lock in gains.
The bottom line on using reversal candlestick patterns
Reversal patterns in forex trading help with early entry into trend changes, improved risk-reward ratios, and better decision-making when combined with support and resistance levels, as well as indicators. They help traders identify potential turning points, allowing for timely exits or fresh entries.
However, these patterns also come with challenges. False signals can occur, especially in sideways or low-volume markets, leading to premature trades. Reversal setups require confirmation and context, making them unsuitable in isolation. Hence, discipline, proper risk management, and pattern recognition skills are essential to trade them properly.
Disclaimer: All material published on our website is intended for informational purposes only and should not be considered personal advice or recommendation. As margin FX/CFDs are highly leveraged products, your gains and losses are magnified, and you could lose substantially more than your initial deposit. Investing in margin FX/CFDs does not give you any entitlements or rights to the underlying assets (e.g. the right to receive dividend payments). CFDs carry a high risk of investment loss.