


The triple screen trading system is an advanced strategy designed for experienced traders looking to refine their trading approach.
By using three distinct timeframes, the system provides accurate signals for entry and exit points. Its complexity requires a deep understanding of market trends and discipline, making it ideal for those with intermediate or advanced trading experience.
Let's discuss the triple screen trading system in depth.
This is an example only to enhance a consumer's understanding of the strategy being described above and is not to be taken as Blueberry Markets providing personal advice.
What is the triple screen trading strategy?
The triple screen trading strategy is a multi-timeframe approach developed by Dr. Alexander Elder. It uses three screens or charts together to filter out false signals. It combines trend-following with precise entry points, increasing the probability of accurate trades and improving trade accuracy.
How does the triple screen trading system work?
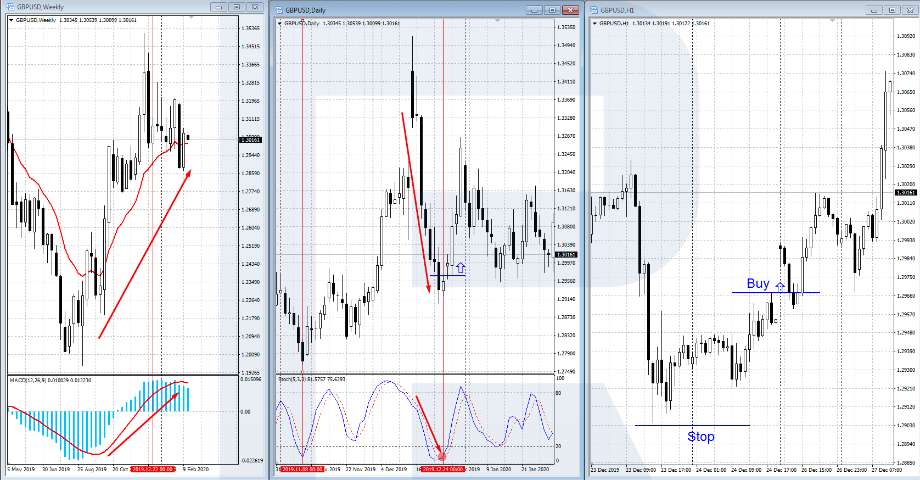
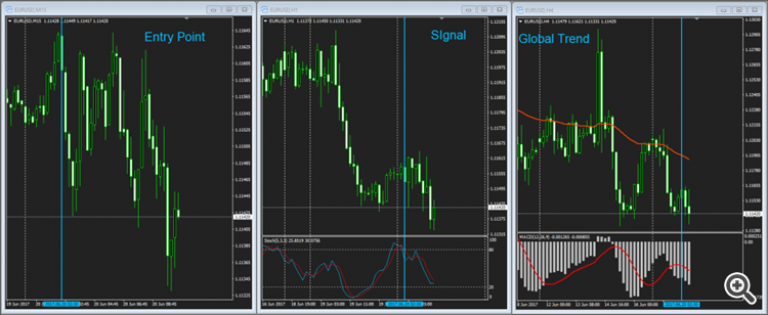
The triple screen trading system combines three different timeframes to provide a comprehensive market view. Here's how the three screens function –
-
First screen (long-term trend chart): This screen helps identify the dominant market trend. It typically uses a daily or weekly chart to establish whether the market is uptrend, downtrend, or sideways. Traders will only look for long signals in an uptrend and short signals in a downtrend.
-
Second screen (medium-term trend chart): This screen looks for entry signals within the context of the trend established on the first screen. It often uses a 4-hour or hourly chart. Here, traders look for signals that align with the prevailing trend, such as breakouts or pullbacks.
-
Third screen (short-term trend chart): The final screen is for precise timing. It uses a 15-minute or 5-minute chart to execute trades. This screen helps traders refine their entry points by pinpointing the right time to enter the market. It uses trend-following indicators like oscillators to time entries accurately.
Opportunities and risks with the triple screen trading strategy
Opportunities
-
Accurate trend identification across timeframes: By examining long, medium, and short-term charts, traders can confirm the market's prevailing trend
-
Improved entry and exit points: The strategy improves timing for entering and exiting trades. This leads to an increase in the potential for better gain
-
Filtered noise for clearer signals: With multiple screens, the strategy reduces market noise and provides clearer, more reliable trading signals
-
Higher probability of accurate trades: Combining different timeframes increases the likelihood of identifying valid trade opportunities
Risks
-
Delayed execution in fast markets: The strategy's multi-timeframe approach may cause delayed entries. This particularly happens in volatile, fast-moving markets
-
Overreliance on historical data: The strategy's heavy dependence on past price data may not always predict future movements, especially in changing market conditions
-
Potential for false signals in sideways markets: The strategy may generate conflicting signals in choppy or sideways financial markets. This can lead to incorrect trades
-
Increased complexity and overtrading: The complexity of managing three screens can overwhelm traders. This can lead to overtrading or confusion, which may result in losses
Top technical indicators to use with the triple screen trading
Force index
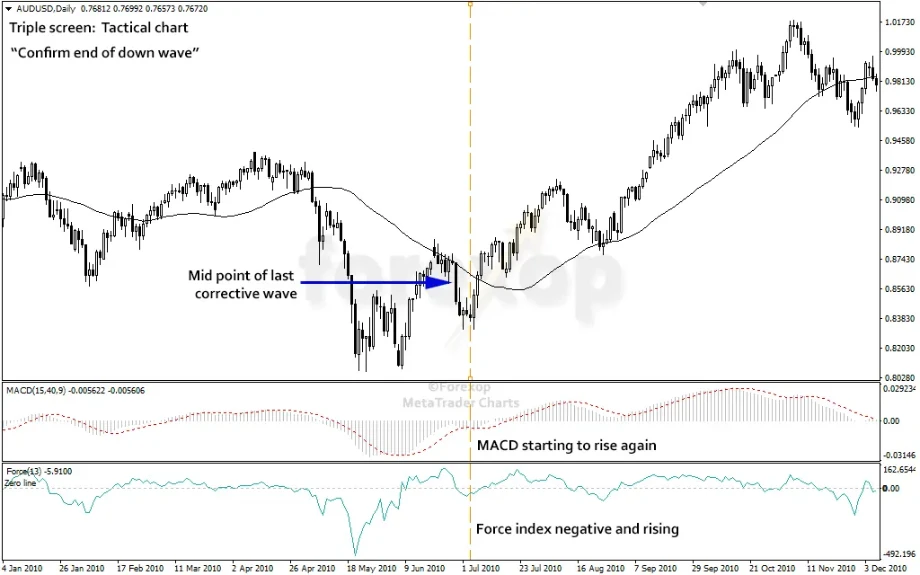
The force index combines price movement and volume to measure the strength behind a trend. The triple screen identifies the strength of trends across timeframes. It also helps confirm long or short signals, clearly indicating potential market momentum.
Elder-ray
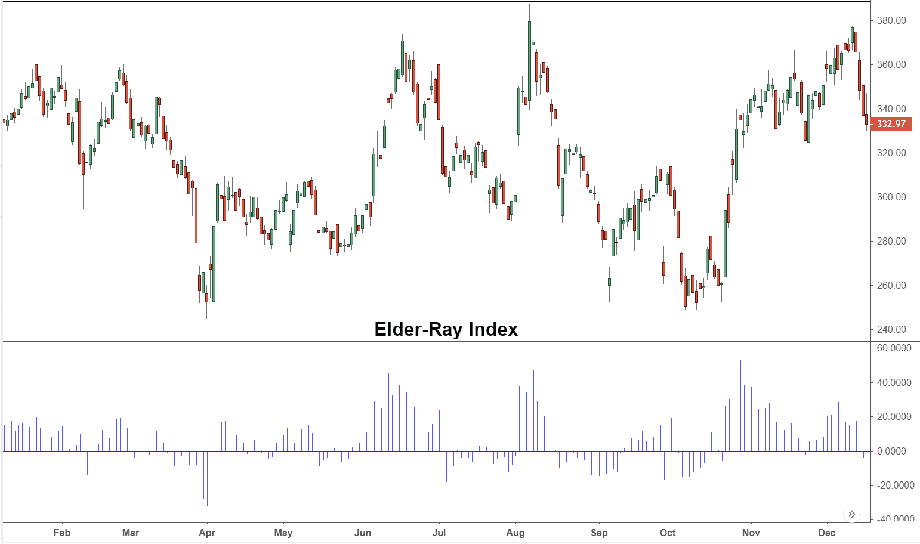
Elder-ray is a technical indicator that uses bulls' and bears' power to assess market direction. When used in triple screen trading, it helps determine the strength of upward or downward trends on different timeframes. This helps confirm trend-following trades and provides better entry points.
Williams percent range
The Williams percent range measures overbought or oversold conditions. The triple screen method provides critical insights into potential reversals. By using it across multiple screens and timeframes, traders can identify areas where the market may be due for a pullback or trend continuation.
Stochastic oscillator
The stochastic oscillator compares an asset's closing price to its price range over time. The triple screen strategy identifies potential overbought or oversold conditions. Used across different timeframes, it helps traders pinpoint trade opportunities. It also allows traders fine-tune entry and exit points for better risk management.
Step wise guide to trade with the triple screen trading strategy
-
Select three timeframes
Choose three distinct timeframes: long, intermediate, and short. The long timeframe sets the overall trend. Meanwhile, the intermediate timeframe confirms the trend direction, and the short timeframe refines entry and exit points.
-
Analyze the trend on the primary timeframe
Start by identifying the trend on the long timeframe. Look for clear signs of uptrends or downtrends. This timeframe offers a broader market view and helps avoid false signals.
-
Confirm trend on the intermediate timeframe
Next, confirm the trend using the intermediate timeframe, ensuring it is consistent with the primary timeframe. This step filters out minor fluctuations and strengthens the trade's reliability.
-
Refine entry on the short timeframe
Use the short timeframe to pinpoint entry and exit levels. Based on market movement, identify precise moments to enter. This timeframe offers an opportunity to time trades more accurately.
-
Enter the trade
After confirming all timeframes align, enter the trade. Execute the trade when all criteria match. Ensure the entry aligns with the overall market trend.
-
Monitor the trade and adjust
Monitor the trade regularly for significant changes. Adjust stops and targets based on price action. If the trend shifts or market conditions alter, make necessary changes.
-
Review and adjust strategy
After the trade concludes, review the results. Assess if the strategy has met expectations. Traders can also refine the approach based on lessons learned for future trades.
Trade the forex market with triple screen trading
The triple screen trading system helps identify the prevailing trend across multiple timeframes in forex. The long timeframe sets the trend, the intermediate timeframe confirms it, and the short timeframe refines entry and exit points. This strategy also filters market noise, reduces the chances of false signals, and improves trade timing.
Disclaimer: All material published on our website is intended for informational purposes only and should not be considered personal advice or recommendation. As margin FX/CFDs are highly leveraged products, your gains and losses are magnified, and you could lose substantially more than your initial deposit. Investing in margin FX/CFDs does not give you any entitlements or rights to the underlying assets (e.g. the right to receive dividend payments). CFDs carry a high risk of investment loss.