


The inverted cup and handle pattern is shaped like an upside-down teacup, reflecting fading bullish momentum followed by a weak recovery. When price moves below a key support level, it may be interpreted as a change in market behaviour and an early indication of shifting sentiment.
In this article, we will cover the inverted cup and handle the pattern in depth.
The information provided below is for educational purposes only and does not constitute financial advice. Please seek professional advice before making any investment decisions.
What is the inverted cup and handle pattern?
The inverted cup and handle pattern is a bearish chart formation that signals a potential trend reversal from bullish to bearish. It resembles an upside-down teacup, where the ‘cup’ forms a rounded top and the ‘handle’ appears as a slight upward retracement before a breakdown.
This pattern indicates that bulls have lost momentum after an uptrend, and bears are gaining control. The handle’s upward drift is usually weak, and once the price breaks below the support line (the bottom of the cup), it confirms the pattern and suggests a possible sharp decline.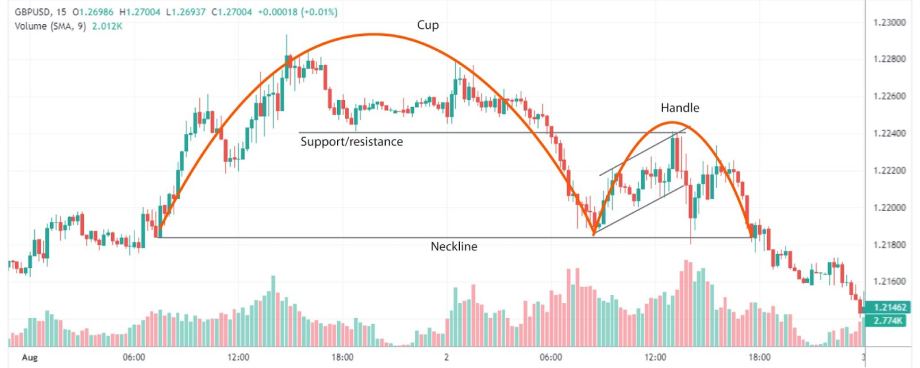
What does the inverted cup and handle pattern signal?
Bearish momentum is building
The inverted cup and handle indicate that there may be indications that selling activity is increasing relative to buying interest, which could provide context for understanding changes in market behaviour. The pattern’s shape reflects a loss of upward strength, hinting at a potential downward breakout and continuation of bearish sentiment.
Distribution phase involving increased activity from larger market participants
During this phase, some larger market participants may be reducing exposure, contributing to shifts in overall market activity. This distribution phase signals a shift from accumulation to exit, laying the groundwork for a future price decline.
Break in market confidence
The pattern reveals a weakening belief among traders in the current uptrend. As the price fails to recover during the handle, market participants lose confidence. This leads to increased exit pressure and vulnerability to a sharp drop.
Short-selling opportunities
Once the price breaks below the support line after the handle, it may signal a bearish setup. Some traders may view this as an indication to further examine broader market conditions for additional context.
Indicators to combine with the inverted cup and handle pattern
Relative Strength Index (RSI)
The Relative Strength Index (RSI) helps identify momentum shifts during the inverted cup and handle formation. As the pattern develops, RSI often shows bearish divergence, where the price makes higher highs during the cup, but RSI forms lower highs, signaling weakening momentum.
During the handle and eventual breakdown, RSI may move below 50, which some traders interpret as a sign of weakening momentum. Using RSI in conjunction with this pattern allows traders to confirm that momentum is aligning with the anticipated reversal.

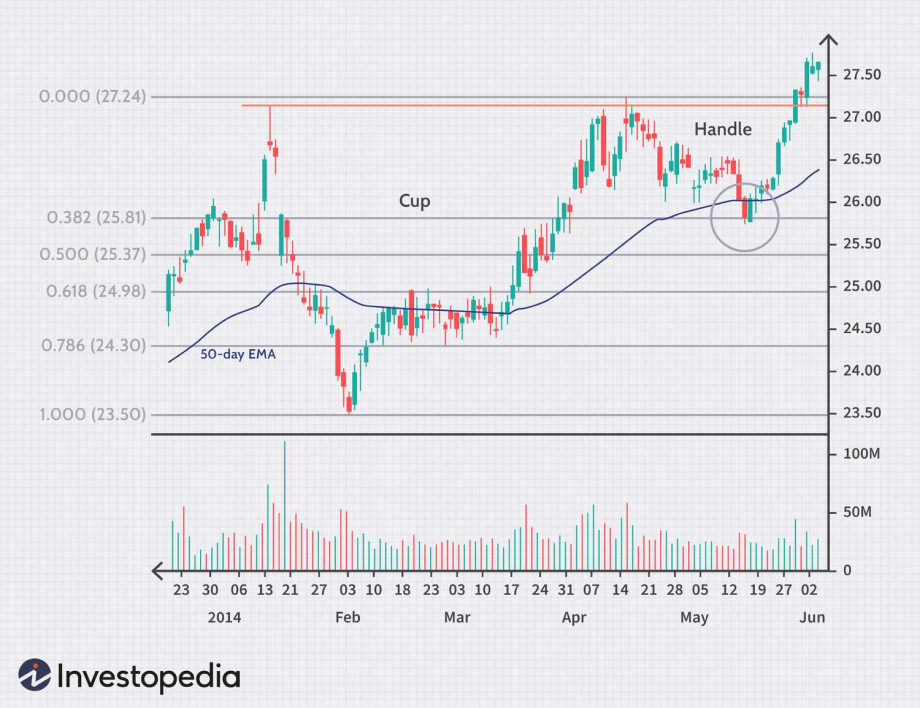
Moving averages (50 EMA / 200 EMA)
Moving averages, particularly the 50 EMA and 200 EMA, help confirm trend direction and filter noise. In an inverted cup and handle setup, if the price is trading below both EMAs or crosses below them during the pattern, it reinforces the bearish outlook.
The EMAs can also act as dynamic resistance during the handle phase. A breakdown below the support zone while staying under the EMAs strengthens the case for a sustained downtrend. This makes it a more reliable trade setup overall.
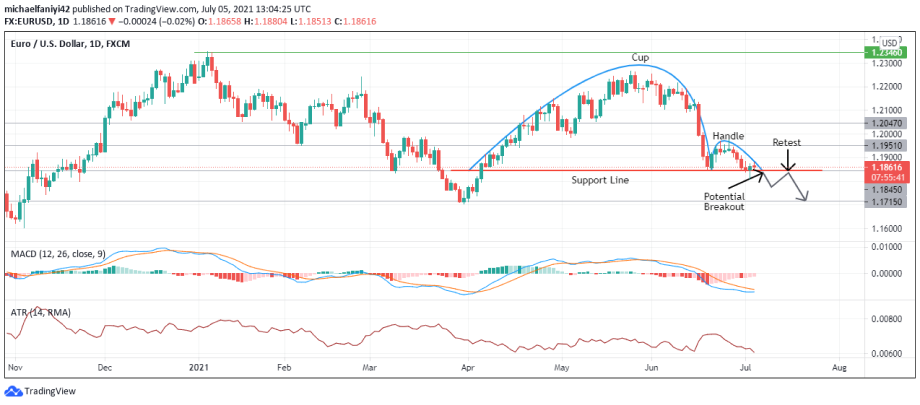
MACD (Moving Average Convergence Divergence)
The MACD helps confirm trend reversals and momentum shifts. During an inverted cup and handle, traders watch for the MACD line crossing below the signal line and moving into negative territory. This bearish crossover often coincides with the breakdown from the handle, providing confirmation.
Additionally, the widening of the MACD histogram post-breakout signals increases bearish momentum. When MACD supports the pattern’s direction, it improves trader confidence and helps filter out weak or premature setups.
How to trade with the inverted cup and handle pattern
1. Spot the pattern after an uptrend
Begin by identifying a strong prior inverted cup and handle uptrend, which sets the stage for a potential reversal. The inverted cup and handle only hold significance if they form after a sustained bullish move.
2. Wait for the handle to form
Observe the price forming a rounded top (inverted cup), followed by a slight upward or sideways drift (the handle). This phase often reflects a weak attempt by bulls to regain control.
3. Mark key support level
Draw a horizontal line at the bottom of the inverted cup. This acts as the support level. A decisive break below this zone confirms the bearish pattern.
4. Monitor for a Breakdown Below Support
Once price moves below the support level with increased activity, some traders may choose to observe how the structure develops to gain additional context. Ensure the breakdown is not on low volume or within a choppy market phase.
5. Place stop-loss above the handle
Some traders reference the handle’s highest point when considering where an invalidation level might sit as part of their broader analysis This protects the trade in case of a false breakout or sudden price reversal.
6. Set a target using cup height
Measure the distance from the cup’s peak to the support line. One way some traders interpret this pattern is by using the height of the formation as a reference point when assessing potential price projection areas within their analysis, giving a realistic expectation.
7. Confirm with volume and indicators
Look for increased volume on the breakdown, and use indicators like RSI, MACD, or moving averages to confirm bearish momentum. This adds credibility to the trade setup.
8. Manage and trail the stop
Once the trade moves in the trader’s favor, manage risk by trailing the stop-loss to lock in gains. Monitor price action for signs of exhaustion or reversal to exit smartly.
What should traders know before using the inverted cup and handle pattern?
The inverted cup and handle offer a clear bearish reversal signal with defined entry, stop-loss, and target levels, making it attractive for forex traders seeking structured setups. It may be assessed alongside volume and other technical indicators to provide additional context.
However, it can also produce false signals in ranging markets or during low volatility. Patience is needed for confirmation, and beginners may misidentify it. When used with discipline, it may be incorporated as part of a trader’s broader analytical framework.
Disclaimer: All material published on our website is intended for informational purposes only and should not be considered personal advice or recommendation. As margin FX/CFDs are highly leveraged products, your gains and losses are magnified, and you could lose substantially more than your initial deposit. Investing in margin FX/CFDs does not give you any entitlements or rights to the underlying assets (e.g. the right to receive dividend payments). CFDs carry a high risk of investment loss.