Get ready for another important week in forex markets! From US Federal rate decisions to US Non-Farm Payrolls, the markets are poised for action. Stay informed, stay ahead!
#Forex #Trading #MarketInsights
Watch the video to learn more...
Forex Week Ahead Analysis
This week in FX, several economic indicators and events are poised to sway the markets.
Eyes are on the Canadian GDP month-over-month (m/m) figure, which is anticipated to range between 0.3% to 0.6%. Additionally, multiple speeches from Bank of Canada Governor Macklem are scheduled, adding further fuel to potential CAD fluctuations throughout the week.
The NZD unemployment rate is expected to tick higher to 4.3%, potentially putting pressure on the Kiwi in the short term as investors assess the economic implications.
The US Federal Reserve is widely projected to maintain its benchmark interest rates at 5.50%. However, the market sentiment is shifting towards concerns about the possibility of further rate hikes, with cuts appearing to be off the table for the time being.
Anticipation surrounds the release of the US non-farm payrolls data, with forecasts suggesting a figure of 234k, down from the previous 303k. Despite the decline, a job number surpassing 200k is generally viewed as positive, signaling continued resilience in the labor market.
USD Index
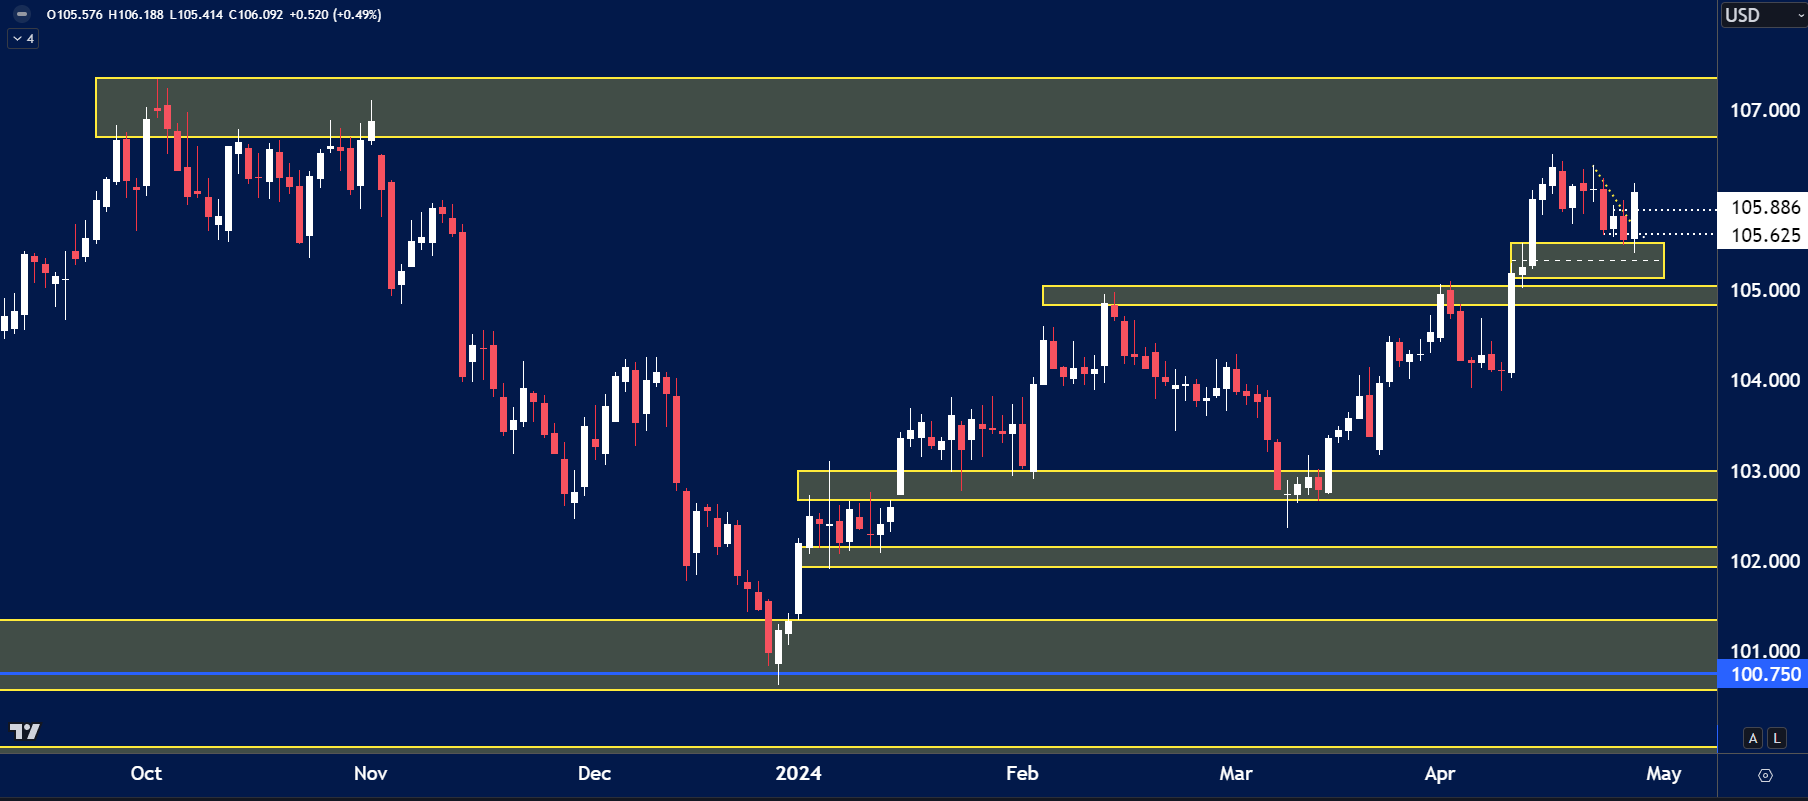
The price on the chart has traded through multiple technical levels and some observations included:
- The USD Index rebounded on Friday, possibly showing signs of strength coming back.
- The resistance of 107.00 formed from the highs of October and November 2023. This looks to be likely targets for USD buyers.
EURUSD
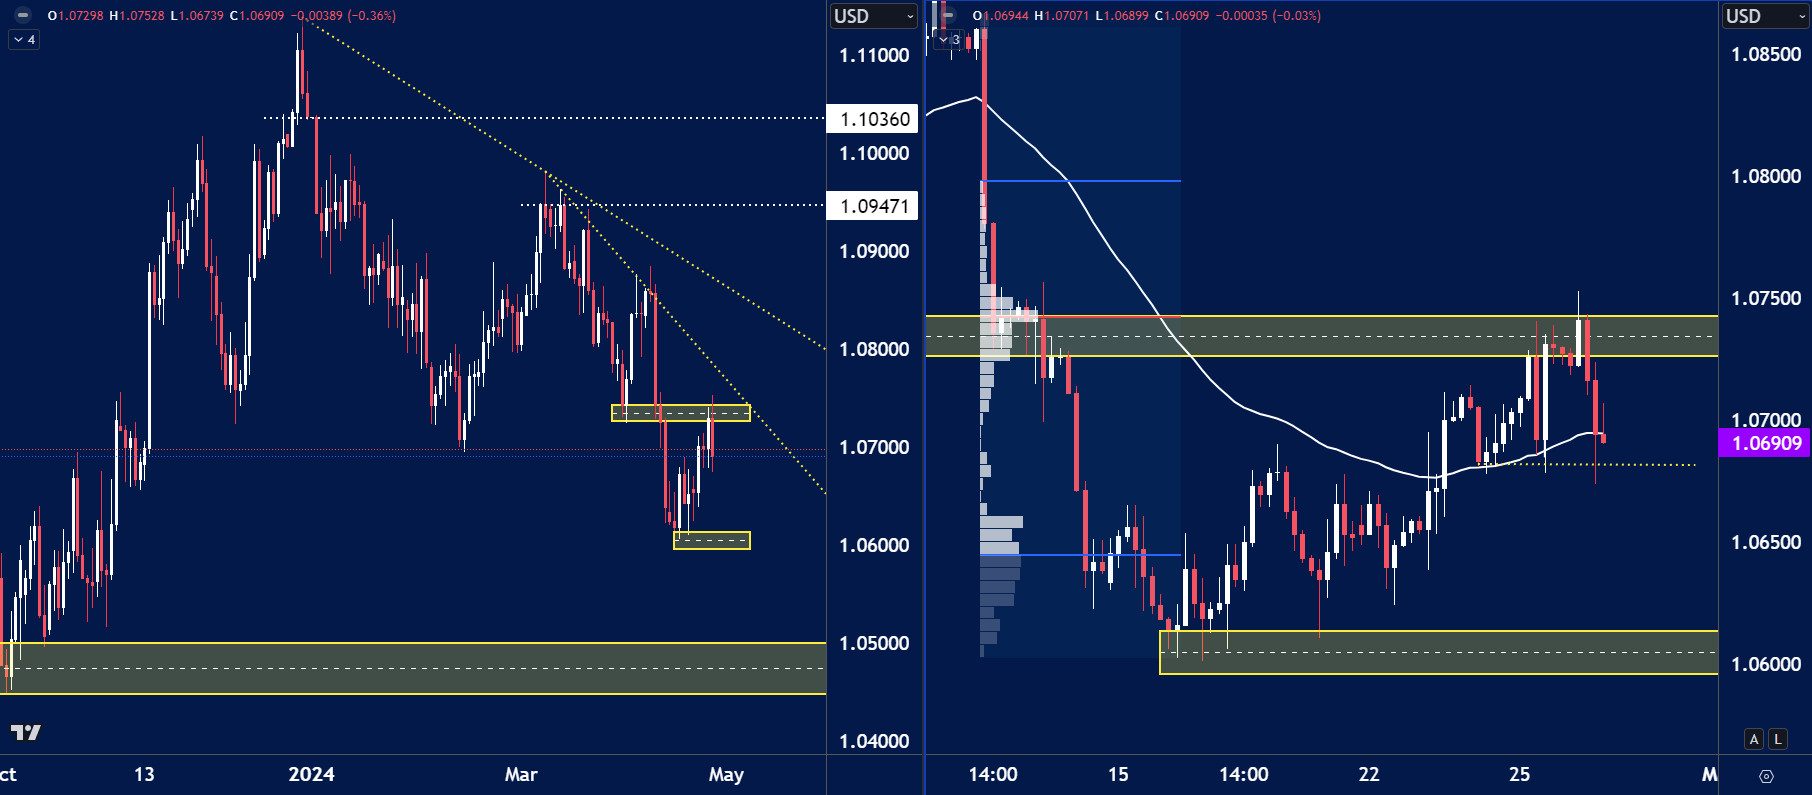
The price on the chart has traded through multiple technical levels and some observations included:
- The EURUSD price rejected the key 1.0750 handle, and if the USD strength returns, EURUSD could reach the previous lows of 1.0600.
- A breach below those prices could see a move towards 1.0500.
GBPUSD
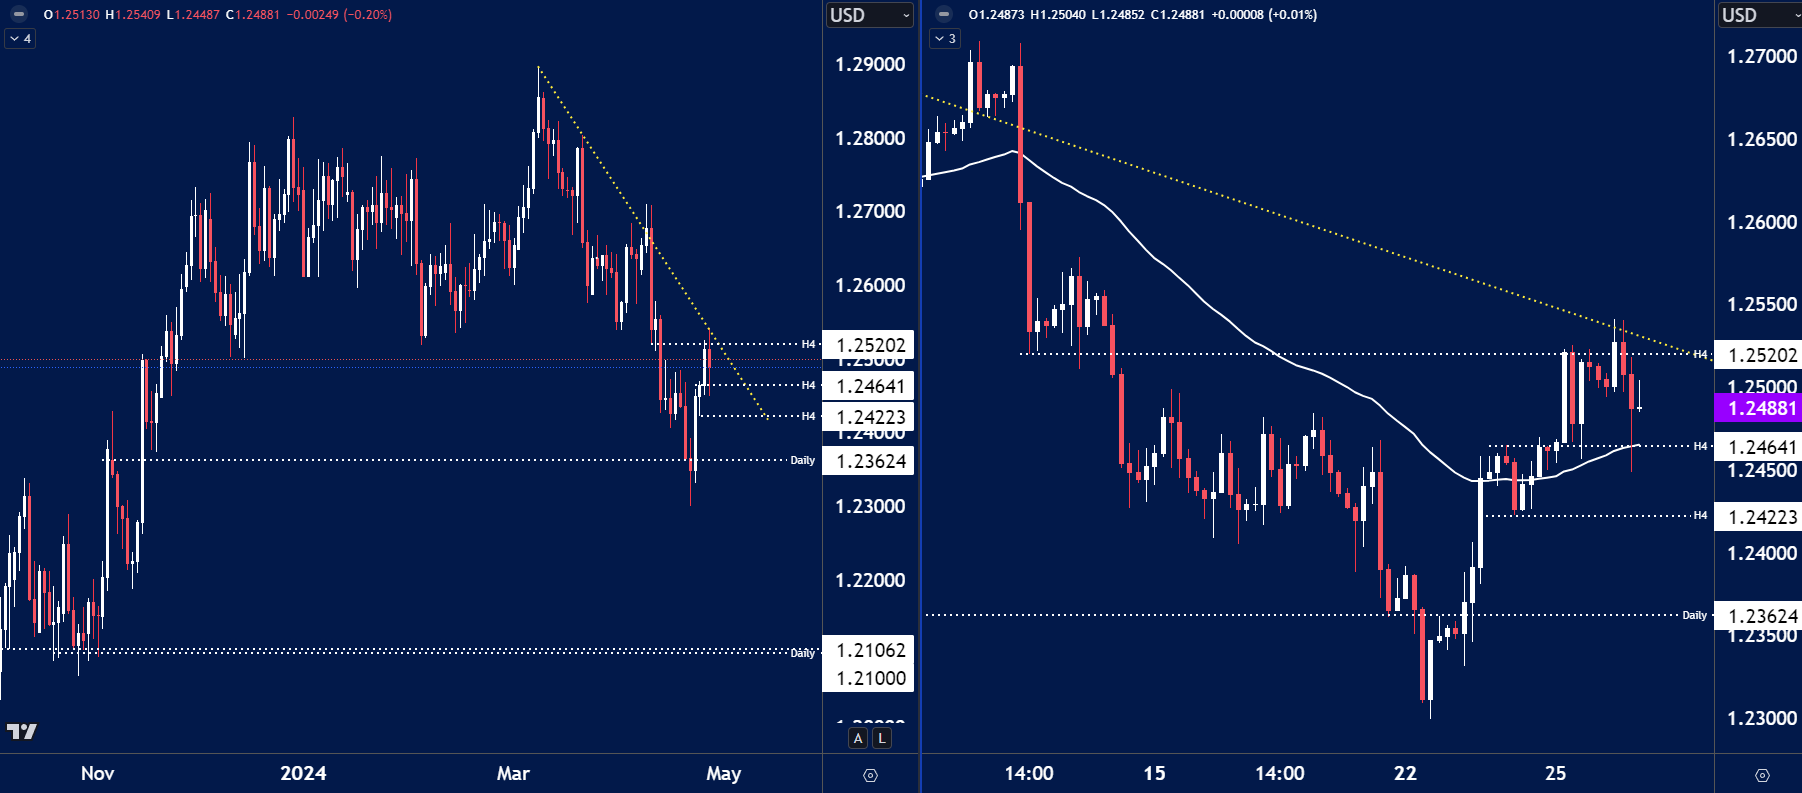
The price on the chart has traded through multiple technical levels and some observations included:
- The price of Cable closed bullish last week, however the daily trend remains down.
- A break of the trendline resistance formed from the swing highs around 1.2900 would need to be broken before considering any long ideas.
- H4 chart on the right hand side shows support at 1.2450, a break below this could offer selling opportunities.
USDCAD
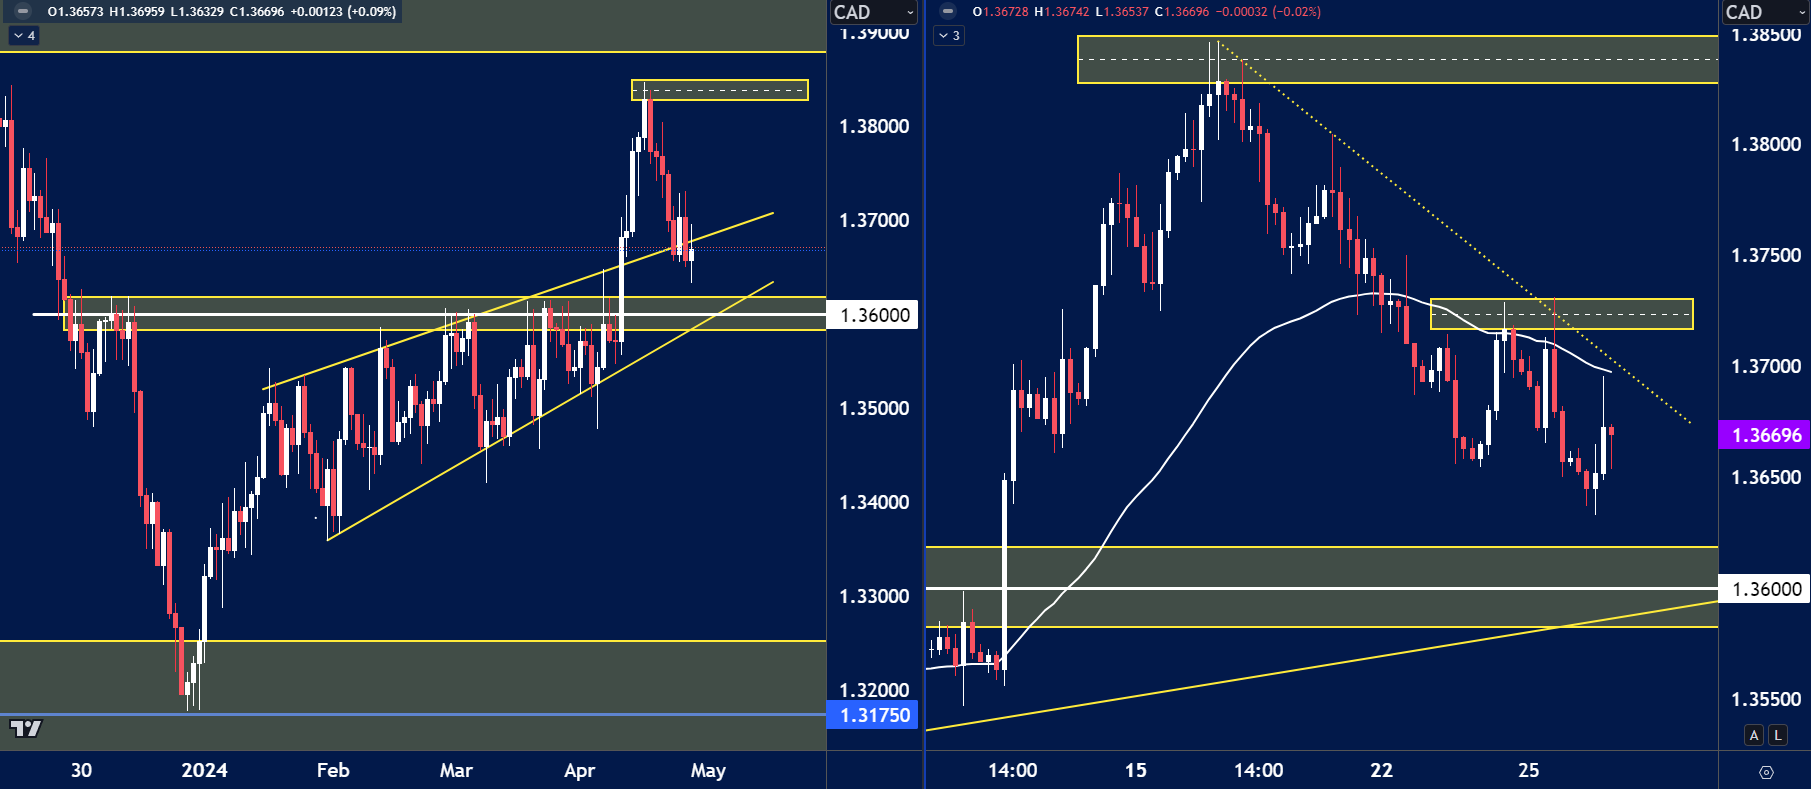
The price on the chart has traded through multiple technical levels and some observations included:
- The price of USDCAD could be a mover this week considering the data ahead. Price is currently trading towards the key 1.3600 level of support.
- If the H4 downward trend were to break we could see an opportunity for the price to trade higher.
USDJPY
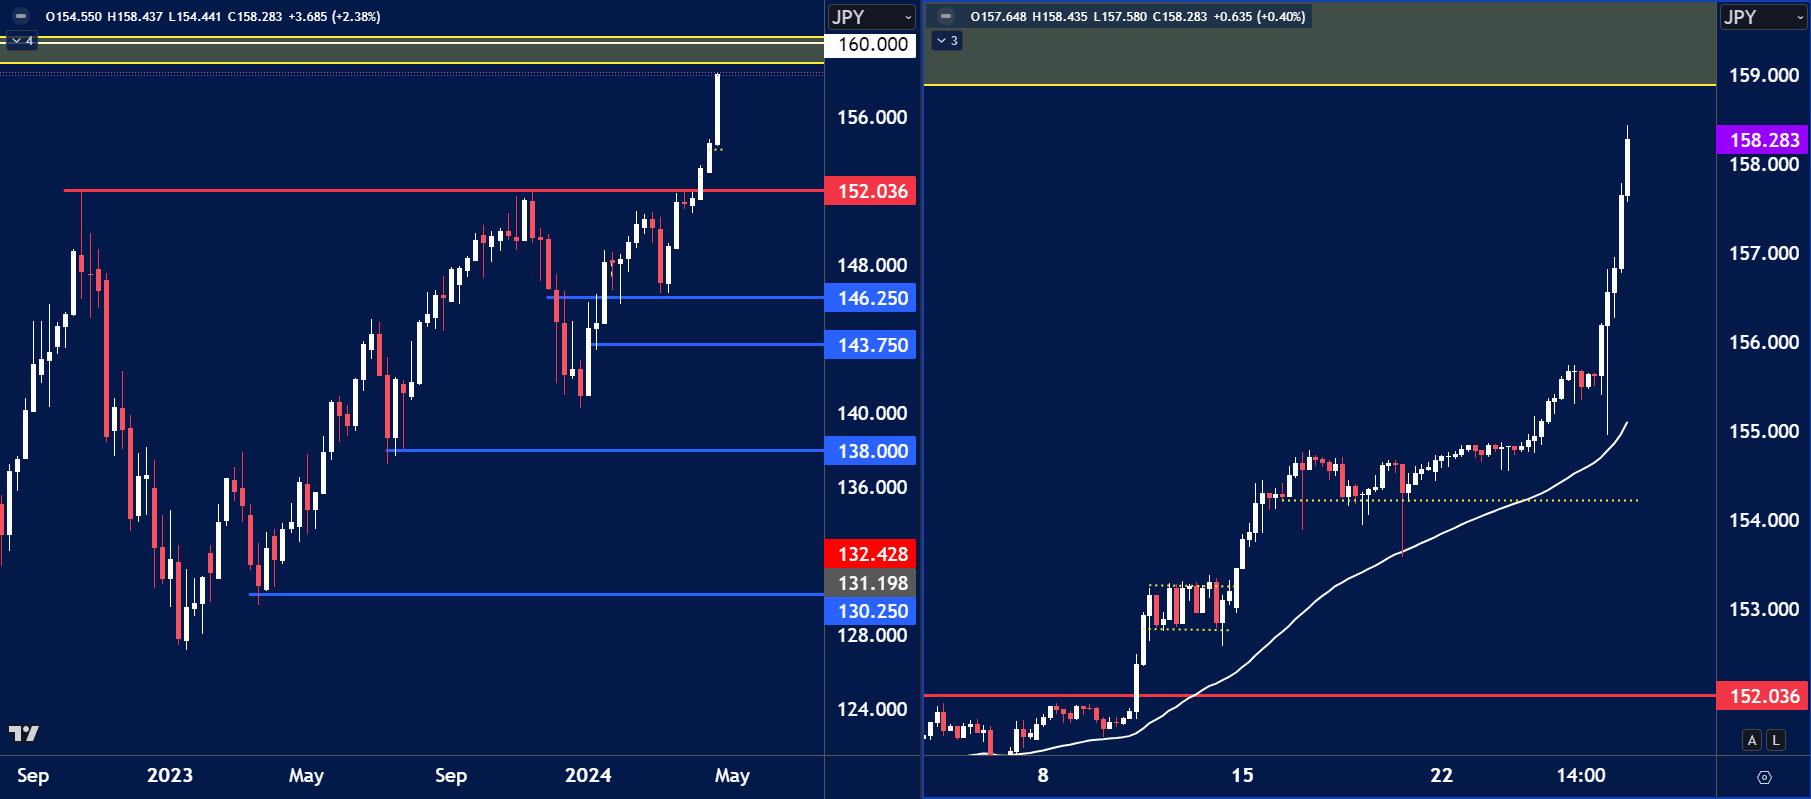
The price on the chart has traded through multiple technical levels and some observations included:
- The price of USDJPY accelerated last week towards the major swing highs from 1990 between 158-160.00.
- Will the BoJ intervene here? That will be the risk factor of longs this week.
Have you watched our latest video update? You can see it here.
Enjoy low spreads and quick trade executions with a live account. Our highly committed customer support team will assist you with your quick account setup for any future concerns. Start trading with Blueberry.
Disclaimer: All material published on our website is intended for informational purposes only and should not be considered personal advice or recommendation. As margin FX/CFDs are highly leveraged products, your gains and losses are magnified, and you could lose substantially more than your initial deposit. Investing in margin FX/CFDs does not give you any entitlements or rights to the underlying assets (e.g. the right to receive dividend payments). CFDs carry a high risk of investment loss.


