


The pattern of falling three methods in trading helps traders spot short-term consolidation phases, followed by renewed exit or shorting pressure. Recognizing this setup may provide traders with additional context when reviewing market conditions and considering how price behaviour could be evolving.
Traders may consider using this pattern to review bearish market conditions as part of their broader analysis. This article explains the falling three methods pattern and its general use in trading.
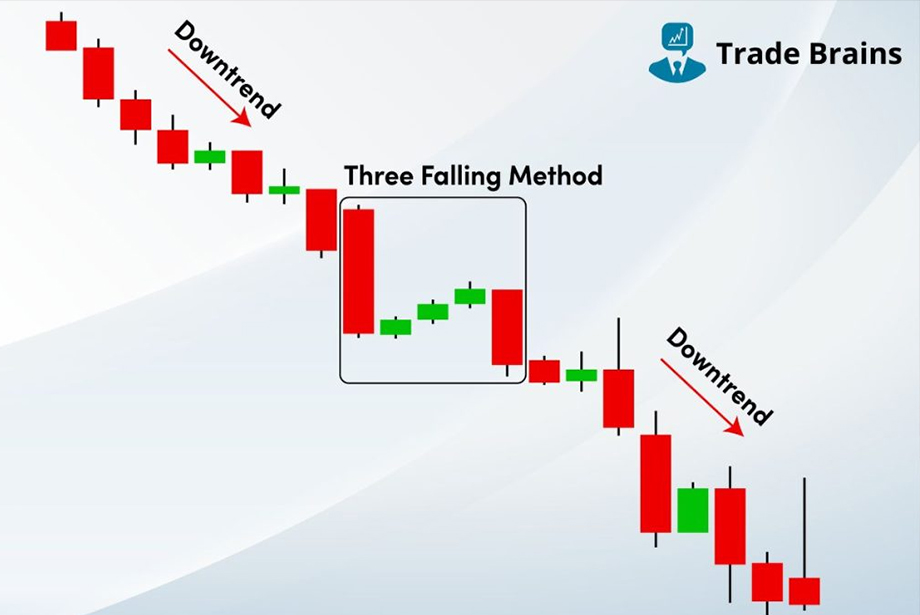
What is the falling three methods pattern?
The falling three methods is a bearish continuation candlestick pattern that reflects a pause within a downtrend, which traders may monitor for signs of whether the momentum is weakening or continuing of the exit pressure. It shows that even though buyers briefly pushed the price upward before the broader downward move resumed.
Traders may refer to it in forex markets during trending phases as part of their broader analysis. after a short retracement.
The falling three-methods pattern consists of five candles:
- First candle: A long bearish (red/black) candle that confirms the ongoing downtrend.
- Middle three candles: These are smaller bullish (or neutral) candles that move upward but remain within the range of the first candle. They represent a temporary consolidation or pullback.
- Fifth candle: A strong bearish candle that closes below the first candle's close, confirming that bears have regained control.
How to identify the falling three methods pattern on a chart
- Identify an existing downtrend: This pattern only appears as a continuation signal in a prevailing downtrend. Before the pattern begins to form, make sure the overall trend is bearish.
- Spot a large bearish candle: The pattern starts with a strong red candle, showing sustained movement to the downside. This sets the tone for bearish control in the market.
- Find three small bullish candles: Next, look for three consecutive small-bodied bullish candles moving slightly upward. These candles should stay within the range of the first large bearish candle.
- Observe whether the third bullish candle forms below the first bearish candle's low: The bullish candles must not break above the high of the first candle, and ideally, the third one should close near or below the opening of the first red candle.
- Confirm with a breakout: The pattern ends with another strong, bearish candle that breaks below the low of the bullish consolidation. This may suggest that the downtrend remains intact and that bearish conditions could still be present.
Strategies to use with falling three methods pattern
This discussion is intended for traders who understand the risks associated with leveraged products and recognise that such strategies may not be suitable for everyone. The following should not be considered as personal advice or a recommendation to trade margin FX/CFDs.
Review trend conditions after the pattern forms
Once the final bearish candle confirms the pattern, traders may consider entering a short position in alignment with the prevailing downtrend. This approach is often reviewed in strong trending markets to assess how price interacts with the prevailing direction. Ensure that the closing price breaks below the low of the bullish consolidation. Then. Combine this with moving averages to align the trade with the broader market momentum.
Breakout strategy using pattern's boundary
Traders can set the pattern's lower boundary, formed by the lowest point of the consolidation, as the breakout level. A sell-stop order is placed just below this boundary. If the price breaks and closes below it, it confirms bearish momentum. This strategy may encourage traders to wait for additional price information and is sometimes reviewed alongside volume to offer further context.
Momentum-based confirmation with oscillators
Before acting on the pattern, use momentum oscillators like RSI or MACD to confirm weakening bullish momentum during the three rising candles. If the oscillator shows no strong bullish recovery and instead supports bearish pressure, it provides additional context for evaluating bearish conditions. This combination can help frame the setup more clearly while avoiding any suggestion of certainty in future outcomes in volatile markets.
How to trade forex with the falling three methods pattern
Identify the prevailing downtrend
Begin by analyzing the chart for a strong and consistent downtrend. The pattern of the falling three methods is a bearish continuation setup, so it should appear during a downward market phase. Use moving averages, such as the 50 EMA or price structure, to confirm that the downtrend is intact.
Spot the three-bar consolidation
Look for a large bearish candle followed by three smaller bullish candles moving slightly upward or sideways. These smaller candles should remain within the range of the first bearish candle and signal temporary consolidation. Their limited height and low volume suggest weak bullish momentum and no real trend reversal.
Wait for the breakout
The pattern is not confirmed until a second strong bearish candle appears after the three bullish bars. This final candle must break below the low of the first bearish candle. This breakout signals that bears have regained control and that the downtrend may remain in place.
Confirm with volume
Check that a spike or rise in volume supports the breakout candle. Increased volume adds credibility to the breakout, showing that institutional bears are participating. If the volume is low, consider waiting or avoiding the trade, as the signal might be weak.
Place stop-loss
Some traders set their risk parameters above the highest point of the consolidation zone (such as the top of the third or highest bullish candle), using this level as a reference point when assessing the potential for false breakouts and limits potential losses if the market reverses or if the pattern fails to hold.
Set gain target
Some traders reference the height of the first bearish candle and note that distance from the breakout point as part of their analysis. Others may review nearby support levels or apply their own preferred risk-to-reward framework when planning potential exit levels. These approaches are considered within the broader context of market conditions and individual risk preferences, rather than as guidelines for achieving favourable outcomes.
Monitor price action
Keep a close eye on how the price behaves after the breakout. If the price retests the breakout zone and holds below it, that confirms the pattern's strength. Avoid holding the trade through major news events unless planned, as they can increase volatility and risk.
Why the falling three methods may be reviewed as one component within a broader trading approach
The falling three methods pattern is a commonly used bearish continuation signal, providing a visual indication of the trend's strength. It is commonly used in strong downtrends to assist traders in timing their entries.
However, it may fail during low-volume sessions or when news events disrupt patterns. Combine it with volume analysis and key support and resistance zones for accurate results, enhancing accuracy and managing risk effectively in forex trading.
Disclaimer: All material published on our website is intended for informational purposes only and should not be considered personal advice or recommendation. As margin FX/CFDs are highly leveraged products, your gains and losses are magnified, and you could lose substantially more than your initial deposit. Investing in margin FX/CFDs does not give you any entitlements or rights to the underlying assets (e.g. the right to receive dividend payments). CFDs carry a high risk of investment loss.