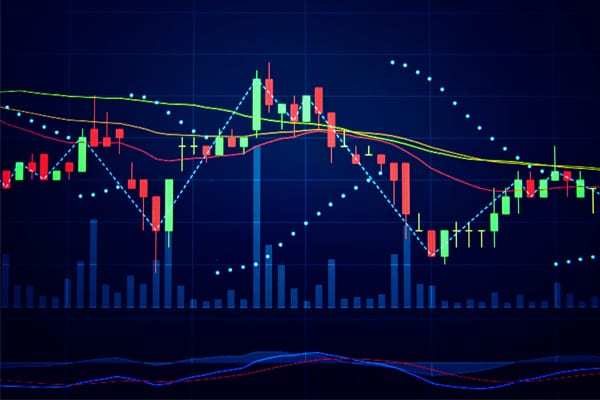
Trading in a forex market is like all markets; it involves risks in buying and selling while waiting for the market to turn the tides up so you can reap gains. There is no perfect assurance that the trend of increasing or decreasing prices will continue. There is also no surefire way to forecast the market, but this cold hard truth leads us to the next best thing: divergence.
What is divergence?

Unlike a famous YA novel, it doesn’t necessarily mean traders are being grouped into factions according to their aptitudes and values. The divergence we are talking about typically occurs between prices and fundamental or technical indicators. In forex, these indicators are referred to as oscillators, as they tend to vary between two graph points, thereby showing when currencies are oversold or overbought in the market.
In simple terms, a divergence is formed when an oscillator moves opposite the price direction. Though not certain, divergences indicate when a trend might stop or when a reversal might come. The price action is contrasted with the movement of a chosen indicator when applied to trading strategies.
Divergence trading can prove to be powerful, assuming you have initially decided to go short—that is to sell currencies—with a downtrend at hand. With a point of divergence, you can opt to get out or close half of it. You could exit or buy at the closest low of the point of divergence.
What does a regular divergence mean?
Also known as classic divergence, a regular divergence occurs when the prices are at lower lows or higher highs while the oscillator is going the opposite. A regular divergence could mean a possible reversal of trends.
There are two conditions by which a regular divergence can occur.
| Indication | Price Pattern | Oscillator Pattern | Significance |
|---|---|---|---|
| Bullish or positive | Lower low | Higher low |
This occurs in a prevailing market downtrend. Selling is less urgent as bears are exhausted. The downtrend is expected to end, and the market might reverse to an uptrend, which indicates an underlying strength. |
| Bearish or negative | Higher high | Lower high |
This occurs in a prevailing market uptrend. The lower high oscillator indicates that buying is less intense, and sellers could possibly take over the market. Bulls are exhausted, hence warning of a change from an uptrend to a downtrend. |
Regular divergences are customarily formed at the end of prevailing trends; thus, they can be spotted easily.
What does a hidden divergence mean?

Hidden divergences take place when the oscillator makes lower lows or higher highs. This is the exact opposite of the classic or regular convergence. Hidden divergence is a warning of a possible trend continuation. There are also two conditions by which a hidden divergence can occur.
| Indication | Price Pattern | Oscillator Pattern | Significance |
|---|---|---|---|
| Bullish | Higher low | Lower low |
An underlying strength can be seen in the trend. This could mean good re-entry or entry decisions as a new uptrend begins. This divergence also means that an uptrend is expected to continue. |
| Bearish | Lower high | Higher high |
This condition can be seen as a reaction towards a downtrend, as indicated by lower high price patterns. An underlying weakness is seen in the uptrend, so it is expected to be short-lived. This scenario suggests that a downtrend is more likely to continue. |
It is important to remember that hidden divergences usually happen at the start of new trends. This could mean that they cannot be spotted easily, as that would be quite tricky.
Which oscillators spot divergences?

While momentum oscillators signal divergences in the forex market, we must also emphasize that not all of the indicators can help spot divergences.
Among the widely used momentum oscillators are the following:
Commodity channel index (CCI)
This momentum-based oscillator can determine if an asset is becoming oversold or overbought, and it can also assess price strength and trend direction.
Stochastic
A stochastic oscillator works by comparing certain closing prices of securities to a range of their prices over a specific period. Generating trading signals for oversold or overbought securities is done via a 0-100 range of values.
William %R
Called as Williams Percent Range, this momentum indicator can be used to find exit and entry points in a given market. It was first developed to compare closing prices to the high-low range for a specified period, typically 14 days.
Relative Strength Index (RSI)
This momentum indicator measures the magnitude of the latest price changes to evaluate oversold or overbought conditions in an asset's price.
You can’t merely make a wild guess in trading and rely on pure luck. While divergences do not provide clear entry signals, weakness or strength can be seen in the underlying trend, which will help shape your trading decisions.
When combined with other techniques, divergence trading can produce positive outcomes and give you an edge in the game.
Disclaimer: All material published on our website is intended for informational purposes only and should not be considered personal advice or recommendation. As margin FX/CFDs are highly leveraged products, your gains and losses are magnified, and you could lose substantially more than your initial deposit. Investing in margin FX/CFDs does not give you any entitlements or rights to the underlying assets (e.g. the right to receive dividend payments). CFDs carry a high risk of investment loss.


