


Harami patterns provide traders with both market continuations and reversals signals, based on the trend’s strength. Traders are also able to identify entry points across different currency pairs in multiple timeframes with these patterns. Since prices in the forex market can change rapidly, harami patterns can be used to identify quick shifts in market momentum accurately.
In this article, we will dive deep into the concept of bullish and bearish harami patterns.
What is a harami candlestick pattern?
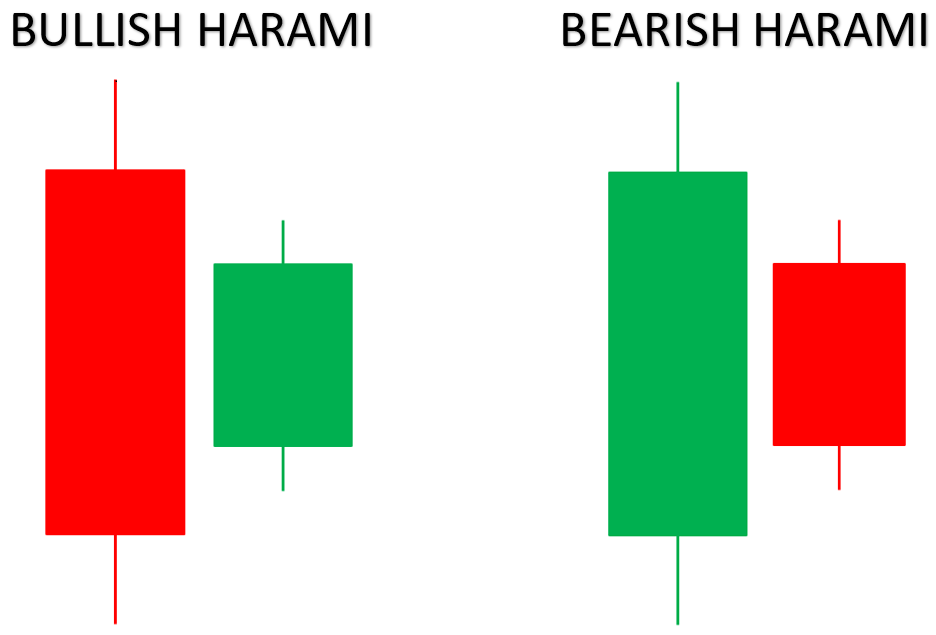
A harami candlestick pattern is a technical indicator formed with two-candlesticks. There are two main types of harami patterns:
- Bullish harami forms at the end of a downtrend. It has the first candle as a long red (bearish) candle and second candle as a small green (bullish) candle completely enclosed within the body of the first candle. Bullish harami suggests a reversal from downtrend to uptrend.
- Bearish harami which forms at the end of an uptrend. It has the first candle as a long green (bullish) candle and second candle as a small red (bearish) candle completely enclosed within the body of the first candle. Bearish harami candlestick suggests a reversal from uptrend to downtrend.
There are also some advanced harami candlestick charts pattern considerations that traders must be aware of –
- Hidden harami occurs when the second candle closes slightly outside the body of the first candle, but still within its overall range. It can weaken the signal but still be considered.
- Belt hold harami is a more powerful variation where the second candle is completely engulfed by the first candle's real body (excluding shadows), confirming the trade signal.
- Harami cross is a comparatively rare pattern where the second candle completely crosses over the first candle, indicating a strong potential reversal.
Characteristics of harami patterns
There are 4 major characteristics of a harami pattern:
- Two candles: The pattern consists of two consecutive candlesticks.
- Large first candle: The first candle is typically long, indicating strong long or short pressure.
- Small second candle: The second candle is significantly smaller than the first and is completely engulfed by the first candle's body.
- Color contrast: The color of the second candle is usually opposite to the first, suggesting a potential change in market sentiment.
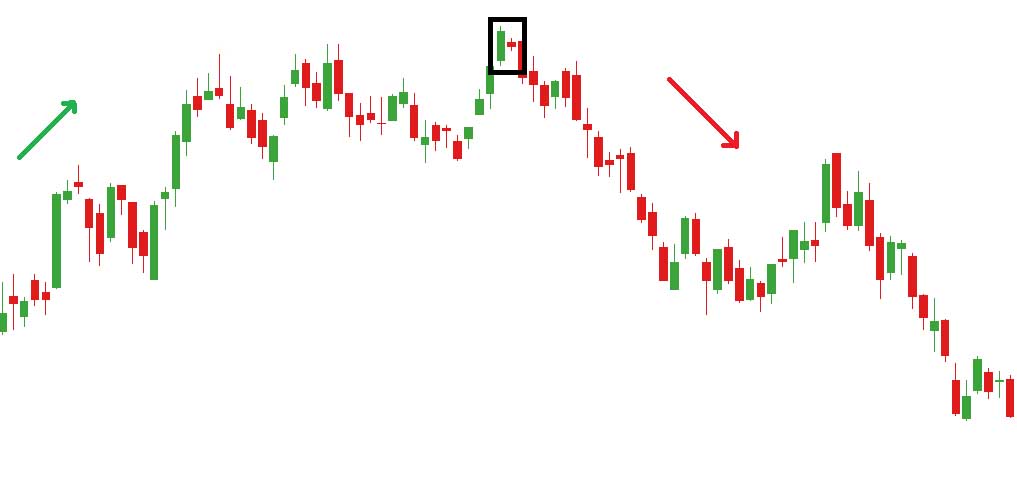
How to identify the bearish harami candlestick patterns?
A bearish harami candlestick pattern forms a two-candle pattern that signals a potential reversal from an uptrend to a downtrend. To identify it, look for the following characteristics:
- Strong uptrend: The pattern typically forms after a sustained price increase
- Large green candlestick: The first candle is a long green candlestick, indicating strong long pressure
- Small red candlestick: The second candle is significantly smaller than the first and is entirely engulfed by the body of the first candle. It is red, signaling a bearish reversal
- Open and close: The opening and closing prices of the second candle should be within the body of the first candle
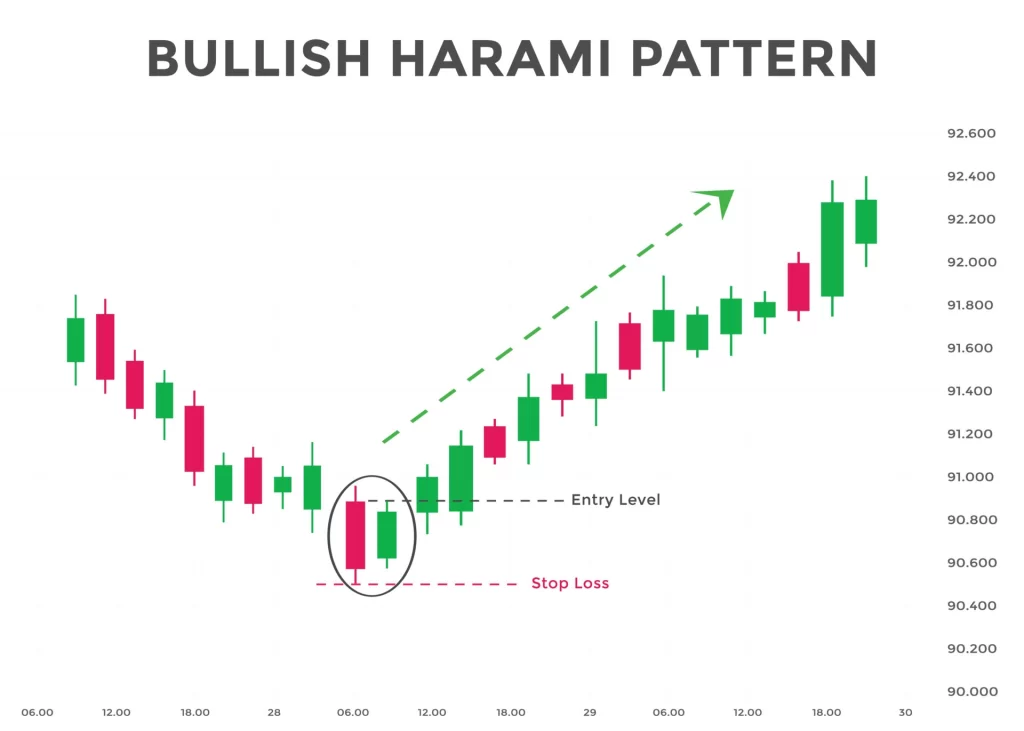
How to identify the bullish harami candlestick pattern?
A bullish harami candlestick pattern is a two-candle reversal pattern that suggests a potential uptrend after a downtrend. Here's how to identify it:
- Downtrend: The pattern typically forms at the end of a downtrend.
- Long bearish candlestick: The first candle is a long red (or black) candle, indicating strong exit pressure.
- Small bullish candlestick: The second candle is a small green (or white) candle, completely enclosed within the body of the first candle. This indicates a potential shift in market sentiment from bearish to bullish. The entire body of the second candle should be within the body of the first candle.
- Open and close: For a bullish harami candlestick pattern, the open and close of the second candle must be entirely within the body of the first candle.
Psychology behind the harami pattern
The harami candlestick pattern, both bullish and bearish, offers a glimpse into the shifting dynamics of market sentiment. Essentially, it reflects a battle between bulls and bears as they tell price direction.
An initial long bearish candlestick signifies exit pressure. However, the subsequent small bullish candle, entirely engulfed by the previous candle, suggests a waning of bearish dominance. This shift implies that bulls are beginning to exert influence, potentially signaling a trend reversal.
Conversely, a large bullish candle reflects strong entry momentum. The following smaller bearish candlestick, contained within the previous body, indicates a loss of bullish vigor. This pattern hints at a potential takeover by bears, foreshadowing a potential downtrend.
The harami candlestick pattern captures a moment of indecision and potential power shift between bulls and bears. It's a visual representation of market sentiment evolving from one extreme to another, making it a valuable tool for traders seeking to anticipate trend reversals.
Bullish and bearish harami pattern trading strategies
Identify the trend
A bullish harami pattern usually appears in a downtrend and vice versa. The bullish harami pattern indicates a reversal from bearish to bullish whereas a bearish harami indicates a reversal from bullish to bearish.
Spot the harami pattern
Since the harami pattern consists of two candlesticks, spot a bullish harami pattern by identifying the first candlestick as a long bearish candle in red and the second candlestick as a small bullish candlestick in green, completely within the body of the red candlestick. The small bullish candle will suggest a weak exit pressure and vice versa.
Confirm with technical indicators
Traders can look for volume as the harami pattern forms. A decreasing volume confirms a weakening bearish trend whereas an increasing volume confirms a weakening bullish trend. Some other indicators like MACD or RSI can be used for further confirmation.
Enter the trade
Traders can enter a short position as soon as the price breaks below the low point of the second candlestick or enter a long position as soon as the price breaks above the high point of the second candlestick.
Set stop-loss
Traders should set stop-loss levels to Protect their capital from significant losses.
- For a bullish harami, place the stop-loss below the low of the first (large) bearish candlestick
- For a bearish harami, place it above the high of the first (large) bullish candle
Consider trailing the stop-loss as the price moves in the trader’s favor to protect gains.
Set take-profit
Set take-profit levels based on the risk-reward ratio. The take-profit level will be a fixed percentage that is placed below the entry point or a support level during a bullish harami pattern formation and vice versa.
Monitor and manage
Lastly, continuously monitor the market for changes in price, volume, and other indicators. Traders should be prepared to adjust stop-loss or take-profit levels based on market conditions.
Evaluating the effectiveness of harami patterns
Success Rate and Reliability
- Probabilistic indicator: Harami candlestick patterns provide market insights that are based more on probability and not certainty. Research shows that a bearish harami candlestick pattern can work 50%-60% of the times
- Pattern confirmation: Harami patterns should be used along with technical tools to improve trade reliability. Volume indicators, momentum indicators, support and resistance levels, and more are tools that work well with the harami patterns.
- Market context: The pattern's effectiveness can vary based on market conditions (trending, ranging, volatile). For example,
- Trending markets: Harami patterns often signal reliable reversals
- Ranging markets: Harami patterns are less reliable due to frequent price reversals
- Volatile markets: Harami patterns can be obscured by rapid price fluctuations
Factors affecting harami pattern probability
- Pattern precision: The exact formation of the harami, including the size of the engulfing candle and the placement of the smaller candle, influences its predictive power
- Volume analysis: High volume accompanying the harami candlestick pattern can strengthen its significance, indicating a potential shift in market sentiment
- False signals: Harami candlestick patterns can produce false signals, especially in ranging or sideways markets. Traders should use additional confirmation before entering trades
Advantages and risks of trading with the bullish and bearish harami patterns
Advantages
Low-risk entries
Since harami patterns are known to indicate potential trend reversals and continuations, traders are provided with a low-risk entry price point compared to entering a trade at the peak of a moving trend.
Use of Fibonacci levels
Combining harami patterns with Fibonacci retracement or extension levels can help identify potential reversal zones or gain targets. This synergy between tools can increase the accuracy of trade setups.
Cross-asset strategy
Harami patterns are versatile enough to be applied across different types of currency pairs (like major, minor, and exotic) and can even be used in different asset classes (like equities, CFDs, and more). Hence, trades can use the pattern to trade different markets in different timeframes.
Preceding major news
Harami patterns may form before major economic news releases, hinting at possible market sentiment shifts. This can be particularly useful in Forex trading, where news events frequently cause abrupt price movements.
Risks
False signals
Harami patterns can produce false signals sometimes especially when the markets are too volatile and price action quickly changes direction.
Dependence on context
Traders must understand the broader market context while trading with harami patterns to ensure that they properly gauge trend direction, volume, and more.
Limited information
Harami patterns, being only two-candle patterns, provide limited information about market sentiment. Traders may need to rely on additional technical analysis or patterns to get a complete picture of market dynamics.
Short-term nature
Harami patterns are viewed as short-term signals and hence they may not be fit to produce sustained trends in the long-term with significant price moves. Hence, traders who want to hold positions for the long term may not be able to analyze market momentum with harami patterns accurately.
Tips to consider for trading harami patterns
- Trend exhaustion signals: Look for signs of trend exhaustion preceding the harami candlestick pattern, such as long wicks or decreasing momentum indicators. This context can reinforce the likelihood of an accurate reversal
- Integration with moving averages: Incorporating moving averages can help confirm the validity of harami patterns. A bullish harami near a major moving average support can be a stronger long signal, while a bearish harami near resistance can confirm an exit signal
- Pattern size and proportions: The relative size of the candles in the harami pattern can provide additional clues. A significantly smaller second candle often indicates a stronger potential reversal.
- Avoid low-volume markets: Harami patterns in low-volume markets can be less reliable due to the increased likelihood of erratic price movements. Ensure adequate volume to confirm the pattern's validity.
Trading with the harami pattern with other indicators
Bullish and bearish harami patterns help identify potential trend reversals, but they are not foolproof. False signals and market noise can lead to losses. To mitigate risks, traders should combine harami patterns with other technical analysis indicators, use stop-loss orders to limit potential losses, and carefully manage position size. Additionally, understanding the market context and practicing effective risk management are also needed for proper harami trading.
Disclaimer: All material published on our website is intended for informational purposes only and should not be considered personal advice or recommendation. As margin FX/CFDs are highly leveraged products, your gains and losses are magnified, and you could lose substantially more than your initial deposit. Investing in margin FX/CFDs does not give you any entitlements or rights to the underlying assets (e.g. the right to receive dividend payments). CFDs carry a high risk of investment loss.