Keltner Channel is a technical indicator that provides traders with strong continuation signals and trend directions by assessing a currency pair's price volatility. Understanding the Keltner Channel indicator enables traders to place better entry orders and predict market reversals. In this article, we take a look at how the Keltner Channel works and how you can incorporate it in your trading strategy.
What is the Keltner Channel?
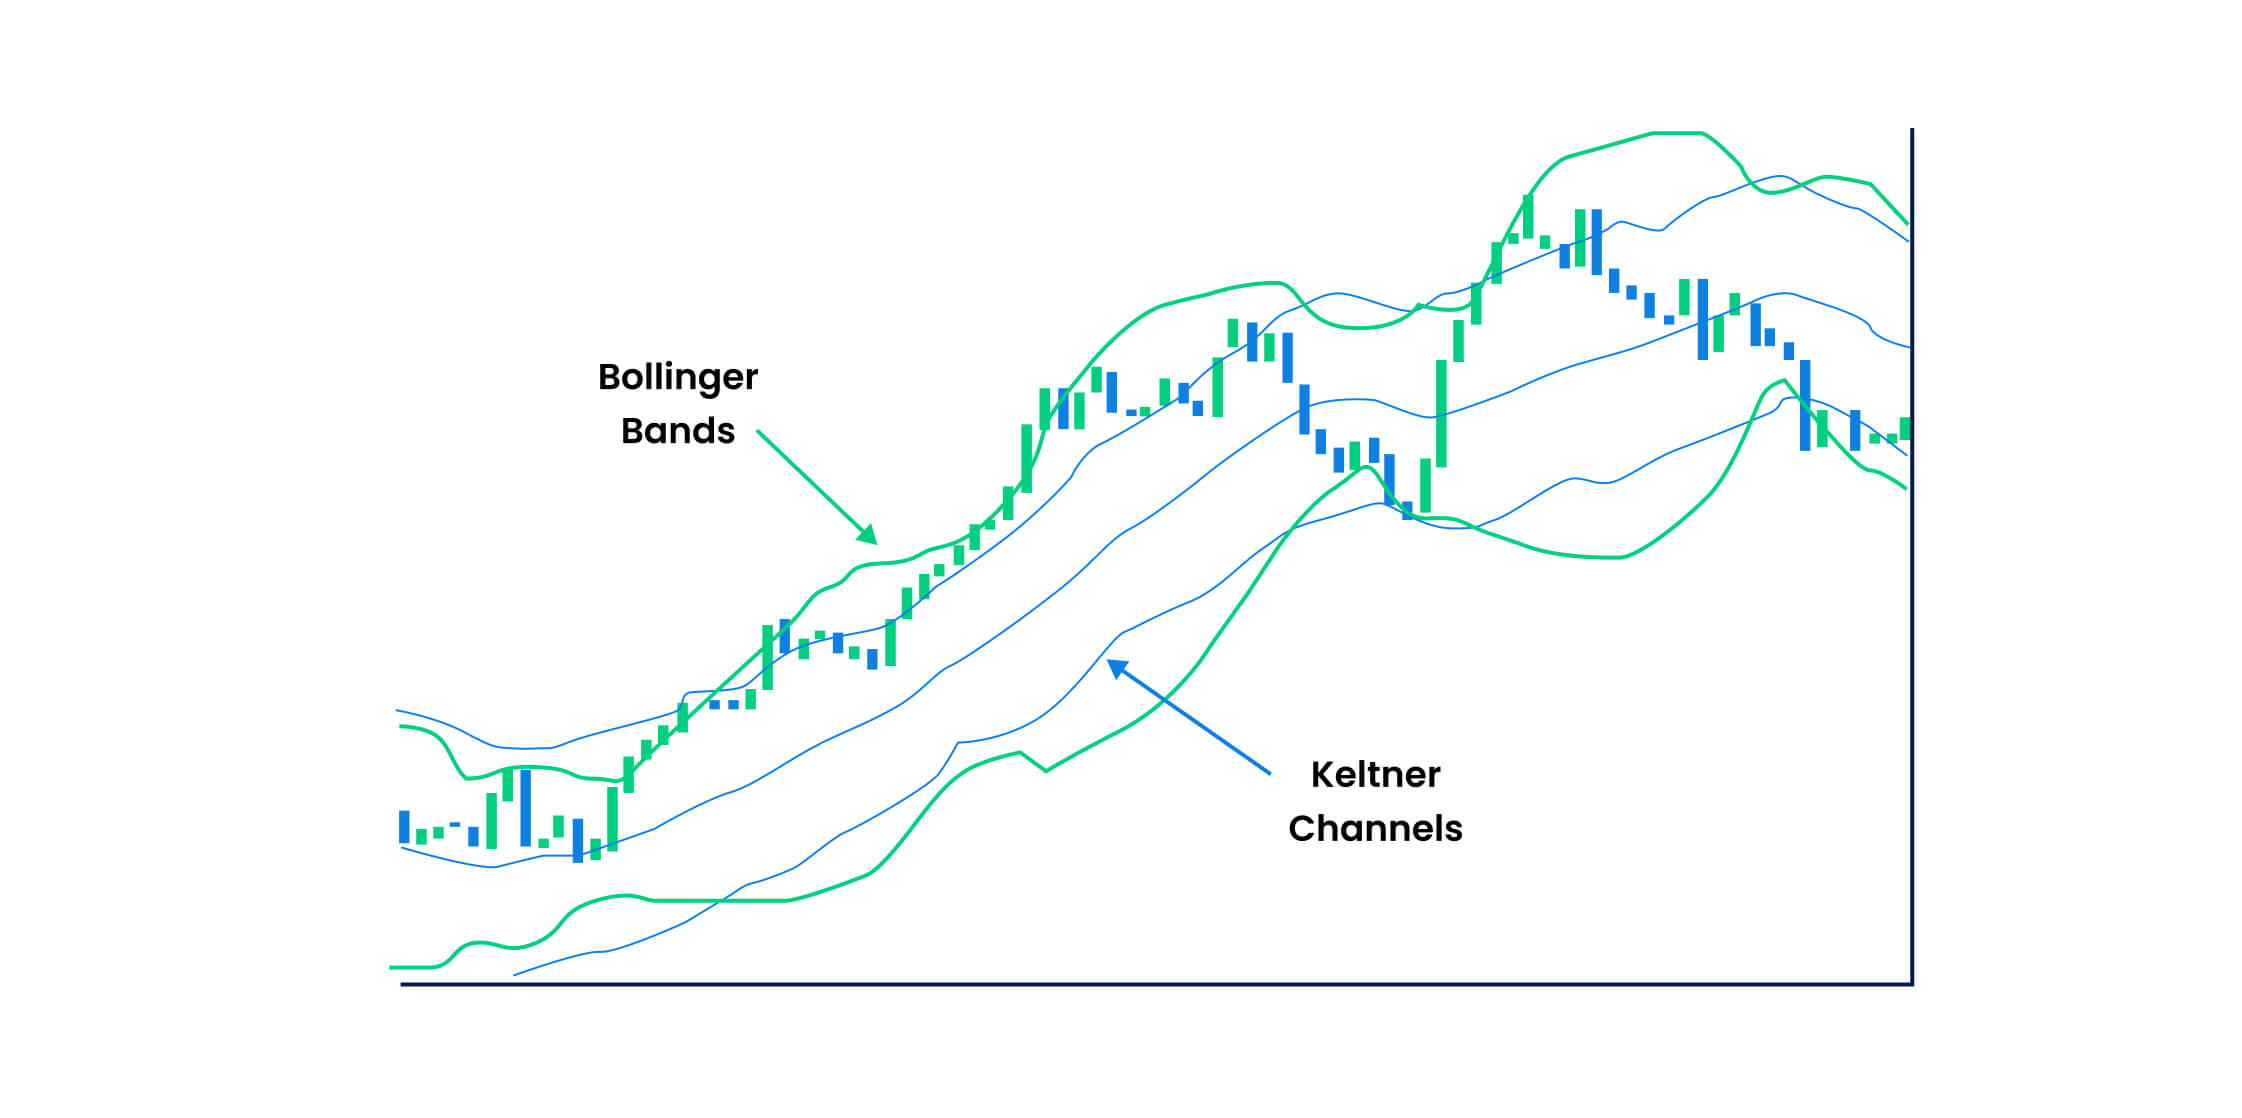
Keltner Channel is a volatility trading indicator that includes a set of bands that are placed above and below the currency pair's price to determine its trend direction. The upper band depicts a price expansion, whereas the lower band depicts a price contraction. The indicator uses market volatility or Average True Range to depict continuation patterns by breaking below or above the top and bottom bands.
- When the currency pair prices reach the upper band, it indicates a bullish market momentum, signalling traders to enter the market
- When the currency pair prices reach the lower band, it indicates a bearish market momentum, signalling traders to exit the market
Both the lower and upper bands indicate how deviated the currency pair prices are from its mean price and if the market is oversold or overbought.
- An overbought market is when the currency pair prices trade above actual price, on the upper band
- An oversold market is when the currency pair prices trade below the actual price, on the lower band
The pattern includes:
- An upper channel band depicting overbought levels which is calculated as the 20-period Exponential Moving Average + [ 2 * Average True Range]
- A lower channel band depicting oversold levels which is calculated as the 20-period Exponential Moving Average – [ 2 * Average True Range]
- A middle line which is the 20-period Exponential Moving Average itself
What are the top Keltner Channel strategies?
Bollinger Bands and Keltner Channel
Bollinger Bands use trend lines that are a few standard deviations away from the average price of a currency pair to determine if the markets are overbought or oversold. When combined with the Keltner Channel, the Bollinger Bands Keltner Channel strategy provides traders with a strong trend direction and market volatility that can be used to better time the entry orders.
- When the Bollinger Bands squeeze inside the Keltner Channel, the market is less volatile, with a potential breakout in place. It suggests traders take long positions to benefit from the increasing market in the future.
- When the Bollinger Bands squeeze inside the Keltner Channel, and the market starts trading flat after a price high, the bands contract and suggest traders exit the market with a sell order.

Keltner Channel and Donchian Channels
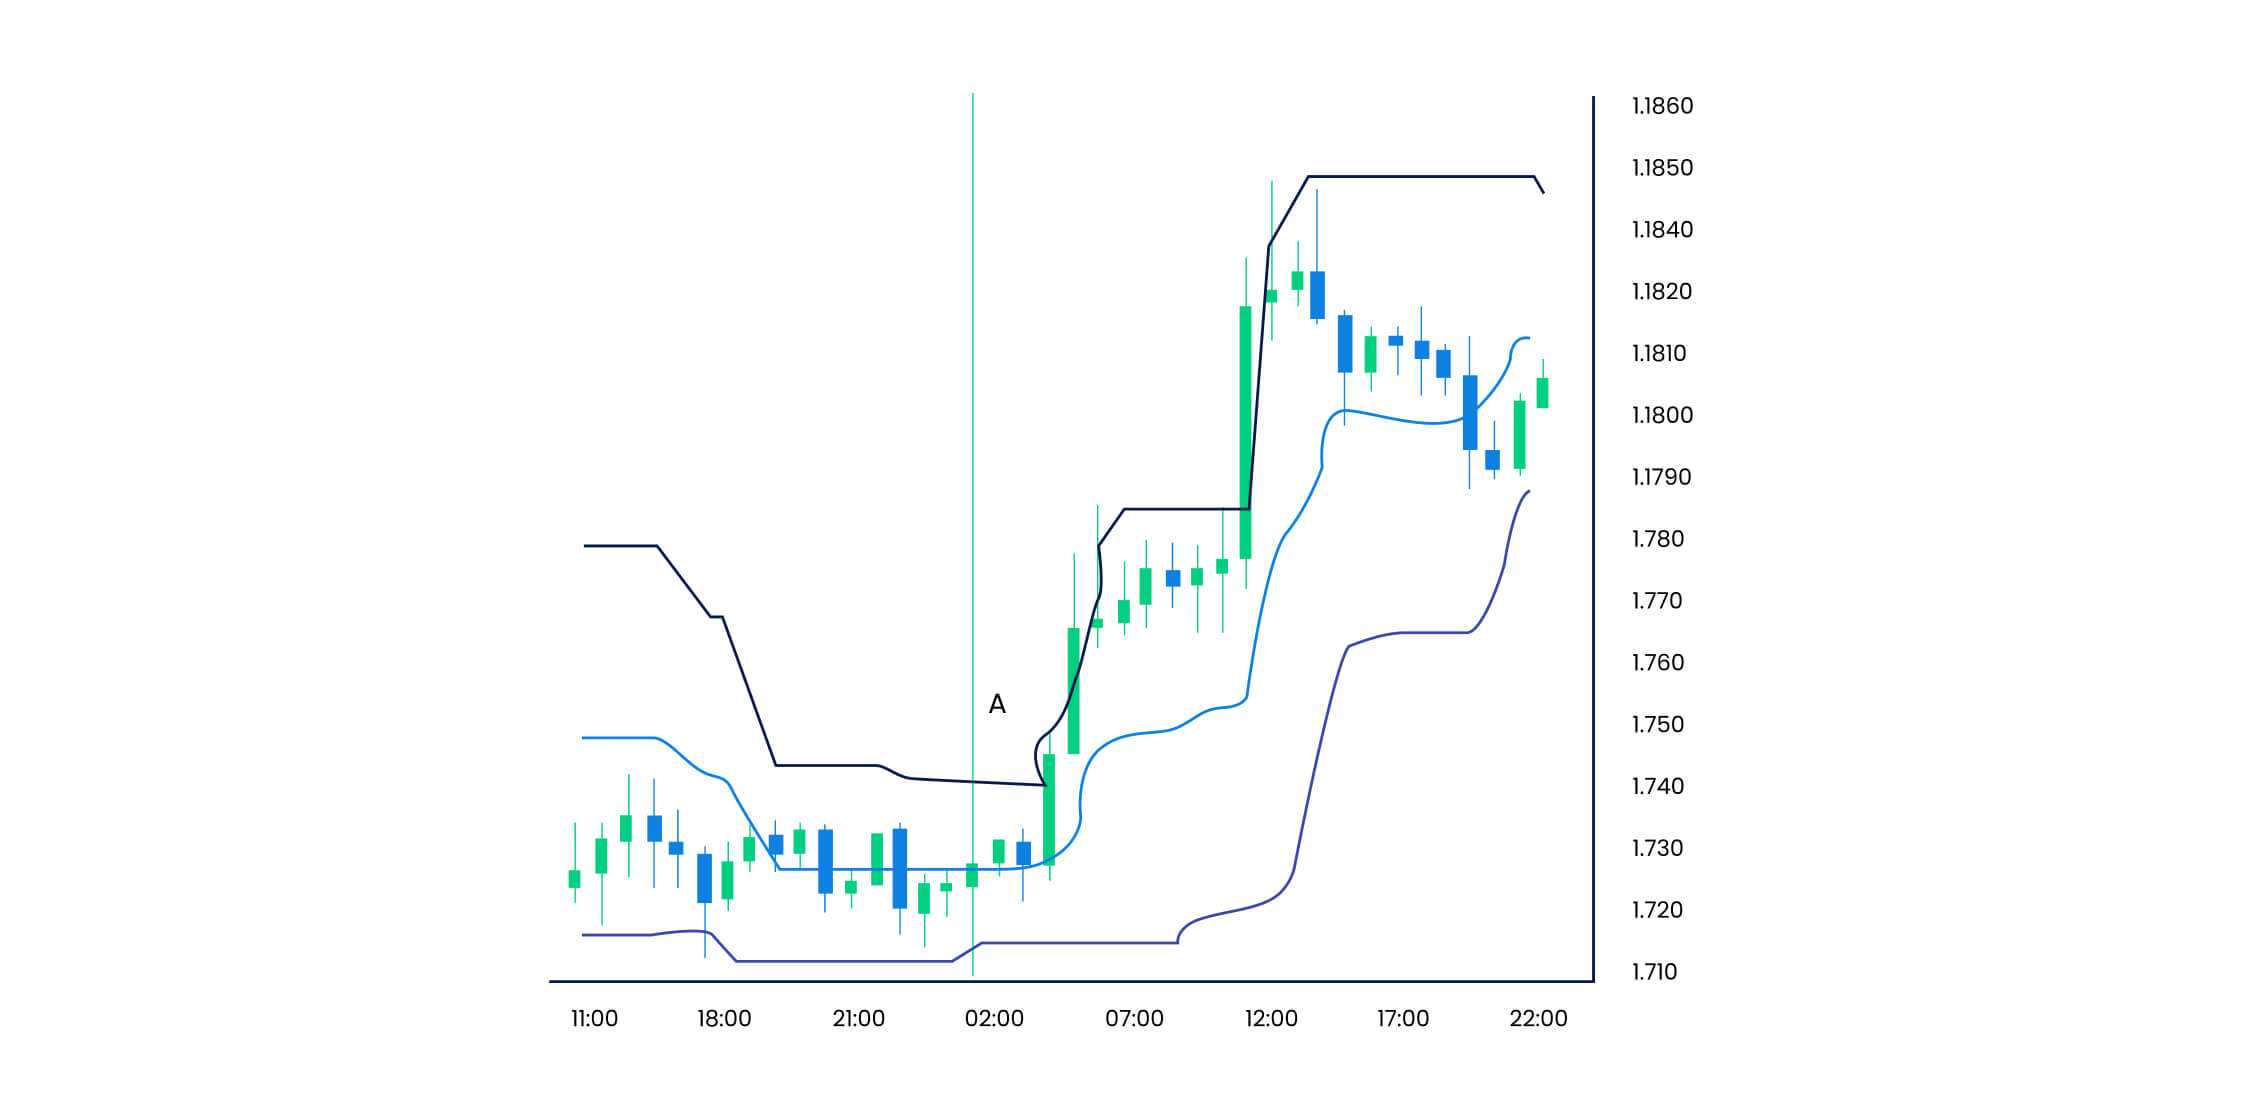
Donchian channels are formed with the highest high and lowest low price of a currency pair that help traders identify entry and exit signals. The currency pair price fluctuations are studied through these channels to also understand a new or continuous trend in the market to place long and short orders. When combined with the Keltner Channel, market trends along with ideal entry and exit points are confirmed by comparing the high and low prices with the upper and lower bands. An uptrend takes place as soon as the currency pair price exceeds the range high price, and a downtrend is confirmed as soon as the currency pair price crashes below the range low price.
- Buy or long signals are sent to traders whenever the currency pair price moves beyond and closes above the upper band
- Sell or short signals are sent to traders whenever the currency pair price closes below the lower band

How to trade with the Keltner Channel
1. Pullbacks
A trader can use the Keltner Channel during a solid trend to trade pullbacks. The currency pair price behaviour around the lower and upper bands indicate the strength of a trend.
- If the currency pair price is trading near to the upper band, it indicates a strong bullish trend
- If the currency pair price is trading near to the lower band, it indicates a strong bearish trend
The Keltner Channel provides traders with an area where the currency pair price potentially bounces either upward or downward, signalling traders to take long or short positions, respectively.
2. Ranging Markets
In a ranging market, the currency pair prices do not usually touch the upper band or the lower band. The currency pair prices mostly trend near the middle band in this case. The Keltner Channel bands can be used to trade the ranging market by combining it with a Relative Strength Index indicator that helps traders measure overbought or oversold market conditions.
- Enter a long position if the currency pair price breaks above the middle band
- Enter a short position if the currency pair price breaks below the middle band
- Buy orders are signalled whenever the RSI value is below 10 as it indicates an oversold market
- Sell orders are signalled whenever the RSI value is above 90 that, as it indicates an overbought market
3. Breakouts
Keltner Channel can be used to trade breakouts when the market is volatile. You can combine the Keltner Channel with the Average Directional Movement index that depicts the strength of a breakout in the forex market. Readings of the ADM Index above 20 signal a new trend beginning, and readings below 20 indicate market indecision or weak trends. The higher the reading of the Average Directional Movement index, the stronger the trend in the market.
- Enter a buy position when the Keltner Channel bands are flat, and currency pair price breaks beyond the upper band with the Average Directional Movement index crossing the reading of 20 that signals an upward market continuation
- Enter a sell positional when the Keltner Channel bands are flat, and currency pair price breaks below the lower band with the Average Directional Movement index dipping below the reading of 20 that signals a downward market continuation
Trade with the Keltner Channel to identify market trends
Trading with the Keltner Channel helps traders identify strong market trends, trade pullbacks and seamlessly identify ideal entry and exit signals. Once you combine the Keltner Channel with other technical indicators, new trading opportunities emerge that can help you become a successful forex trader. Ready to use Keltner Channel to profit from your forex trades? Sign up for a live trading account or try a demo account on Blueberry.


