


Identifying trend reversals early in forex can make all the difference. That’s where the RSI divergence indicator comes in. By comparing price movements with this tool, traders can spot potential shifts in price momentum before they become obvious.
Let’s discuss the RSI divergence indicator and how to use it for trading in the financial markets.
The RSI divergence indicator: Explained
The Relative Strength Index (RSI) divergence indicator identifies potential trend reversals. It compares price movements with RSI values. RSI divergence occurs when price and RSI disagree. Lower lows in price with higher RSI suggest strength. Higher highs in price with lower RSI show weakness. This tool helps refine trade entries and is useful for short-term and long-term analysis. In the RSI divergence indicator, values range from 0 to 100. These RSI readings indicate the following –
- Above 70 (overbought line): Overbought condition, signaling potential reversal or price correction
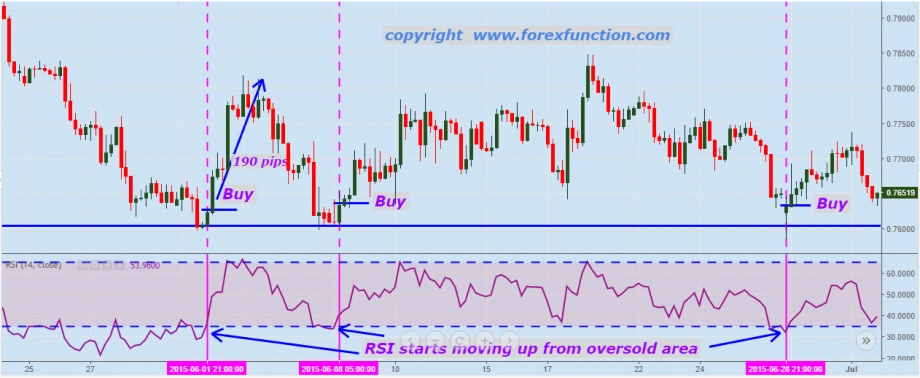
- Below 30 (oversold line): Oversold condition, hinting at possible price rebound
- 50 level (neutral line): Neutral point, representing balance between long and short pressure
RSI divergence types: bullish divergence vs bearish divergence
A bullish RSI divergence occurs during a price downtrend. Price forms lower lows, showing continued weakness. Meanwhile, RSI makes higher lows, signaling strength. This indicates a possible trend reversal to the upside. Traders often enter a long trade when a bullish divergence appears.
In contrast, a bearish RSI divergence occurs in uptrends. The price makes higher highs, indicating rising momentum. However, the RSI forms lower highs, showing weakness. This signals a potential price drop ahead, which traders use to identify short opportunities.
Top RSI divergence indicator strategies
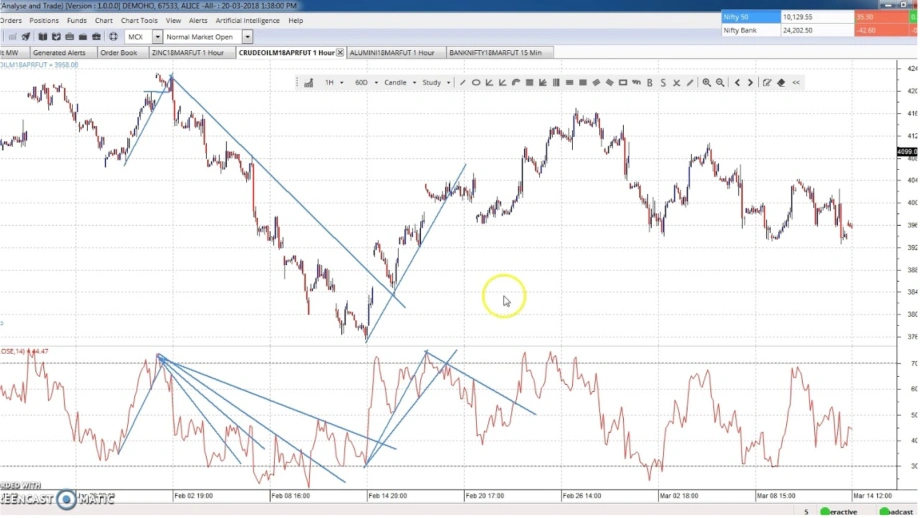
RSI divergence with trendlines
This strategy combines RSI divergence with trendlines. Traders draw trendlines on price and RSI simultaneously, looking for divergence between them.
Traders enter long trades after a bullish breakout. Short trades are taken on bearish breakdowns. This strategy also improves trade timing accuracy.
RSI divergence with support and resistance
Traders combine RSI divergence with support and resistance zones to identify key levels where prices frequently react. They look for divergence at these significant levels, and RSI signals confirm potential reversals, strengthening entry and exit precision.
Traders enter long trades near strong support with bullish divergence. Short trades are taken at resistance with bearish divergence.
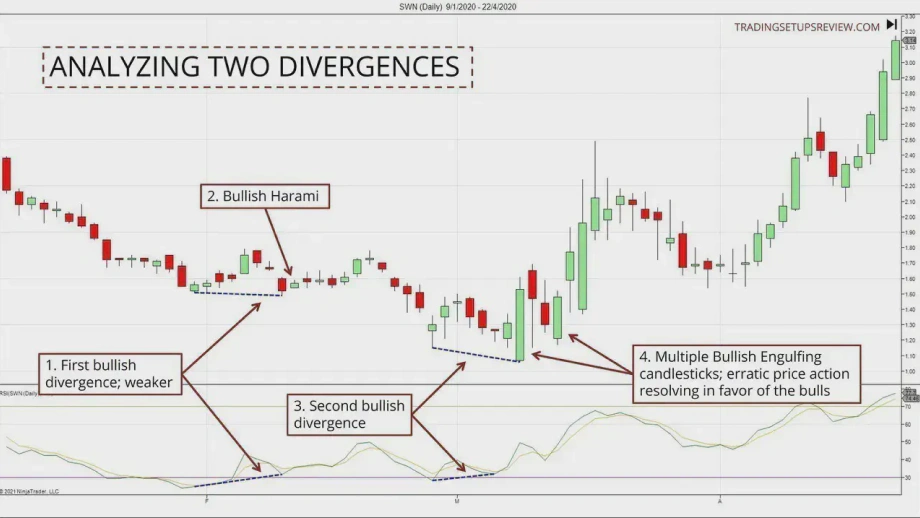
RSI divergence with candlestick patterns
RSI divergence with candlestick patterns improves signal reliability. Traders identify patterns like doji or engulfing candles and match them with RSI, showing divergence. The combination increases reversal prediction accuracy. Candlestick patterns confirm trend change possibilities.
Traders enter long trades on bullish patterns with divergence. Short trades follow bearish patterns with divergence.
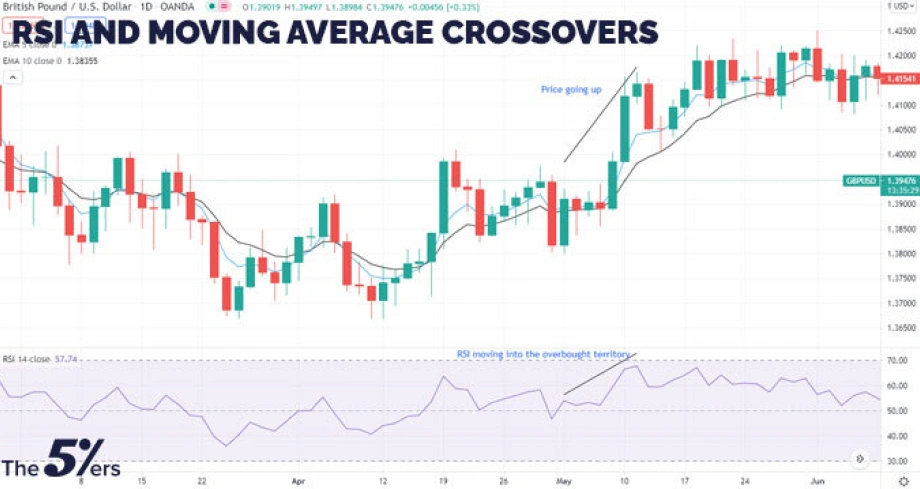
RSI divergence with moving averages
Traders can use RSI divergence with moving averages to identify market trends. Combine divergence for momentum and trend clarity. RSI confirms when trends lose strength. Moving average crossovers improve decision accuracy. This method also betters overall market timing. Stronger confluence increases trade reliability.
Traders enter long trades when the RSI shows bullish divergence with an uptrend. Short trades occur when the RSI shows a bearish divergence with a downtrend confirmation.
Advantages and disadvantages of using the RSI divergence indicator
Advantages
- Early reversal signals: The RSI divergence indicator helps traders anticipate potential trend reversals before they occur
- Identifies weakening trends: It reveals when momentum is losing strength, signaling a possible trend shift
- Works across timeframes: The indicator is effective for both short-term and long-term trading strategies
- Clear risk-reward setups: It provides clearer entry and exit points, making it easier to set risk-reward ratios
Disadvantages
- False signals in strong trends: The indicator can generate misleading signals during strong market trends. This might happen due to an already strong momentum in the market
- Requires confirmation: Traders must use additional indicators or tools for more reliable decisions
- Ineffective in sideways markets: In sideways markets, RSI divergence generates frequent false signals due to constant price momentum without clear trends
- Can be less reliable in volatile conditions: During periods of high volatility, RSI divergence signals may be distorted, leading to misinterpretations
How to use the RSI divergence trading strategy?
Identify the trend direction
Before using RSI divergence in forex, determine the prevailing trend. Focus on an uptrend or downtrend to spot potential reversals using divergence.
Look for divergence
Observe the price chart for divergence between price action and the RSI indicator. For bearish divergence, look for higher price highs and lower RSI highs. For bullish divergence, look for lower price lows and higher RSI lows.
Confirm divergence with trendlines or support/resistance
Then, draw trendlines on both price and RSI to confirm divergence. Alternatively, check if divergence occurs near key support or resistance levels for confirmation.
Wait for confirmation
Look for further confirmation, such as a candlestick pattern or a breakout. This will ensure the divergence signals a real reversal and is not just market noise.
Enter the trade
Once confirmed, enter the trade. For a bullish divergence, enter a long trade when the price shows signs of reversal. For a bearish divergence, short when the price starts to turn downward.
Set stop-loss and take-profit levels.
Place a stop loss to limit potential losses in case the divergence fails. Set take-profit levels based on previous support/resistance zones or a fixed risk-reward ratio.
Monitor the trade
Watch the trade closely for any changes in market conditions or RSI moves. If divergence weakens or market trends shift, consider closing the position early.
This is an example only to enhance a consumer's understanding of the strategy being described above and is not to be taken as Blueberry providing personal advice.
Optimize forex trades with the RSI divergence indicator
Trading with RSI divergence works in trending markets, where clear uptrends or downtrends provide the right opportunities for reversals. However, traders must avoid common mistakes like trading sideways or choppy market dynamics, where false signals are frequent. Also, don’t rely solely on divergence. One must always confirm with other technical indicators.
Disclaimer: All material published on our website is intended for informational purposes only and should not be considered personal advice or recommendation. As margin FX/CFDs are highly leveraged products, your gains and losses are magnified, and you could lose substantially more than your initial deposit. Investing in margin FX/CFDs does not give you any entitlements or rights to the underlying assets (e.g. the right to receive dividend payments). CFDs carry a high risk of investment loss.