


The wedge patterns are a part of the technical analysis in forex that signals potential price reversals or continuations. By understanding wedge patterns, traders aim to identify entry and exit points that capitalize on market direction changes.
Throughout this guide, we will delve into the characteristics of rising and falling wedges, their implications for price action, and practical strategies for incorporating them into one’s trading strategy.
What is a wedge pattern?
The wedge pattern is characterized by converging trendlines, which means the upper and lower boundaries of the price movement gradually come closer over time. These patterns signal changes in price direction and can indicate either a reversal (price breaking out of the established trend) or a continuation (price bouncing off the trendlines).
There are two main types of wedge patterns:
-
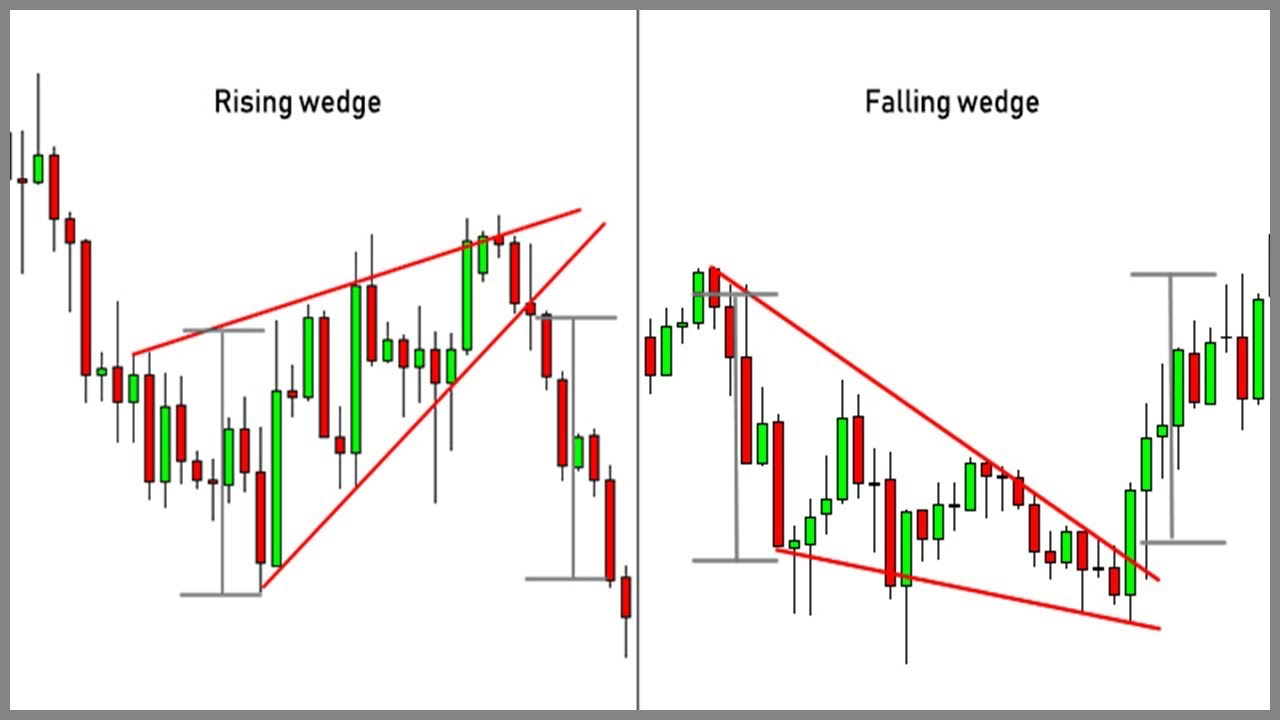
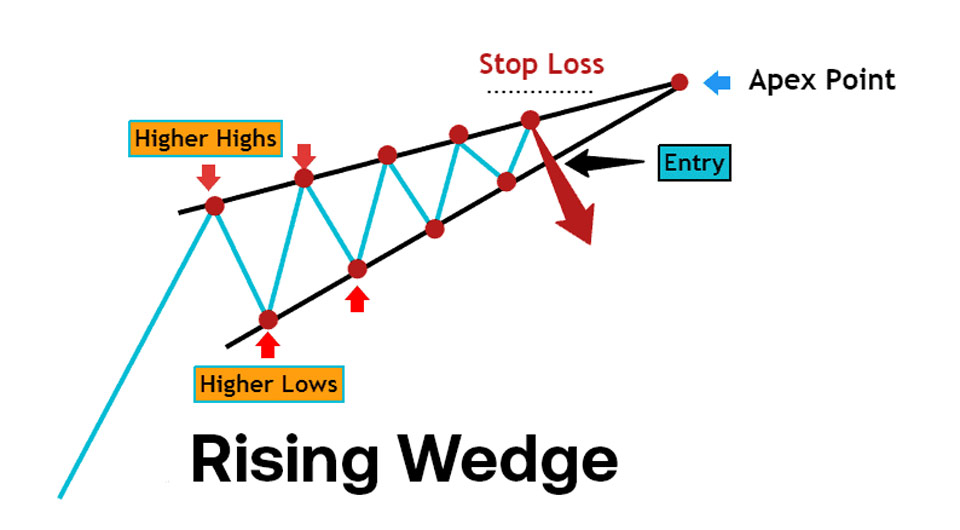
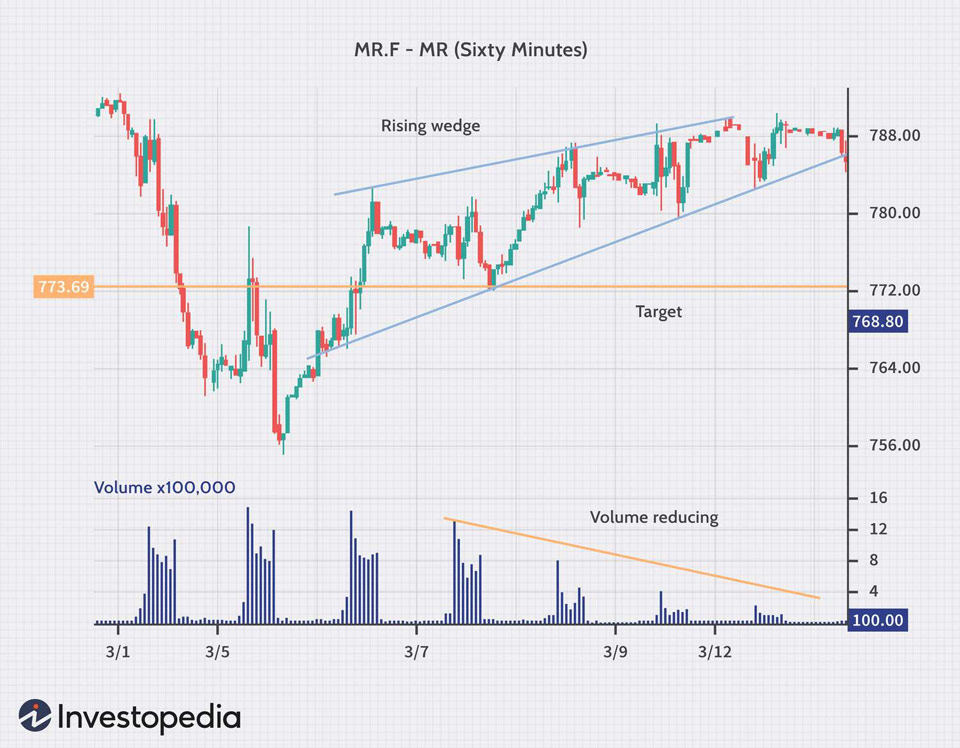
Rising (bearish) wedge: This forms when the price makes higher lows but struggles to reach new highs. The upper trendline slopes upwards, while the lower trendline has a steeper incline. It can suggest an impending upward breakout or a potential downturn
-
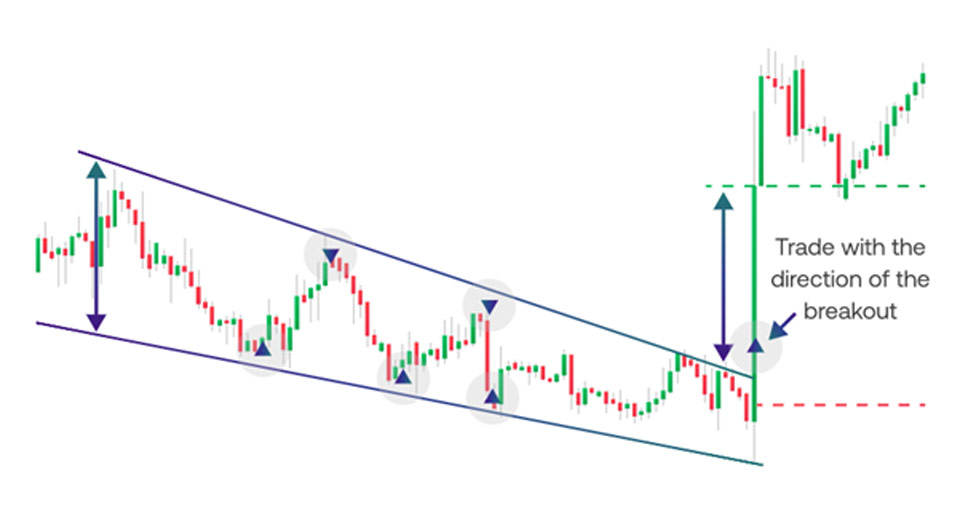
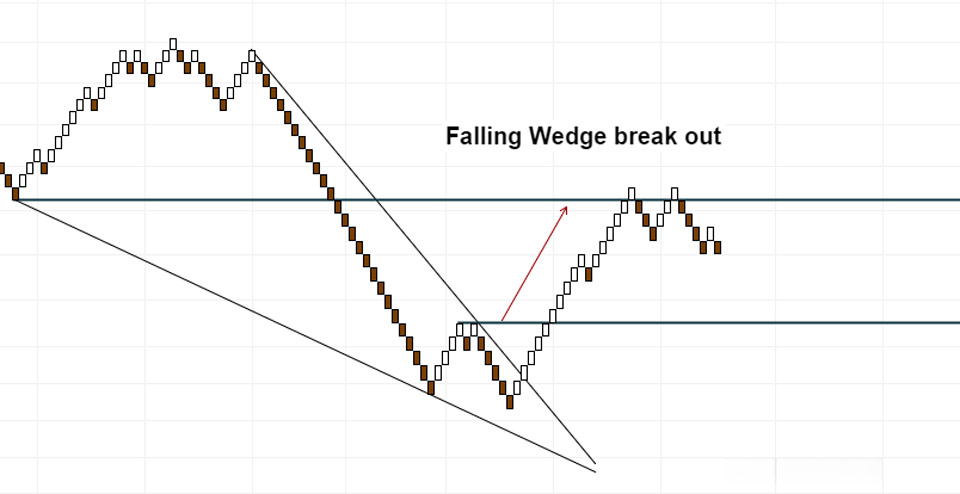
Falling (bullish) wedge: This forms when the price makes lower highs but struggles to reach new lows. The upper trendline slopes downwards, while the lower trendline declines steeply. It can indicate an impending downward breakout or a potential upward reversal
Characteristics of the wedge pattern include:
-
Apex: This is the point where the trendlines meet, signifying the potential culmination of the price movement within the wedge
-
Volume: Volume decreases as the price progresses through the wedge, indicating diminishing momentum within the current trend. However, as the price approaches the apex, volume often increases, signaling a potential breakout or reversal
-
Breakout: This occurs when the price decisively breaches one of the trendlines. A rising wedge's breakout above the upper trendline suggests an upward continuation. A breakout below the lower trendline in a falling wedge suggests a downward reversal. Conversely, a price rejection at the trendline can signify a continuation of the existing trend
Identifying Wedge Patterns
Charts
The following charts help in identifying wedge patterns –
Candlestick charts
Candlestick charts present price movements within a specific time frame using bars with a body and wick that reflect the open, high, low, and close prices. Candle body sizes and wick lengths can help visualize the converging trend lines in wedges. Consistent higher lows and lower highs create the narrowing channel characteristic of wedges.
Breakouts above the upper trendline in a rising wedge or below the lower trendline in a falling wedge can be bullish or bearish signals, respectively. Price rejections at the trendlines may indicate a continuation of the existing trend.
Renko charts
Renko charts focus on price movements rather than time. A new brick is added to the chart only when the price moves a predefined minimum distance. Because of this, price action becomes smoother, making it easier to identify the converging trend lines of a wedge pattern.
A breakout above the wedge's upper trend line with a price move closing above the same with a Renko brick helps traders spot upward breakouts. On the other hand, a breakout below the wedge's lower trend line with a price move closing below the same confirms a potential for a downward breakout. The current trend continues when there is a price rejection at either of the trendlines.
Tick charts
Tick charts capture every price change, resulting in a series of horizontal lines, with each tick represented by a new line. Unlike time-based charts, tick charts disregard time intervals and focus solely on price changes. This allows traders to see the raw price action, making it easier to spot the convergence of the upper and lower boundaries of the wedge pattern.
Look for clusters of ticks forming diagonal lines. These represent areas of support (lower trendline) and resistance (upper trendline). The gradual shortening of the distance between these clusters signifies the convergence characteristic of a wedge. A cluster of ticks closing consistently above (or below) the upper (or lower) trendline indicates a strong upward (or downward) breakout.
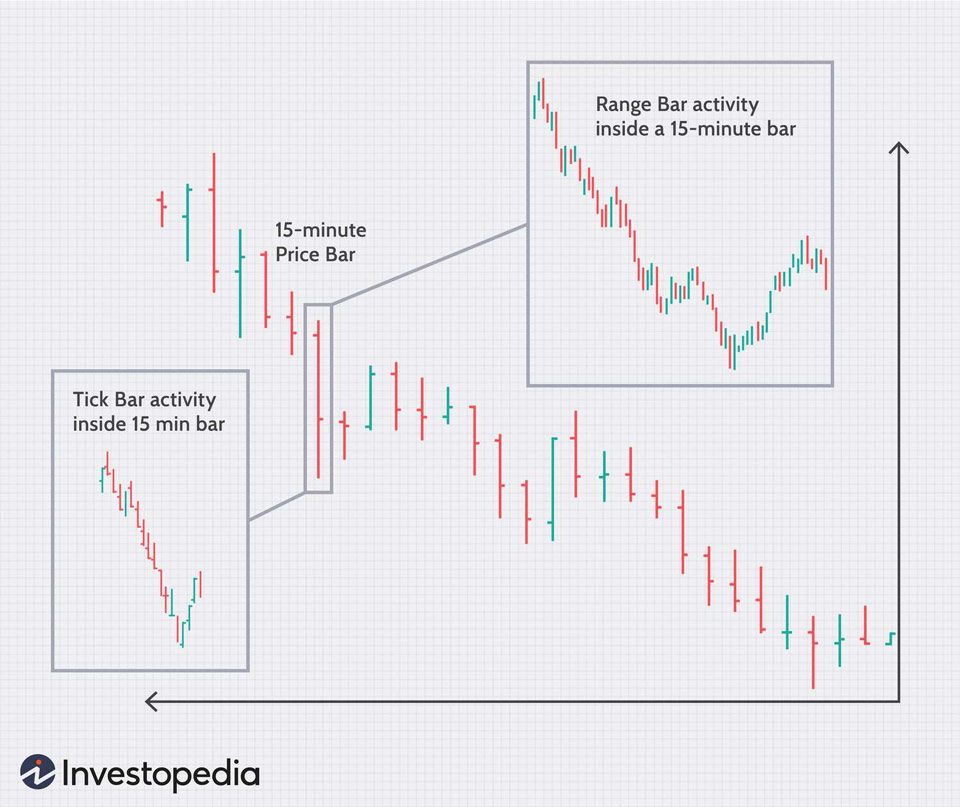
Range bar charts
Range bar charts depict price movement within a specific timeframe, but instead of using the open and close prices, they represent the high and low within that period. Since range bars depict the high and low of a timeframe, focus on how these highs and lows connect.
Look for a series of higher highs and lower lows forming the upper trendline in a rising wedge and lower highs and higher lows forming the upper trendline in a falling wedge. As the pattern progresses, the distance between these highs and lows should gradually narrow, signifying the convergence of the wedge. A breakout below (above) the lower (upper) trendline signifies a potential for downward (upward) reversal. Stop-losses should be placed below (above) the lowest (highest) range bar low (high).
Indicators
The below indicators confirm the wedge pattern signals when used together –
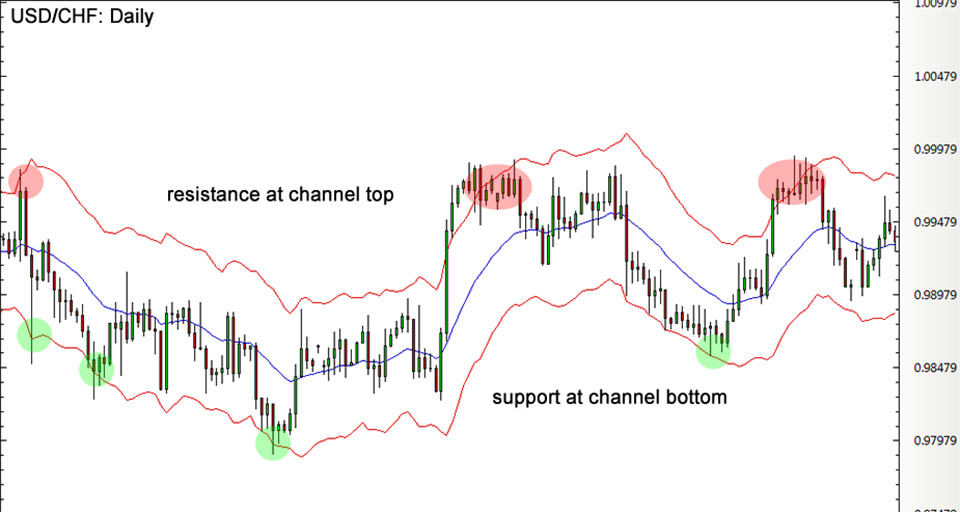
Keltner channels
Keltner Channels consist of a central moving average line bound by upper and lower bands calculated based on a set average true range (ATR) multiplier. The upper and lower bands can act as visual confirmations of the wedge's trendlines.
As the price action progresses within the wedge, the channels should also gradually narrow, mirroring the convergence of the trendlines. A price move that decisively closes outside the Keltner Channels strengthens the breakout signal suggested by the wedge pattern.
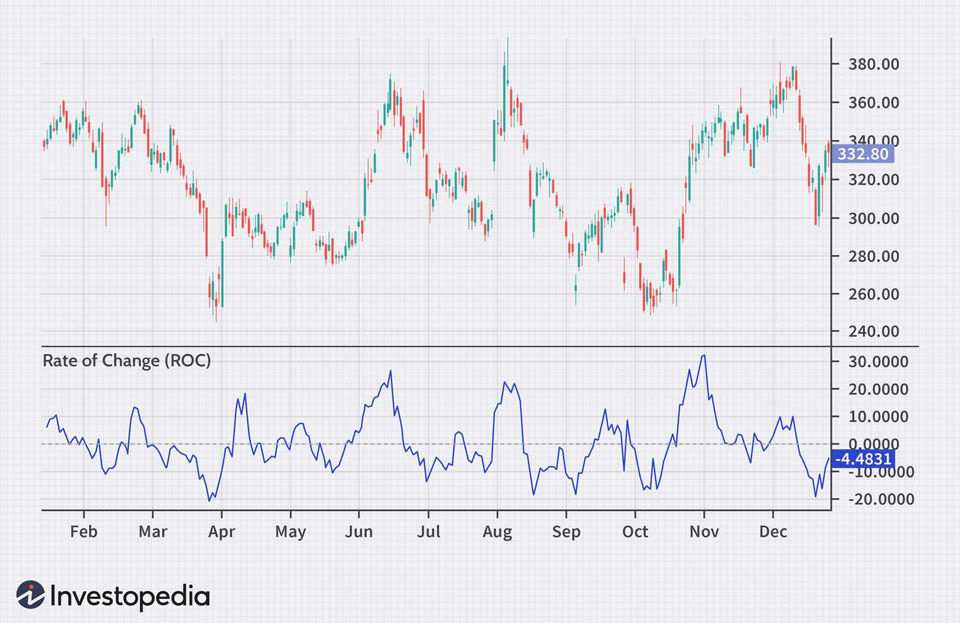
Rate of change (ROC)
ROC is an indicator that measures the percentage change in price over a specific timeframe. Traders can analyze ROC for divergences. As the wedge progresses, the price might consolidate, but a rising ROC suggests increasing long pressure, potentially indicating an upward breakout from the wedge. Conversely, a falling ROC despite a rising wedge could indicate weakening momentum and a possible false breakout.
A surge in the ROC coinciding with a breakout from the wedge can further confirm the validity of the signal, especially for a potential upward continuation.
Price oscillators
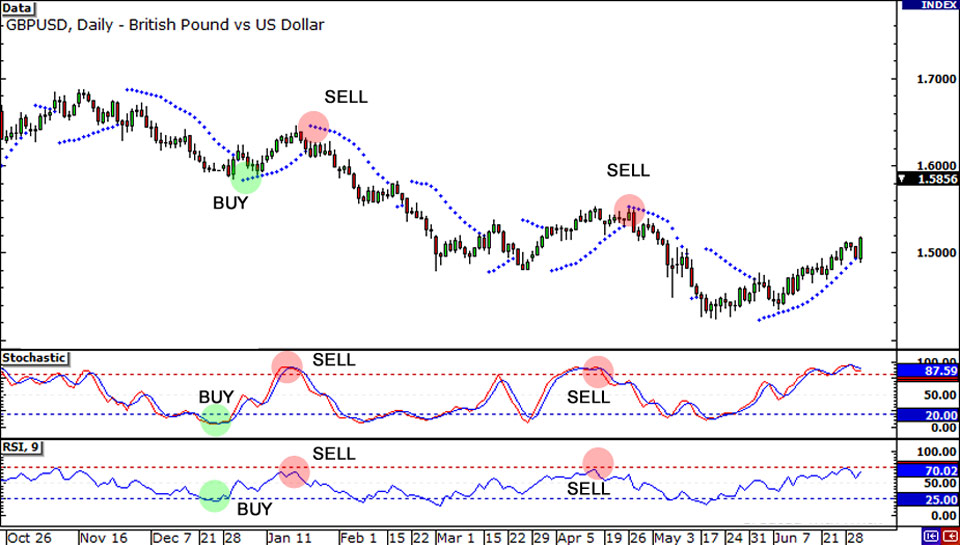
Price oscillators like the Relative Strength Index (RSI) or Stochastic Oscillator fluctuate between 0 and 100, indicating overbought or oversold conditions. They help identify potential overbought or oversold conditions within the wedge. This helps in analyzing potential breakouts. For example, a rising wedge with an RSI reaching overbought territory might suggest a potential correction (downward move) even if a breakout occurs.
If the price oscillator hasn't reached extreme levels (overbought or oversold) before a breakout from the wedge, it can indicate more room for the price movement to continue in the direction of the breakout.
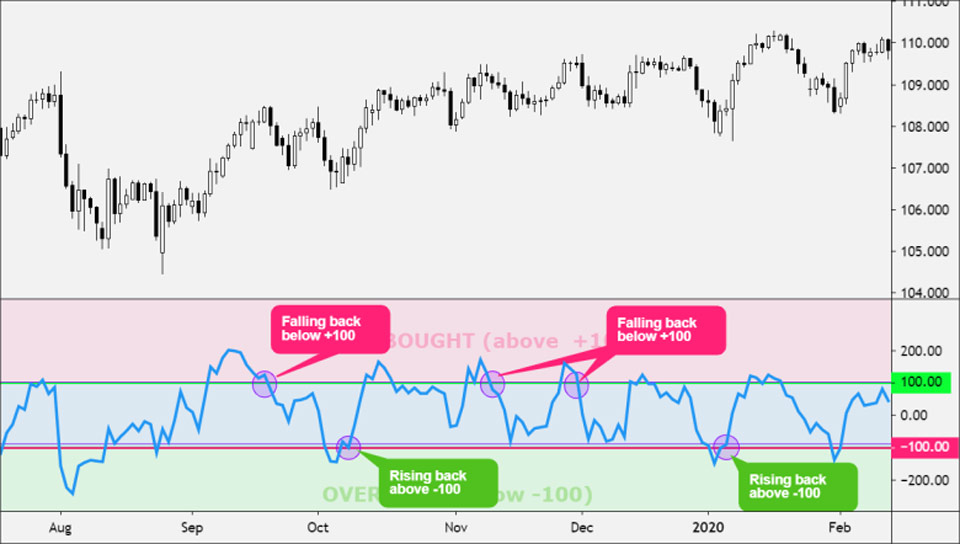
Commodity channel index
The CCI is a momentum oscillator that compares the current price to an average historical price. CCI also helps identify potential overbought or oversold conditions within the wedge.
This can help understand potential trend reversals or continuations. A breakout from the wedge accompanied by a CCI value that hasn't reached extreme levels can indicate a stronger breakout signal with more potential for price movement in the direction of the breakout.
Step-by-Step Guide: how to spot wedge patterns
Identify the trend lines
Look for a price chart where the price movement is confined between two converging trend lines. One trend line connects the peaks (highs), and the other connects the troughs (lows). The trend lines should be drawn with a slight angle, indicating a narrowing price range.
Distinguish between rising and falling wedges
Identify if the trend lines slope upwards for a rising wedge on a price chart. This pattern often appears during a downtrend and might signal a bearish reversal (price going down).
Conversely, identify a falling wedge when the trend lines slope downwards. This pattern often appears during an uptrend and might signal a bullish reversal (price going up).
Confirm declining volume
Ideally, trading volume should decline as the wedge progresses. This suggests decreasing price volatility and the potential for a breakout.
Watch for the breakout
The signal to look out for a breakout is a price break above the resistance line (rising wedge) or below the support line (falling wedge). A strong breakout with a high volume is considered more reliable.
External factors impacting the wedge pattern in forex
Carry trade strategies
Carry trade strategies involve borrowing a low-interest rate currency and investing it in a high-interest rate currency. This can impact exchange rates and potentially influence wedge pattern breakouts.
Sovereign debt ratings
A country's creditworthiness, as reflected by sovereign debt ratings, can influence investor confidence in its currency. A downgrade in credit rating can weaken a currency and contribute to a bearish breakout from a wedge pattern and vice versa.
Commodity prices
Fluctuations in global commodity prices can impact the currencies of countries that are major exporters or importers of certain commodities. A rise in the price of an export commodity can strengthen a currency and potentially lead to a bullish breakout in a wedge pattern.
Foreign exchange intervention
Central banks sometimes intervene in the forex market to trade their currency to influence exchange rates. Intervention to weaken a currency might precede a breakout from a rising wedge pattern, while intervention to strengthen it could signal a breakout from a falling wedge pattern.
Trading strategies to identify wedge patterns
Pullback trading strategy
This strategy involves waiting for a pullback (price retracement) after a breakout from the wedge pattern to enter a trade in the direction of the breakout. Pullbacks can help confirm the strength of the breakout from the wedge, especially if they occur at support/resistance levels within the wedge. Traders can enter a long position after a pullback on a bullish breakout and a short position after a pullback on a bearish breakout.
Time of day strategy
This strategy identifies times of day when a currency pair tends to be more volatile, potentially leading to stronger breakouts from wedge patterns. Volatility spikes can increase the chance of a breakout in wedge patterns. Traders should look for wedge patterns forming during historically volatile times for the currency pair to enter/exit trades accordingly.
Volume profile strategy
This strategy analyzes the trading volume at different price levels within the wedge to identify potential support and resistance zones. High volume areas within the wedge can indicate significant long or short pressure, potentially influencing the breakout direction.
Look for increased volume at the top/bottom trendlines of the wedge. Higher volume breakouts are considered more reliable. Traders can place stops just outside the high-volume zones within the wedge. Gain targets can be based on the height of the wedge or volume gaps outside the wedge.
Fibonacci extension strategy
This strategy uses Fibonacci retracement levels to project potential price targets after a breakout from the wedge pattern. It helps identify wedge patterns during post-breakout analysis.
Once a breakout occurs, Fibonacci retracement levels are drawn on the wedge to identify potential gain targets. Stops are placed as usual based on the wedge pattern, whereas gain targets are based on the Fibonacci extensions (typically 61.8% or 161.8%).
Common risks with the trading wedge patterns and how to avoid them
-
Trade execution slippage: Due to breakout trading, traders may experience slippage during trade execution, where the entry price differs from the expected price. Set limit orders to enter trades at specific price levels rather than market orders. This helps control the entry price and reduce the impact of slippage
-
Confirmation bias: Traders may fall victim to confirmation bias, seeking information that confirms their preconceptions about a wedge pattern breakout, leading to impulsive trading decisions. Always conduct objective technical analysis using multiple indicators and confirmatory signals to validate wedge patterns
-
Overlapping patterns: Wedge patterns can sometimes overlap with other patterns, such as triangles or channels, leading to confusion in interpretation and potential false signals. Use multiple time frames to confirm the wedge pattern and ensure it is not part of a larger, more complex pattern
Identify breakouts with wedge patterns in forex
Wedge patterns help traders identify reversals and continuations. However, when used alone, they might send false signals. Hence, traders should consider using technical indicators and backtesting techniques to confirm wedge pattern signals.
Disclaimer: All material published on our website is intended for informational purposes only and should not be considered personal advice or recommendation. As margin FX/CFDs are highly leveraged products, your gains and losses are magnified, and you could lose substantially more than your initial deposit. Investing in margin FX/CFDs does not give you any entitlements or rights to the underlying assets (e.g. the right to receive dividend payments). CFDs carry a high risk of investment loss.