


Cryptocurrency prices go up and down quickly, making it hard to know when to enter or exit a trade. Technical indicators can be a helpful part of a trader’s strategy, helping them analyze market trends and make decisions accordingly.
Let’s look at the top indicators for crypto trading and how to use them.
What are the top indicators for trading crypto?
Bollinger Bands
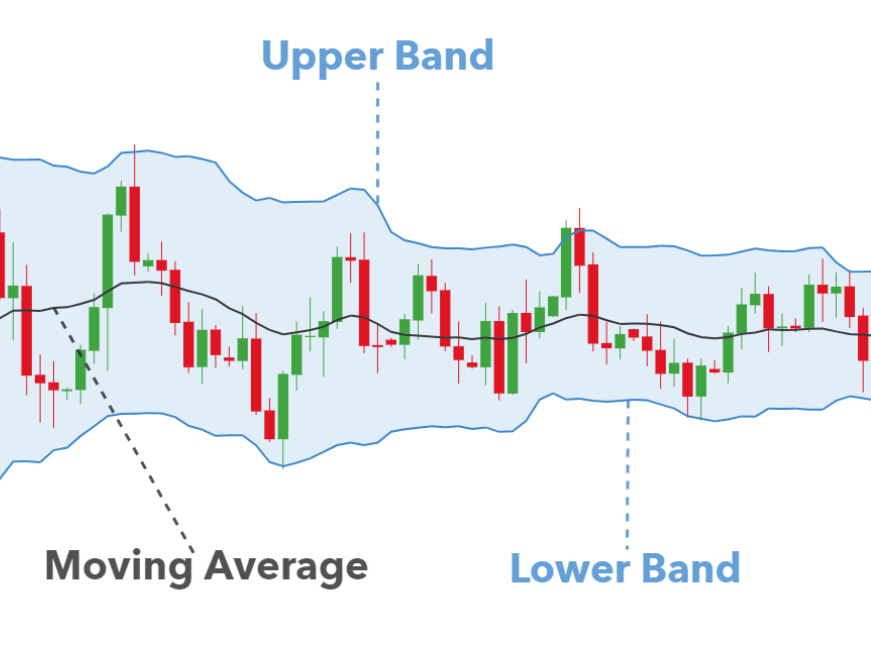
Bollinger Bands are a volatility indicator that consists of a middle simple moving average (SMA) and two bands set at a standard deviation level above and below the SMA. These bands expand and contract based on market volatility.
When the crypto price moves close to the upper band, it indicates that the asset may be overbought. Conversely, when the price approaches the lower band, it suggests the asset might be oversold. This is helpful in crypto trading because it helps traders identify potential exit and entry points, providing insights into price trends and market volatility.
On-Balance Volume
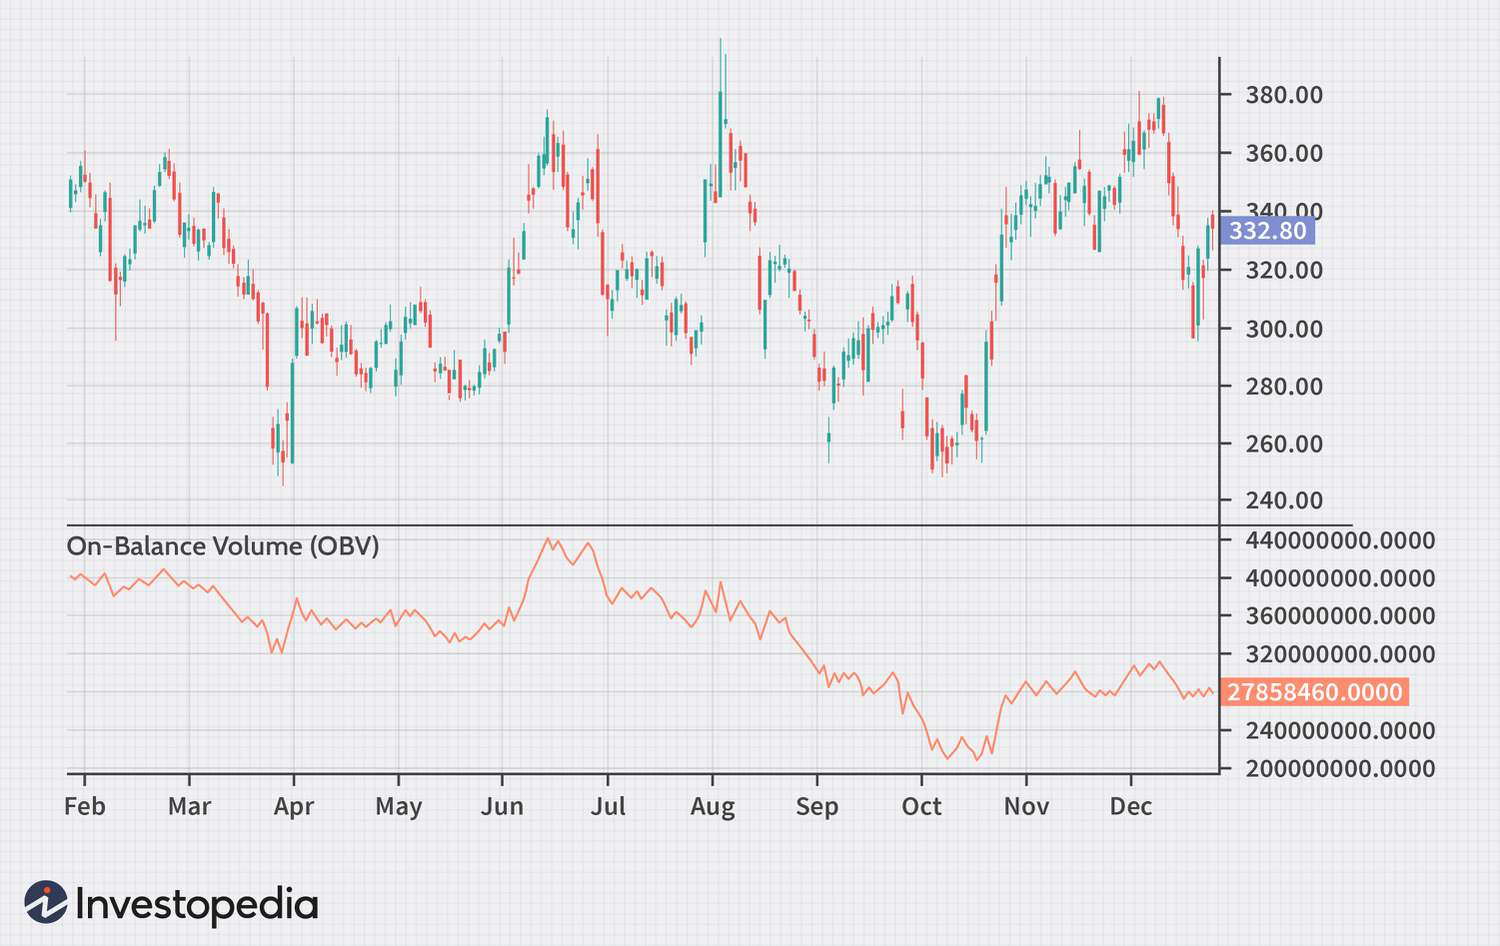
The On-Balance Volume (OBV) indicator is a technical analysis tool used to measure buying and selling pressure in an asset. The OBV indicator is based on the premise that volume precedes price movements, which means that significant changes in volume can signal future price changes.
The OBV indicator detects divergences between volume and price in crypto trading, signaling potential trend reversals. By using OBV in conjunction with other technical indicators, traders can also anticipate breakouts and validate the strength of trends, making more informed trading decisions in the crypto market.
Ichimoku Cloud
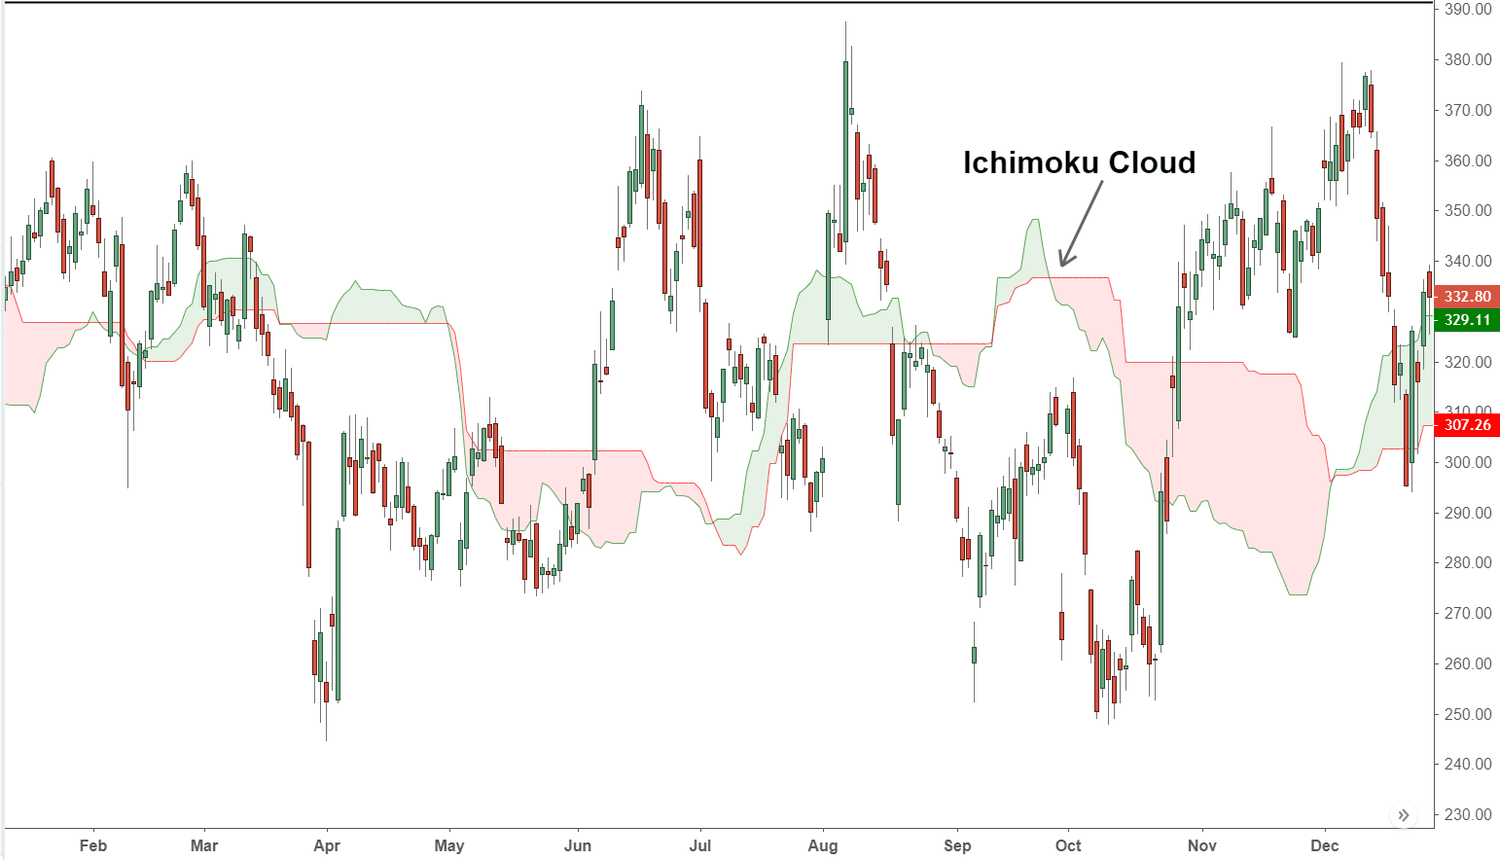
The Ichimoku Cloud is an indicator that consists of five lines: Tenkan-sen, Kijun-sen, Senkou Span A, Senkou Span B, and Chikou Span. The cloud (Kumo) is formed between Senkou Span A and B and represents support and resistance areas. The other lines provide additional information on trend direction and momentum.
This indicator is useful in crypto trading as it offers an overall view of the market. It helps traders identify trends, potential reversal points, and support/resistance levels, thus spotting optimal entry and exit points.
Fibonacci Retracement Levels
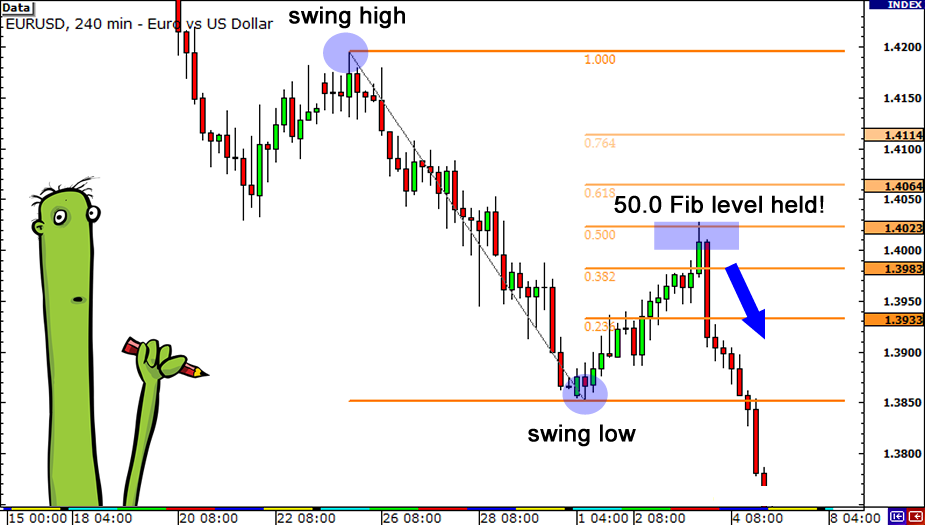
Fibonacci Retracement Levels are horizontal lines that indicate potential support and resistance levels based on the Fibonacci ratios of 23.6%, 38.2%, 50%, 61.8%, and 100%. These levels are drawn from significant high and low points on the price chart.
The Fibonacci Levels suggest where price corrections might find support or resistance. In crypto trading, Fibonacci Retracement Levels help predict potential reversal points, set stop-loss orders, and determine price targets during market corrections, which in turn helps make informed trading decisions.
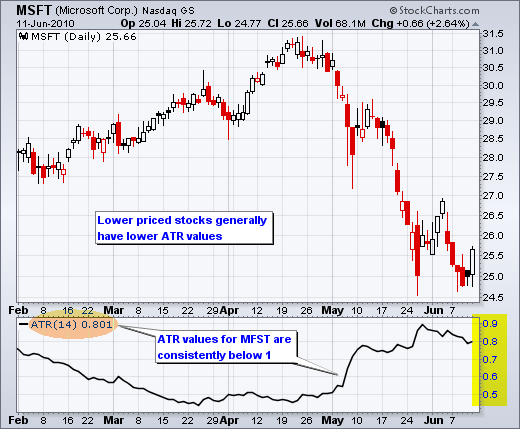
Average True Range (ATR)
The Average True Range (ATR) is a volatility indicator that measures the average range of price movement over a specified period. Higher ATR values indicate greater market volatility, while lower values suggest less volatility.
In crypto trading, ATR is useful because it helps traders set stop-loss levels and manage risk by understanding the market's volatility. This is crucial in the highly volatile crypto market, where price swings can be significant and unpredictable.
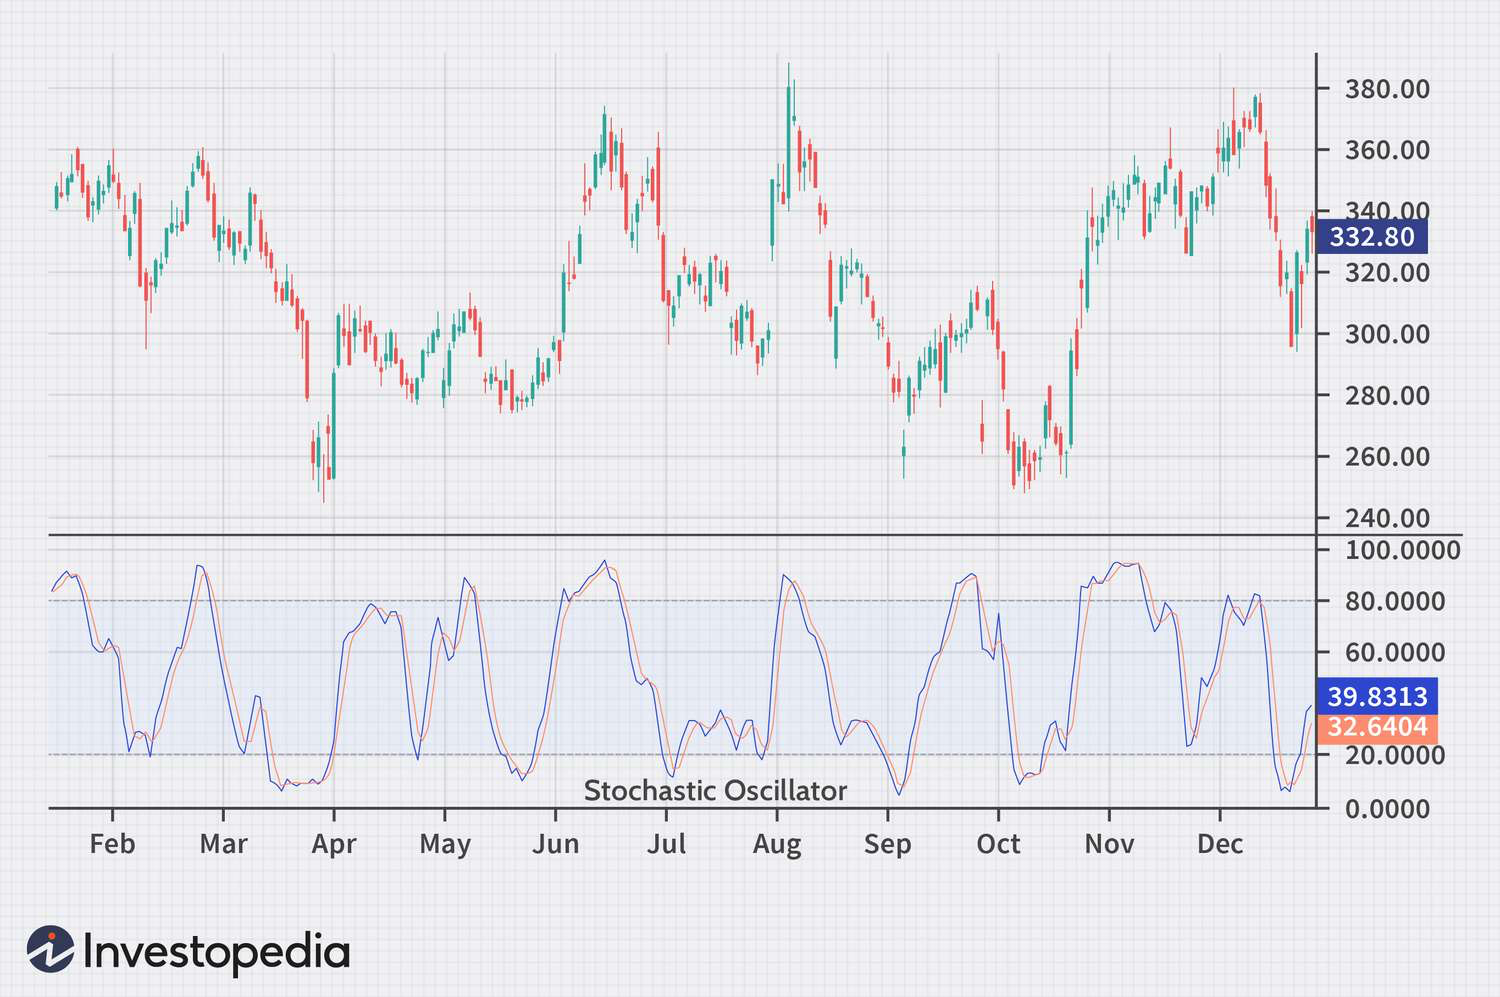
Stochastic Oscillator
The Stochastic Oscillator is a momentum indicator that compares a particular closing price to a range of prices over a specified period. The oscillator generates values between 0 and 100, indicating overbought conditions when the value is above 80 and oversold conditions when it is below 20.
The Stochastic Oscillator helps traders identify potential reversal points and overbought or oversold conditions in the crypto market, providing insights into possible entry and exit points for trades.
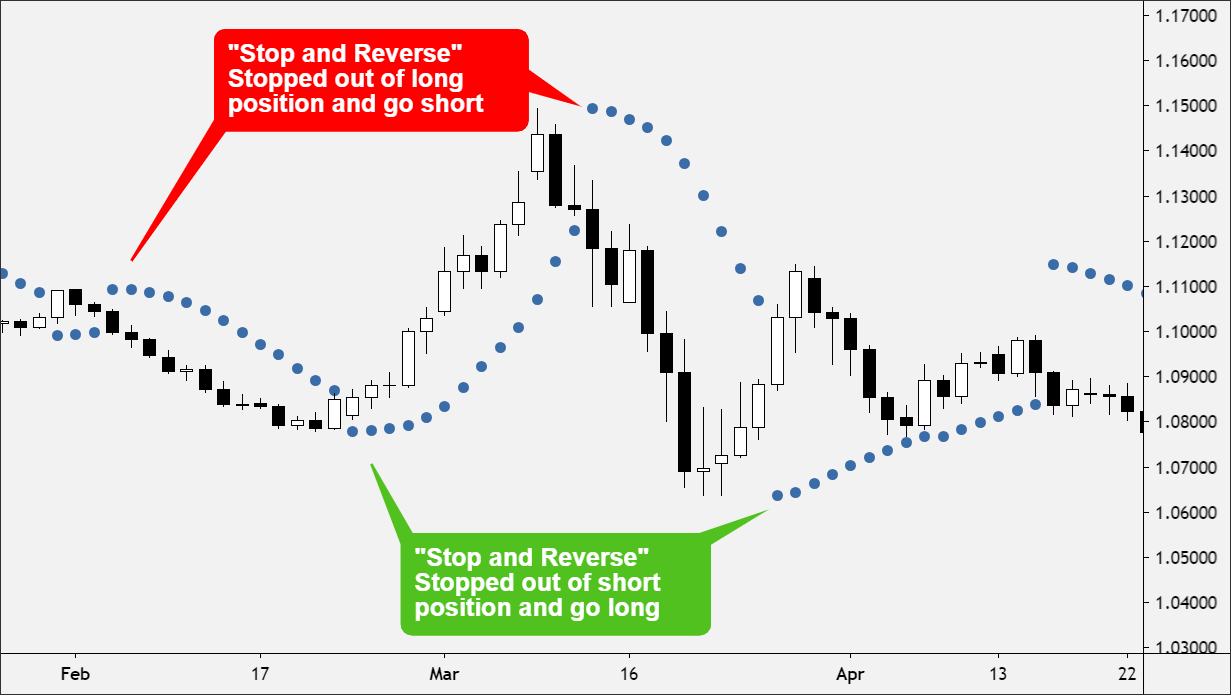
Parabolic SAR (Stop and Reverse)
The Parabolic SAR (Stop and Reverse) is a trend-following indicator that provides potential entry and exit points by placing dots above or below price bars. When the dots are below the price, they indicate an uptrend, and when they are above, they signal a downtrend.
This indicator is helpful in crypto trading as it helps traders set trailing stop-loss orders and identify the direction of the market trend, ensuring that they can maximize gains and minimize losses.
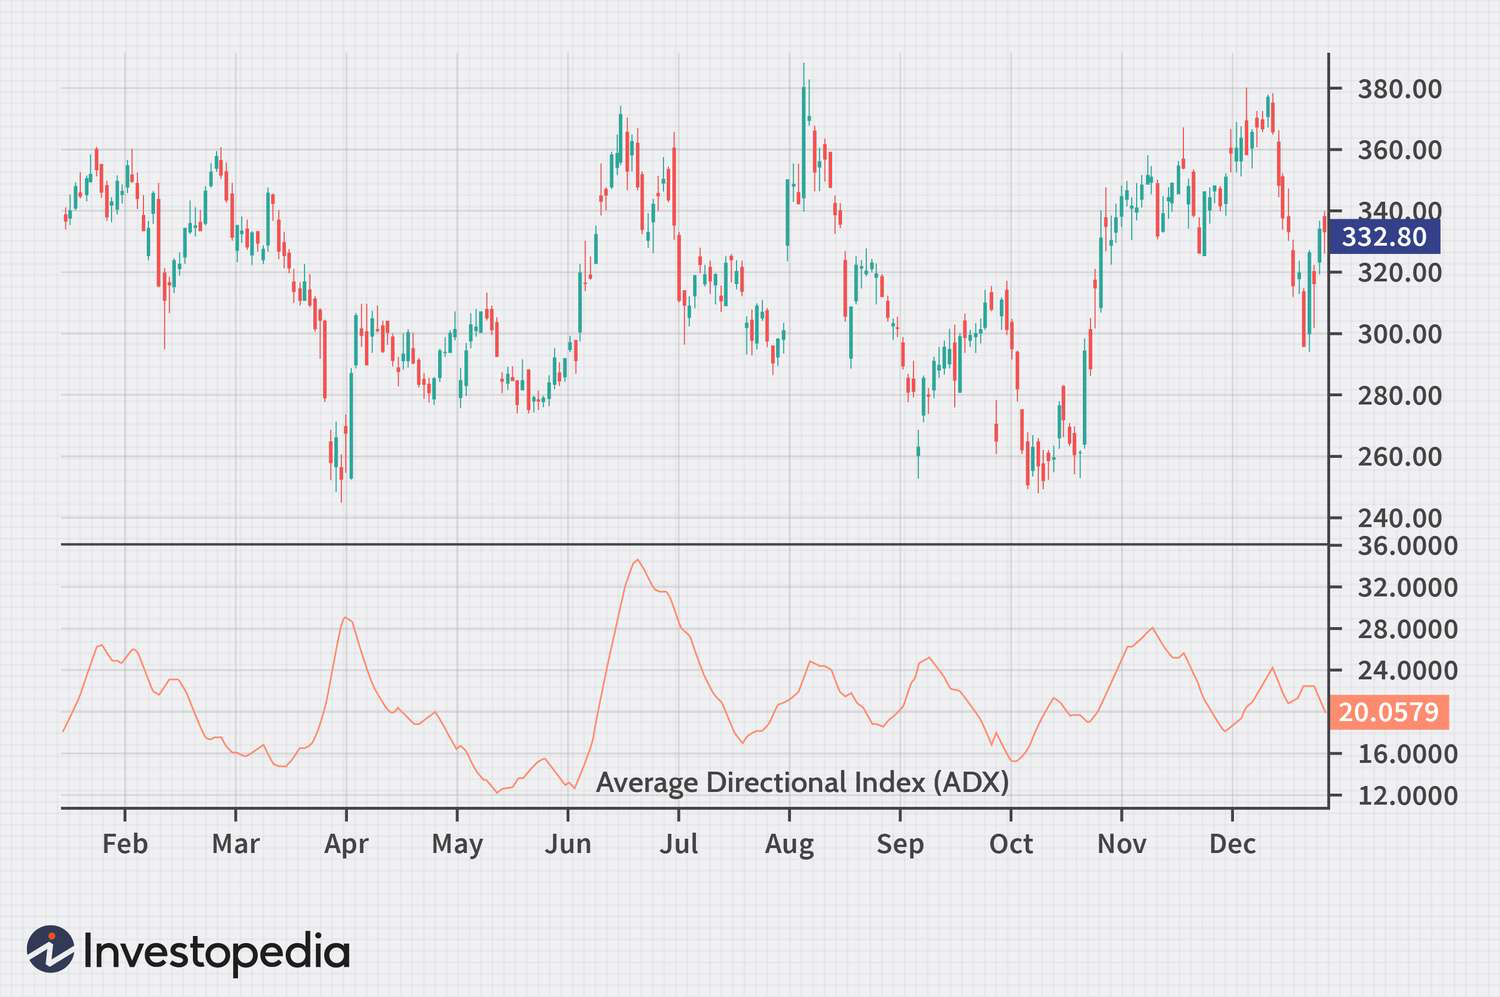
Average Directional Index (ADX)
The Average Directional Index (ADX) measures the strength of a trend without indicating its direction. Values above 20 suggest a strong trend, while values below 20 indicate a weak or non-existent trend.
ADX is useful in crypto for identifying whether the market is trending or ranging. This helps traders decide on appropriate trading strategies, such as trend-following or range-bound strategies, ensuring they adapt their approach based on market conditions.
Elliott Wave Theory
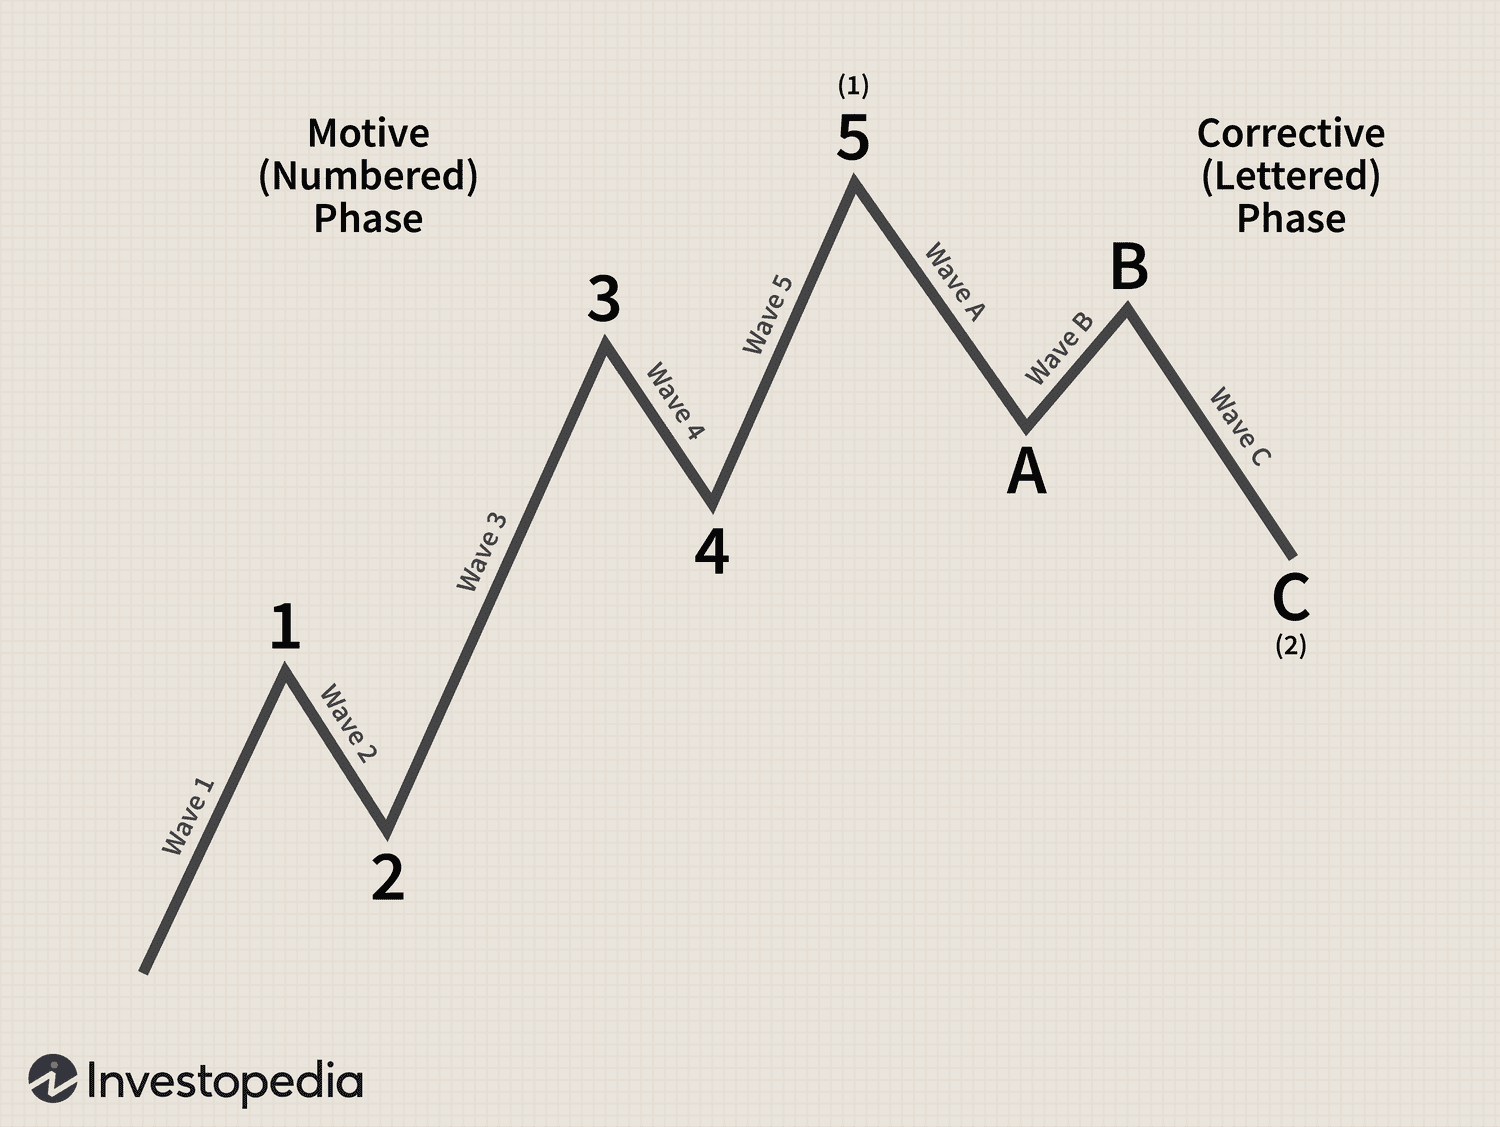
Elliott Wave Theory is a form of technical analysis that suggests market prices move in predictable wave patterns based on investor psychology. It identifies primary waves (in the direction of the trend) and corrective waves (against the trend) to predict future price movements.
Elliott Wave Theory in crypto helps traders understand and predict market cycles, identifying potential reversal points and trend continuations. This theory provides a framework for anticipating future price movements based on historical patterns.
Top strategies to employ with crypto indicators
Trend trading
Trend trading involves identifying and following the direction of the market trend. Traders use indicators like Moving Averages, ADX (Average Directional Index), and the Ichimoku Cloud to determine the prevailing trend.
Trend trading helps crypto traders capitalize on sustained price movements. For instance, if the market is in an uptrend, traders might look for long opportunities, while in a downtrend, they might look for short opportunities. This strategy aligns trades with the overall market direction, increasing the likelihood of informed trading decisions.
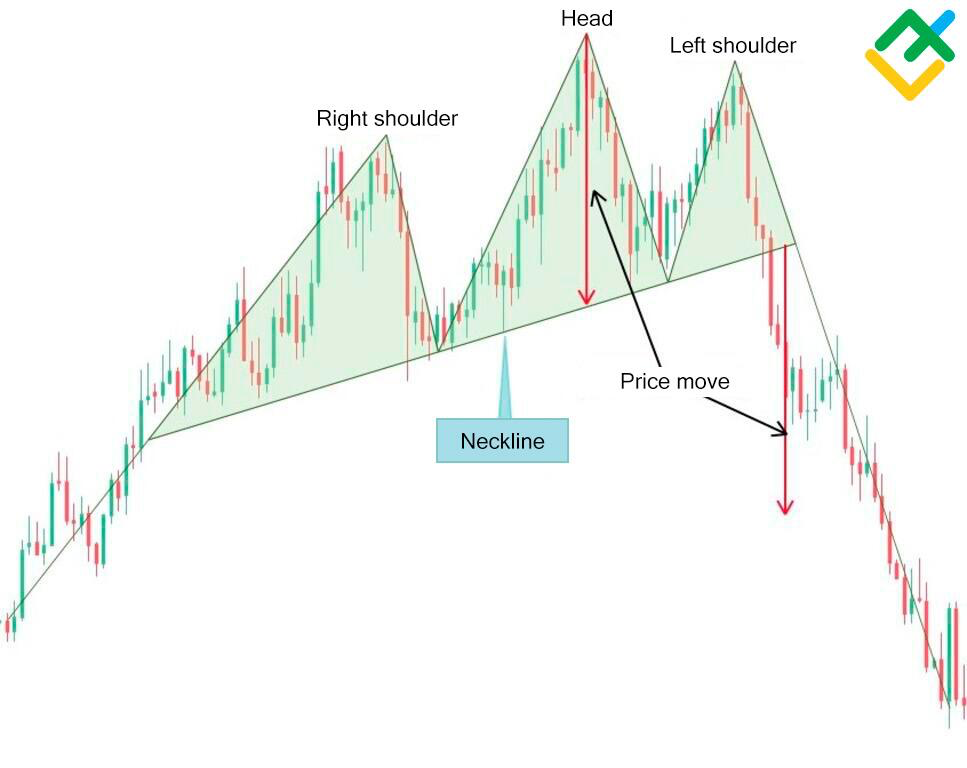
Pattern recognition
Pattern recognition involves identifying specific price patterns on charts that indicate potential future price movements. Common patterns include head and shoulders, triangles, and double tops/bottoms. Indicators such as Fibonacci Retracement Levels and Bollinger Bands can assist in identifying and confirming these patterns.
In crypto trading, recognizing patterns helps traders predict possible breakout points and reversal areas. This strategy uses historical price behavior to anticipate future movements, providing a framework for entering and exiting trades.
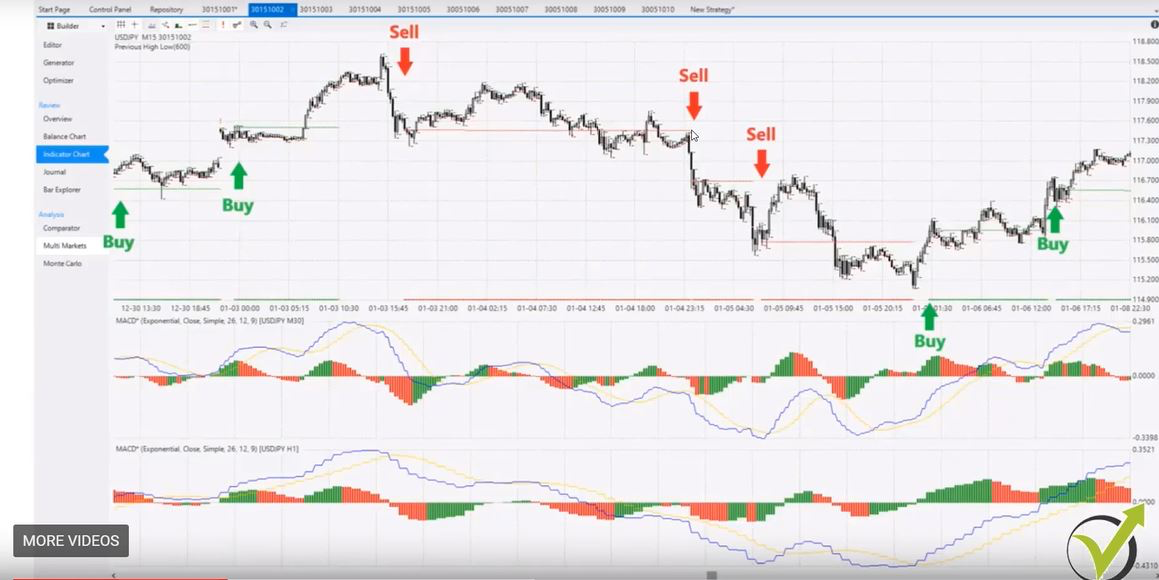
Multi-timeframe analysis
Multi-timeframe analysis involves analyzing the same cryptocurrency across different timeframes to gain a comprehensive view of the market. Traders might use shorter timeframes (like 1-hour charts) for detailed analysis and longer timeframes (like daily or weekly charts) to understand the broader trend.
This trading strategy helps crypto traders confirm trends and key levels, ensuring their trades align with short-term and long-term market conditions. It reduces the risk of making decisions based on limited information.
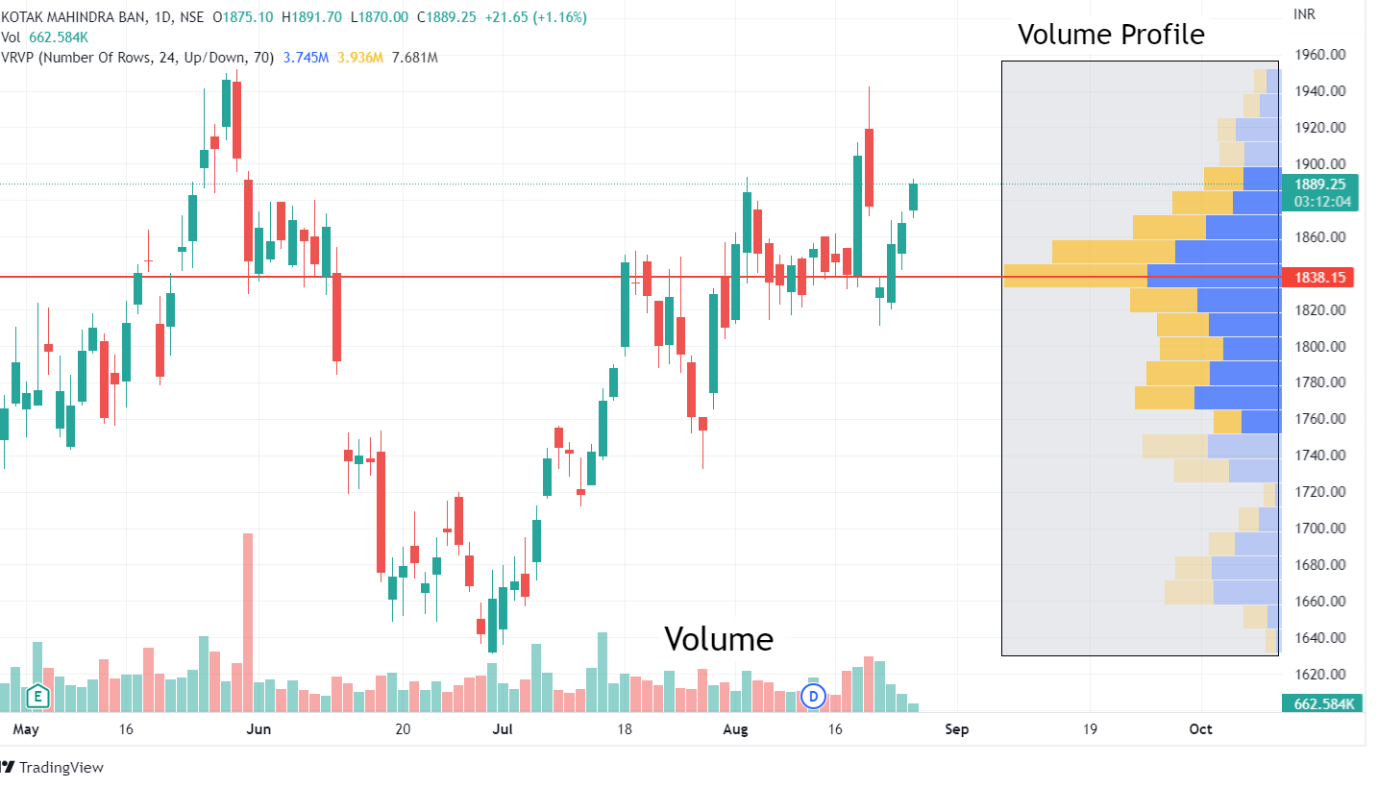
Volume profile analysis
Volume profile analysis examines the distribution of trading volume at different price levels over a specified period. This analysis helps identify areas of high and low trading activity, known as high volume nodes and low volume nodes, respectively. Indicators like On-Balance Volume (OBV) and traditional volume bars assist in this analysis.
Volume profile analysis helps crypto traders understand where significant long and short pressure exists, providing insights into potential support and resistance levels. This information is crucial for making entry and exit decisions, as it reveals the price levels where market participants are most active.
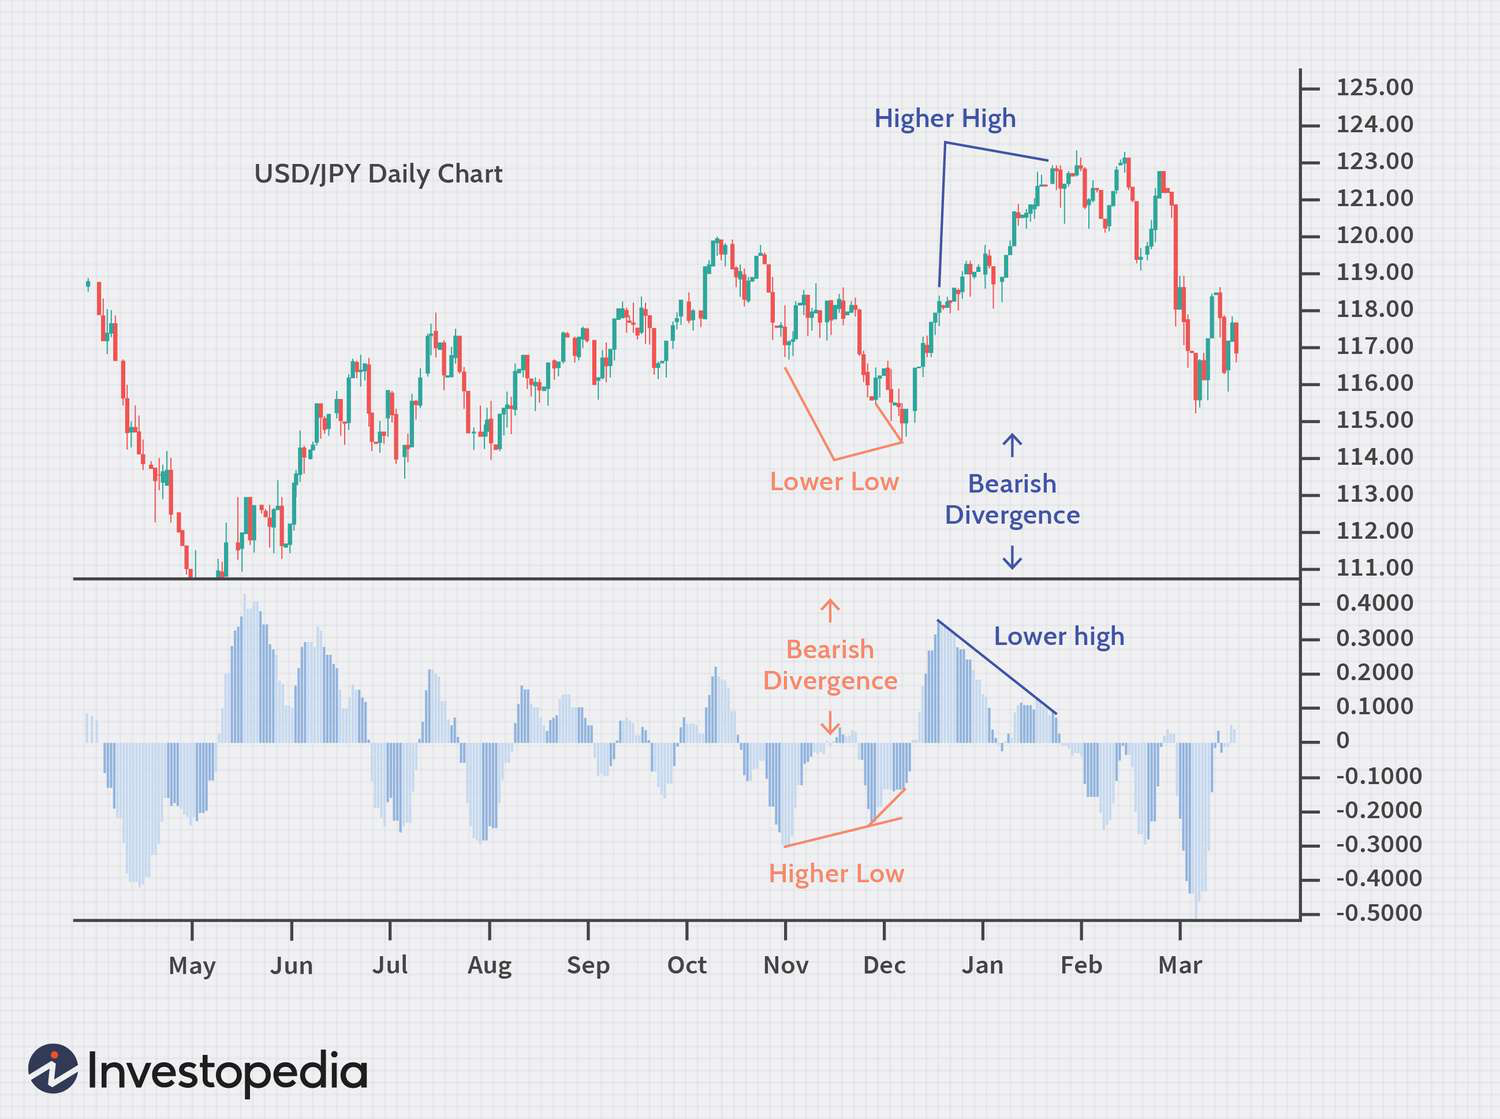
Divergence trading
Divergence trading involves identifying discrepancies between the price movement of a cryptocurrency and an indicator. Common indicators used for this strategy include the RSI (Relative Strength Index), MACD (Moving Average Convergence Divergence), and Stochastic Oscillator. When the price makes a new high or low, but the indicator does not, it signals a potential reversal and vice versa.
In crypto trading, divergence trading helps traders spot early signs of trend reversals, providing opportunities to enter trades before the market reacts. This strategy anticipates changes in market direction, allowing traders to position themselves accordingly.
Algorithmic trading
Algorithmic trading uses computer programs and algorithms to execute trades based on predefined criteria. These criteria can include various indicators such as Moving Averages, Bollinger Bands, and more.
In crypto trading, algorithmic strategies can execute trades at high speeds and with precision, taking advantage of small price discrepancies and market inefficiencies. This strategy is effective in the highly volatile crypto market, where quick execution and the ability to handle large volumes of data are significant. Algorithmic trading reduces human error, improves execution efficiency, and allows for the implementation of complex trading strategies that would be difficult to manage manually.
Stepwise guide to trade crypto with a technical indicator
1- Select a technical indicator
First, choose a technical indicator that suits one’s trading style and strategy. For example, if traders prefer trend trading, they might select the Moving Average or the Ichimoku Cloud. If traders are interested in volatility, Bollinger Bands could be a good choice.
2- Understand indicator signals
Learn how the chosen indicator works and what its signals mean. For instance, with Bollinger Bands, a price touching the upper band might indicate overbought conditions, while touching the lower band might suggest oversold conditions. Ensure one knows how to interpret the signals accurately to make informed trading decisions.
3- Choose a cryptocurrency pair
Select a cryptocurrency pair to trade, such as BTC/USD or ETH/BTC. Consider the liquidity and volatility of the pair, as these factors can impact trading results. More liquid pairs like BTC/USD have tighter spreads and better price stability.
4- Select a timeframe
Choose a timeframe that matches one’s trading style. Day traders might use shorter timeframes like 5-minute or 15-minute charts, while swing traders might prefer 4-hour or daily charts. The chosen timeframe will influence the frequency and duration of the trades.
5- Analyze historical price data
Use historical price data to understand how the chosen indicator has performed in the past with the selected cryptocurrency pair and timeframe. This analysis helps identify patterns, trends, and the reliability of indicator signals. Look for consistency in the indicator's signals, leading to accurate trades.
6- Define entry and exit criteria
Clearly define entry and exit criteria based on the indicator signals. For example, a trader might decide to enter a long position when the price crosses above the middle Bollinger Band and exit when it touches the upper band. Set rules to avoid emotional decision-making during trading.
7- Backtest strategy
Backtest the crypto trading strategy using historical data to evaluate its accuracy. This involves applying the defined entry and exit criteria to past price movements to see how the strategy would have performed. Analyze the results to refine the strategy and improve its accuracy rate.
8- Monitor real-time market data
Once the strategy is set, traders should start monitoring real-time market data. Use a reliable trading platform that provides live price feeds and the chosen indicator's signals. Stay alert to market changes and be ready to act on the predefined criteria.
9- Execute trade
When the entry criteria are met, execute the trade. Ensure one uses proper order types (market, limit, stop-loss) to manage the trade properly. For example, if entering a long position, set a stop-loss order to limit potential losses if the trade goes against the trader.
10- Manage trade
After executing the trade, continuously monitor it to ensure it progresses as expected. Adjust stop-loss and take-profit levels as needed based on market conditions and the indicator's ongoing signals. Be prepared to exit the trade according to the predefined exit criteria or if market conditions change significantly.
Navigate the crypto market with data-driven decisions
Using technical indicators in crypto trading enables better trend identification and risk management. They also help crypto traders spot market trends. However, relying solely on technical indicators without considering the fundamental aspects of crypto trading can lead to misguided trades. Hence, traders must combine technical analysis with other strategies and maintain a balanced approach to mitigate these risks.
FAQs
We’re here to help you every step of your trading journey. Here are some answers to the more frequent questions we get asked.
What are effective technical indicators for analyzing crypto markets?
Indicators such as Bollinger Bands, On-Balance Volume (OBV), and the Ichimoku Cloud are commonly used to assess market trends and identify potential price movements in cryptocurrency trading.
How can Bollinger Bands assist in analyzing cryptocurrency volatility?
Bollinger Bands help highlight potential overbought or oversold market conditions. When prices approach the upper band, it could signal elevated price levels, while approaching the lower band might indicate lower price levels relative to recent trends.
What is the purpose of Fibonacci Retracement Levels in crypto analysis?
Fibonacci Retracement Levels help traders observe areas of potential support and resistance during market corrections, assisting in planning strategies for managing trades and identifying possible reversal zones.
Why is the Average True Range (ATR) a valuable tool for crypto traders?
ATR measures price volatility, providing insights into setting stop-loss levels and managing risk, which is particularly useful in fluctuating cryptocurrency markets.
What is the advantage of using multiple technical indicators in trading?
Combining different indicators, such as the Stochastic Oscillator with OBV or the ADX, allows traders to validate insights, better interpret market signals, and refine their strategies for varying conditions.
Disclaimer: All material published on our website is intended for informational purposes only and should not be considered personal advice or recommendation. As margin FX/CFDs are highly leveraged products, your gains and losses are magnified, and you could lose substantially more than your initial deposit. Investing in margin FX/CFDs does not give you any entitlements or rights to the underlying assets (e.g. the right to receive dividend payments). CFDs carry a high risk of investment loss.