


A rounding bottom pattern is a U-shaped chart pattern suggesting a trend reversal. It helps traders identify a consolidation phase after a downtrend. This consolidation might signal a pause in the downtrend before a positive market reversal.
In this article, we will discuss the rounding bottom chart pattern in detail.
What is a rounding bottom pattern?
A rounding bottom pattern is a technical analysis indicator that suggests a potential upward trend reversal following a downtrend. It gets its name from the U-shaped curve it forms on the price chart. The rounding bottom chart pattern suggests that exit pressure is weakening and entry pressure is increasing.
How a rounding bottom chart pattern works
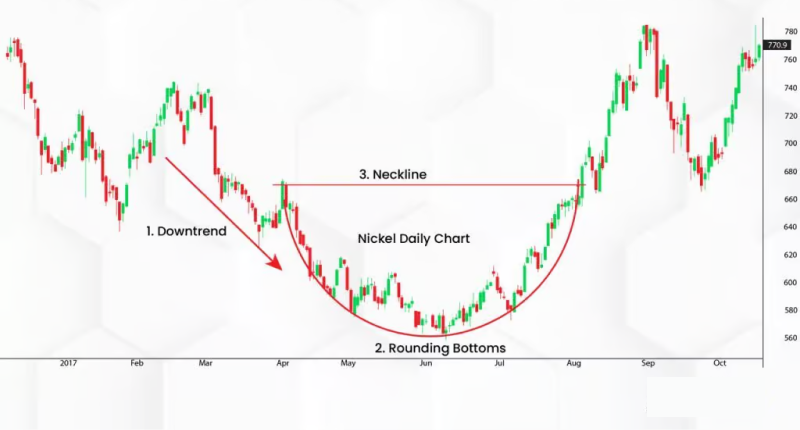
A rounding bottom chart pattern in forex works by potentially signaling a shift in market sentiment from bearish (downtrend) to bullish (upward trend). It works in three phases:
Phase 1: Downtrend and price exhaustion
- The forex pair first experiences a sustained downtrend. This is characterized by a series of lower highs (peaks that are progressively lower) and lower lows (dips that are progressively lower)
- As the downturn continues, exit pressure weakens. Bears who were initially eager to offload their holdings may have already done so, leading to a decrease in exit activity
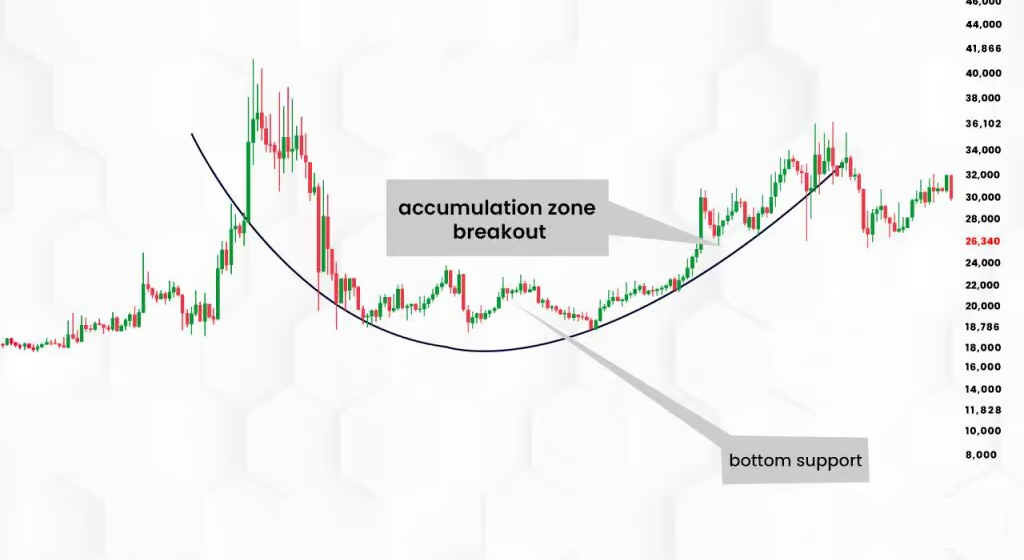
Phase 2: Bottoming out and support formation
- The price starts to bounce off a specific (support level) price several times. This repeated bouncing action creates the rounded bottom pattern
- Each time the price touches the support level, it encounters long pressure. This long pressure could come from various sources, such as bargain hunters who see the lower price as an attractive entry point or technical traders who recognize the rounding bottom pattern forming and anticipate a potential reversal pattern.
Phase 3: Breakout and trend reversal
- If enough long pressure accumulates, the price eventually breaks above the neckline of the rounding bottom pattern. The neckline is a horizontal line drawn connecting the two highest points of the downtrend before the bottom formation
- This breakout signifies a potential upward trend reversal. The downtrend might be losing steam, and bulls are taking control, pushing the price trends upward
Example of rounding bottom chart patterns
Imagine analyzing AUD/USD, and the trader spots a potential rounding bottom pattern. The AUD/USD price chart displays a clear downtrend with several lower highs and lows over the past few months.
A potential rounding bottom pattern emerges as the price repeatedly tests a support level around 0.6800, creating a U-shaped curve. With each test, the price bounces back, suggesting long pressure.
Finally, the price breaks above a horizontal line drawn connecting the downtrend's two highest points (around 0.7000), which is the neckline of the rounding bottom. This breakout suggests a potential upward trend reversal, with bulls taking control as the downtrend loses momentum.
To confirm this signal, traders should check for an increase in trading volume on the breakout day, indicating more participation in the price rise.
**This is an example only to enhance a consumer's understanding of the above note and is not to be taken as Blueberry providing personal advice.
Advantages and risks of a rounding bottom pattern
Advantages
Provides reversal signals
The rounding bottom pattern, when well-formed, can be a strong indicator of a potential shift from a downtrend to an upward trend. This allows traders to identify potential entry opportunities at the end of a downtrend.
Confirms pattern validity through volume analysis
A significant increase in trading volume on the breakout above the neckline can strengthen the validity of the rounding bottom pattern. Higher volume suggests more participation from bulls, supporting the price increase and making the reversal signal more reliable.
Gives measured moves based on pattern height
Some traders look at the height of the rounding bottom for technical analysis to estimate the potential upward price trend after the breakout. The idea is that the price might rise by a similar distance as the height of the pattern from the neckline. This provides a price target projection, although it's not a confirmed outcome.
Risks
May signal false reversals
When using rounding bottoms, it's necessary to remember this technical analysis indicator is not foolproof. Sometimes, the price might break above the neckline but then fall back down, leading to a false positive market reversal. This can cause traders to enter long positions prematurely, resulting in potential losses.
Depends heavily on the broader market context
Depending on the broader market context, the rounding bottom pattern can be more or less reliable. For example, a rounding bottom during a strong downtrend might be less reliable than one that appears during a consolidation period.
Leads to overbought conditions post-pattern completion
Even if a confirmed trend reversal occurs, the price movement after a rounding bottom breakout might be followed by overbought conditions. This can lead to a temporary stall or a pullback before the upward trend continues. Traders who enter at the breakout might miss out on better entry points if they wait for a potential pullback after the initial surge.
How to trade with a rounding bottom pattern?
Identify the pattern
Look for a sustained downtrend, followed by a rounded bottom formation. The forex price will test a specific support level (horizontal price point) several times, creating the U-shaped curve.
Confirm the pattern
A rounding bottom alone is not a confirmed reversal chart pattern. Look for confirmation factors such as volume and other technical indicators for a confirmed signal.
Draw the neckline
Draw a horizontal line connecting the two highest points of the downtrend before the bottom formation. This line is the neckline and acts as a breakout level for the pattern.
Analyze volume
Pay close attention to volume during the breakout. A significant increase in volume on the breakout above the neckline strengthens the bullish signal. Look for a surge in long activity to support the price increase.
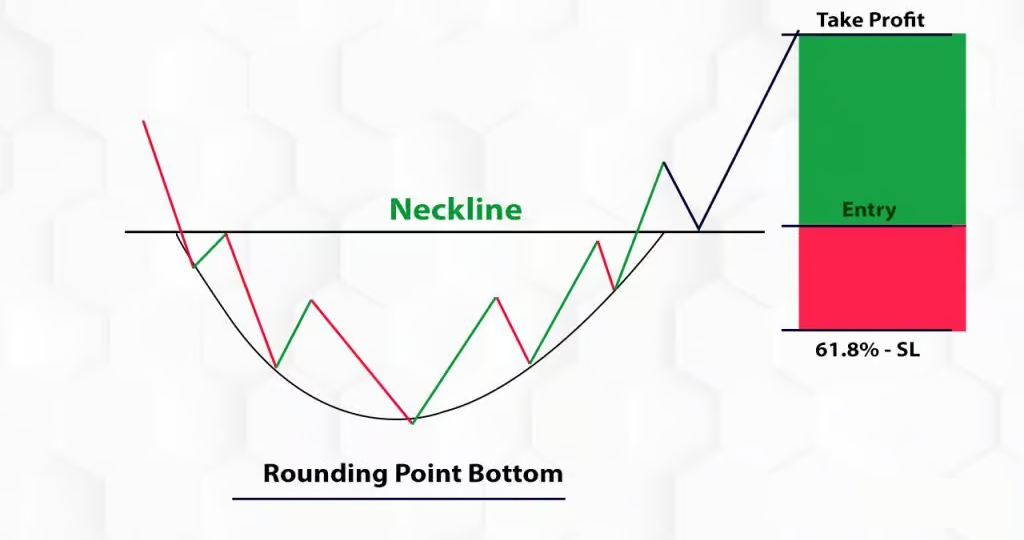
Plan entry strategy
There are different approaches to entry points. when it comes to rounding bottoms. Some traders enter immediately after the breakout above the neckline. Others might wait for a confirmation candle that closes above the neckline. Consider using a limit order to specify the desired entry price or a stop-loss order to automatically enter a trade if the price reaches a specific level.
Set stop-loss orders
Next, place a stop-loss order below the neckline to limit potential losses if the reversal fails. The stop-loss distance depends on one's risk tolerance and the volatility of the forex pair.
Confirm rounding bottom patterns with additional indicators
Using the rounded bottom pattern as part of the trading strategy offers traders a clue for a potential upward trend reversal after a downtrend. It highlights a shift in market sentiment. However, confirmation through trading volume and other indicators is essential to avoid false signals and make informed trading decisions.
Disclaimer: All material published on our website is intended for informational purposes only and should not be considered personal advice or recommendation. As margin FX/CFDs are highly leveraged products, your gains and losses are magnified, and you could lose substantially more than your initial deposit. Investing in margin FX/CFDs does not give you any entitlements or rights to the underlying assets (e.g. the right to receive dividend payments). CFDs carry a high risk of investment loss.