


Point-and-figure (P&F) charts in forex offer clear and objective insights into significant price movements irrespective of the timeframe, helping traders identify an overall trend and recognize patterns.
Let’s dive deep into P&F charts and how they can be used in forex trading with different strategies and patterns.
What is the P&F chart?
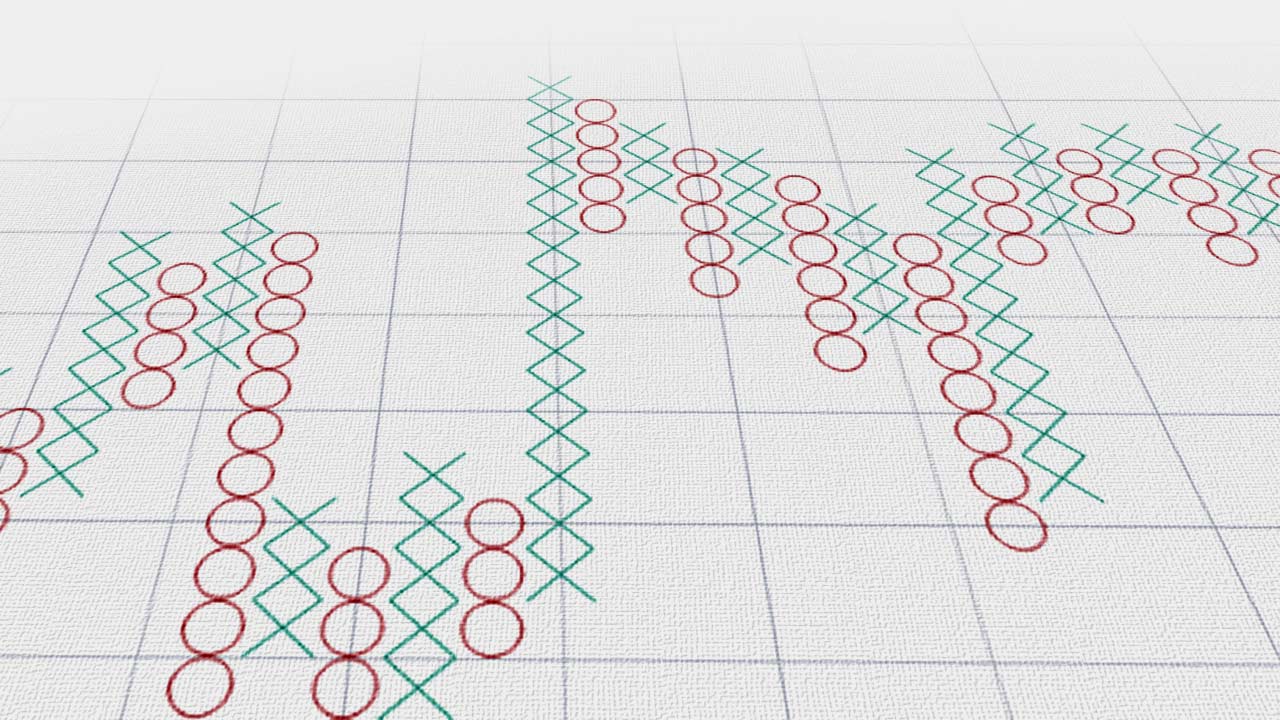
The Point-and-Figure (P&F) chart is a technical analysis tool traders use to analyze and visualize price movements in financial markets. It differs from traditional candlesticks or bar charts in that it focuses solely on price movements and ignores the element of time. It consists of Xs and Os, representing upward and downward price movements. On a P%F chart, only significant price moves are considered as minor fluctuations do not hold any relevance to the overall trend.
Key components of a P&F chart include the Box size and reversal amount:
- Box size: This parameter determines the minimum price movement required to create a new box on the chart. For example, if the box size is 0.005 for a currency pair trading at 1.4000, a new box will only be formed when the price moves by 0.005 or more.
- Reversal amount: This parameter dictates how many boxes must be formed in the opposite direction before indicating a reversal. For instance, if the reversal amount is set at 3, the price must move in the opposite direction by at least 3 boxes to trigger a reversal.
How do P&F charts work?
Each box on the P&F chart represents a specific price movement determined by the box size parameter. The chart's direction changes only when the price moves by a predetermined reversal amount in the opposite direction, signaling a potential trend reversal. Let us understand how a P&F chart would work with an example:
In this example, each box represents a price movement of $0.01 in the forex rate. Here's how the chart will progress:
1- If the forex rate rises to $1.2051, an X is plotted on the chart.
2- If the rate rises to $1.2052, another X is added.
3- If the rate pulls back to $1.2051, no new box is plotted since the movement is less than the box size.
4- If the rate drops to $1.2049, an O is plotted to indicate a downward movement.
5- Another O is added if the rate falls to $1.2048.
6- No new box is plotted if the rate rebounds to $1.2050 since the movement is less than the box size.
The P&F chart continues to update based on these price movements, with X representing price increase and O representing price decrease, each corresponding to the specified box size. Traders use these charts to identify trends and potential reversal points in the forex market.
What do P&F charts indicate?
Resistance
In P&F charts, resistance levels are identified as price levels where exit pressure historically prevents the price from rising further. These levels are represented by horizontal lines formed by a series of O columns. Traders use resistance levels to gauge potential barriers to upward price movements and adjust their trading strategies accordingly.
Support
Support levels in P&F charts indicate price levels where entry pressure historically prevents the price from falling further. These levels are depicted by horizontal lines formed by a series of X columns. Traders utilize support levels to identify potential long opportunities and establish stop-loss levels to manage risk.
Trendlines
Trendlines on P&F charts are diagonal lines that connect successive highs or lows, indicating the direction of the prevailing trend. An ascending trendline connects higher lows and suggests an uptrend, while a descending trendline connects lower highs and indicates a downtrend. Traders use trendlines to confirm the direction of the trend and identify potential trend reversals.
Breakout
Breakouts occur when the price surpasses a significant resistance or support level on the P&F chart. A breakout above resistance indicates increasing long pressure and may signal a bullish trend continuation, while a breakout below support suggests increasing short pressure and may indicate a bearish trend continuation. Traders look for breakouts as potential entry signals to capitalize on emerging trends.
Advantages and risks of using the P&F chart
Advantages
- Clear visualization of trends: P&F charts focus solely on price movements, filtering out time and minor fluctuations. This simplicity provides a clearer depiction of trends, making it easier for traders to identify support, resistance, and trendlines.
- Objective analysis: P&F charts rely on fixed price movements (box size and reversal amount), which removes subjective interpretations and emotional biases. Traders can analyze price action objectively, leading to more consistent decision-making.
- Filters market noise: By ignoring insignificant price movements, P&F charts filter out market noise, enabling traders to focus on significant price changes. This reduces the likelihood of false signals and enhances the clarity of chart patterns.
Risks
- Delayed signals: Due to the fixed box size and reversal amount, P&F charts may generate signals later than other chart types. Traders relying solely on P&F charts may miss early entry or exit points, resulting in potential missed opportunities or delayed reactions to market changes.
- Limited market depth: P&F charts do not incorporate volume data, limiting their ability to assess market depth or liquidity. Traders may overlook important information about trading activity and market sentiment, potentially leading to less accurate analysis.
- Subject to whipsaws: P&F charts may produce false signals, especially during periods of low volatility or choppy market conditions. Traders may experience whipsaws, where a signal triggers a trade, but the price quickly reverses, resulting in losses or missed opportunities.
Top strategies to use with the P&F chart
Moving average crossovers
Traders use moving average crossovers to identify potential changes in market direction. On P&F charts, traders can plot short-term and long-term moving averages and look for crossovers. When the short-term moving average (such as 10-period) crosses above the long-term moving average (such as 50-period) on the P&F chart, it may indicate a bullish trend reversal, signaling traders to place long orders. Conversely, a crossover where the short-term moving average crosses below the long-term moving average could indicate a bearish trend reversal. Traders can use these crossovers as entry or exit signals, confirming the strength of a trend.
Volume analysis
Volume analysis helps traders gauge the strength of price movements. On P&F charts, traders can observe volume spikes accompanying significant price changes. For example, a breakout from a consolidation pattern accompanied by high volume suggests strong market conviction. Traders can interpret this as a confirmation of the breakout and may consider entering positions in the direction of the breakout. Conversely, a breakout with low volume on the P&F chart may lack conviction and could be a false signal.
Price consolidation breakouts
Traders use price consolidation breakouts to identify potential trend continuations. On P&F charts, consolidation patterns are characterized by a series of narrow columns. Breakouts from these patterns indicate the resumption of the previous trend. Traders can enter positions when the price breaks out of the consolidation pattern, expecting the trend to continue in the breakout direction. By interpreting volume alongside price movements on P&F charts, traders gain insights into market momentum.
Relative strength analysis
Relative strength analysis compares the performance of different assets or sectors relative to a benchmark index. On P&F charts, traders can compare the relative strength of assets by analyzing their price movements. For example, if a currency exhibits a strong uptrend on a P&F chart compared to the broader market index, it may indicate relative outperformance and signal traders to place long orders and vice versa. Traders can use this information to identify strong performers and potential investment opportunities, aligning their trades with assets showing strong relative strength.
Trend following
Trend following strategies involve trading in the direction of established trends. On P&F charts, traders can identify prevailing trends by analyzing the pattern of X and O columns. For example, a series of ascending X columns indicates an uptrend, while a series of descending O columns indicates a downtrend.
Traders can enter positions in the direction of the trend, expecting the trend to continue until signs of exhaustion or reversal appear on the chart. This strategy helps traders ride the momentum of the market and capture gains from sustained price movements.
Horizontal counts
Horizontal counts help traders estimate potential price targets after a breakout occurs. On P&F charts, traders can identify consolidation patterns and apply horizontal counts to determine the distance the price may move following a breakout. For example, if a currency breaks out of a consolidation pattern with a horizontal count of three boxes, traders may set a gain target three times the box size above the breakout point. This strategy helps traders set realistic gain targets and manage risk effectively by anticipating potential price movements.
Time frame analysis
Time frame analysis involves analyzing P&F charts across different time frames to gain insights into market trends. Traders can use short-term P&F charts for intraday trading and longer-term charts for swing or position trading. By examining P&F charts across multiple time frames, traders can identify key levels, trends, and trading opportunities.
Top patterns to use with the P&F chart
Double tops and bottoms
Double tops/bottoms occur when the price peaks/trough twice without breaking through, signaling a potential trend reversal from bullish/bearish to bearish/bullish. On P&F charts, double tops appear as two consecutive columns of X (for tops) or O (for bottoms) at the same price level, followed by a column in the opposite direction. Traders use double tops and bottoms on P&F charts to anticipate trend reversals and adjust their trading strategies accordingly, allowing them to exit positions or initiate new trades in the opposite direction.
Cup and handle
The cup and handle pattern resembles a cup followed by a smaller consolidation, known as the handle, indicating a bullish continuation pattern. On P&F charts, traders look for a series of ascending X columns forming the cup, followed by a brief consolidation (the handle) before further upward movement. This pattern provides a clear entry signal, after the breakout from the handle, allowing traders to capitalize on the continuation of the uptrend.
Identifying price levels with P&F charts
Using Point-and-Figure charts in forex helps traders clearly visualize price movements along with support and resistance levels to enter or exit the market at the right price levels. However, there's a risk of oversimplification, potentially leading to false signals or overlooking critical market factors. Hence, traders should supplement P&F analysis with additional indicators for better market assessment.
FAQs
We’re here to help you every step of your trading journey. Here are some answers to the more frequent questions we get asked.
What is a Point-and-Figure (P&F) chart in forex trading?
A Point-and-Figure (P&F) chart is a technical analysis tool that represents significant price movements while filtering out minor fluctuations and time-based intervals. It uses Xs to indicate upward price movements and Os for downward movements, helping traders observe price trends and patterns.
How does a Point-and-Figure chart differ from a candlestick chart?
Unlike candlestick charts, which display price action over specific time frames, P&F charts focus only on price changes. They remove time-based elements and minor price fluctuations, offering an alternative view of market trends and potential support or resistance levels.
What are the key components of a P&F chart?
The two primary elements of a P&F chart are:
- Box Size: Defines the minimum price movement required to create a new box.
- Reversal Amount: Specifies how many boxes must form in the opposite direction to indicate a potential trend shift.
How can support and resistance levels be identified on a P&F chart?
Support levels are often seen where multiple X columns align horizontally, suggesting potential price stabilization. Resistance levels appear when multiple O columns align, indicating where price increases may slow. Traders use these levels as part of their market analysis.
What are some considerations when using P&F charts in forex trading?
- Trend Identification: P&F charts highlight significant price movements without the distraction of minor fluctuations.
- Fixed Parameters: Using predefined box sizes and reversal amounts can offer structured analysis.
- Market Context: P&F charts do not incorporate time, so traders may use additional indicators for a broader perspective.
What are the potential risks of relying solely on P&F charts?
- Delayed Signals: Since P&F charts require a set number of price movements for a reversal, signals may lag behind rapid market changes.
- Lack of Volume Data: P&F charts do not include trading volume, which can be useful for confirming market trends.
- Market Volatility: In low-volatility conditions, P&F charts may produce false breakout signals.
How do traders incorporate P&F charts into their strategies?
Some traders use P&F charts in combination with:
- Trend Analysis: Observing price movements and reversals.
- Moving Averages: Identifying shifts in trend direction.
- Volume Indicators: Evaluating the strength of price movements.
What patterns are commonly observed in P&F charts?
Patterns traders monitor include:
- Double Tops and Bottoms: Possible indicators of a reversal in price direction.
- Breakouts: Occur when prices exceed prior resistance or fall below support levels.
Can P&F charts be used to analyze market breakouts?
Yes, P&F charts highlight breakouts when price surpasses a resistance level or declines past a support level. Traders often consider these movements when assessing market momentum.
Should P&F charts be used alongside other technical indicators?
Many traders integrate P&F charts with tools such as RSI (Relative Strength Index), moving averages, or volume-based indicators to gain additional insights and reduce the risk of misinterpreting price movements.
Disclaimer: All material published on our website is intended for informational purposes only and should not be considered personal advice or recommendation. As margin FX/CFDs are highly leveraged products, your gains and losses are magnified, and you could lose substantially more than your initial deposit. Investing in margin FX/CFDs does not give you any entitlements or rights to the underlying assets (e.g. the right to receive dividend payments). CFDs carry a high risk of investment loss.