

The MetaTrader volume indicator offers traders insights into market activity. By visually representing trading pressure, the indicator aids in confirming trends, identifying potential reversals, and enhancing overall trade decisions, providing a comprehensive tool for informed and strategic trading.
However, MetaTrader's Forex Volume indicator presents challenges due to the decentralized nature of the Forex market, resulting in unreliable volume data based on tick data. Relying solely on these indicators can be risky, as low liquidity and subjective interpretations may impact their accuracy. Traders should use them cautiously and in conjunction with other technical analysis tools for a more comprehensive approach.
In this article, we will learn about MetaTrader's forex volume indicator.
What is the Forex Volume indicator?
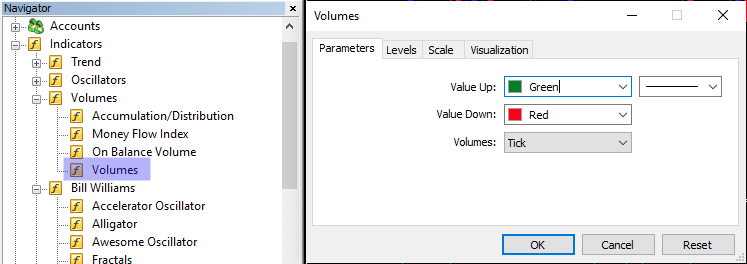
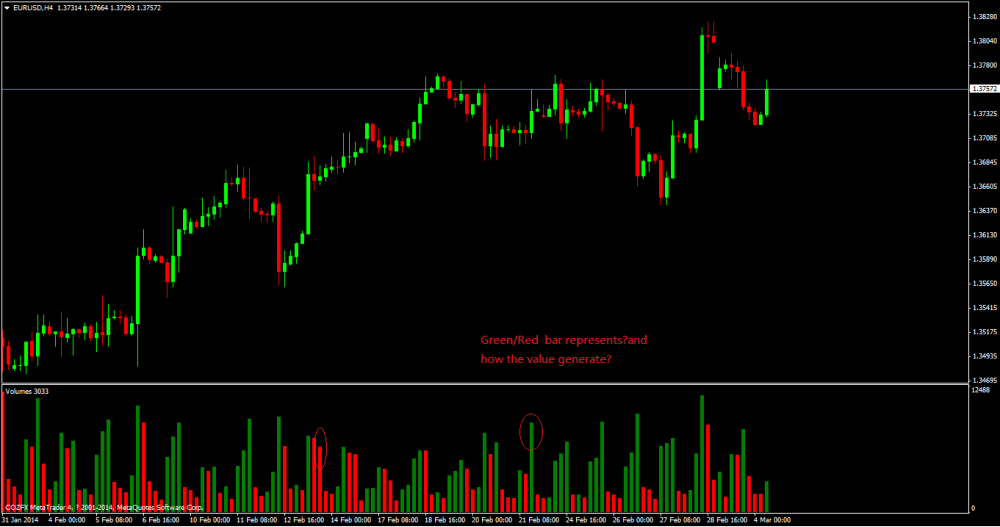
The volume indicator in MetaTrader offers insights into market activity by quantifying the number of price changes, or ticks, that occur within a specified time frame. The indicator employs two colors: A green bar signifies higher volume than the preceding candle, while a red bar indicates lower volume. Users can customize bar colors to their preferences by adjusting indicator parameters.
Types of MetaTrader volume indicators
Stochastic Oscillator
The Stochastic Oscillator in MetaTrader measures an asset's closing price relative to its price range over a specific period, identifying overbought or oversold market conditions and potential reversals. It is often used in conjunction with volume analysis. Traders frequently integrate this oscillator with volume data, seeking divergences between price movements and volume trends to refine their understanding of market dynamics and potential reversals.
Bill Williams' indicators
Bill Williams' indicators, such as the Alligator and Awesome Oscillator in MetaTrader, complement price and volume analysis. The Alligator combines moving averages to identify trends, while the Awesome Oscillator gauges market momentum. Although these indicators primarily focus on price action, traders often use volume analysis to validate the market signals. Increased volume during trend confirmations or reversals can enhance the reliability of signals generated by these indicators.
Volume Price Trend indicator (VPT)
The Volume Price Trend (VPT) indicator in MetaTrader analyzes the relationship between price and volume, aiming to reveal the strength and direction of a price trend. It factors in volume changes, deeming rising prices accompanied by increasing volume indicative of a strong trend. VPT is inherently volume-centric, emphasizing the significance of volume in validating price movements. Traders carefully observe divergences between price trends and volume trends for potential signals of trend continuation or reversal, making it a valuable tool for comprehensive market analysis.
Top 3 tips to trade with MetaTrader's volume indicator
Confirm trends with volume
Traders can utilize the MetaTrader volume indicator to confirm price trends. When a currency pair experiences a notable price movement in conjunction with an increase in trading volume, it suggests strong market participation and supports the validity of the trend. For instance, a rising price accompanied by rising volume signifies a strong uptrend, enhancing confidence in trend analysis. Conversely, be cautious if volume fails to align with the prevailing trend, potentially indicating weakening momentum or potential trend reversals.
Watch for divergences
When using MetaTrader's volume indicator, keep a keen eye on divergences between price movements and volume trends. Divergences occur when the price and volume move in opposite directions. For instance, if prices rise but volume declines, it could indicate a weakening trend. Conversely, rising volume amidst a price decline might suggest a potential reversal. Divergence analysis provides valuable insights into potential shifts in market sentiment, helping traders make more informed decisions.
Validate breakouts with volume
When identifying breakout opportunities using MetaTrader's volume indicator, focus on confirming breakouts with substantial trading volume. A breakout accompanied by high volume suggests increased market interest and conviction in the new price direction. This confirmation helps differentiate between genuine breakouts and false signals, reducing the risk of entering trades based on misleading price movements. Additionally, consider using technical analysis tools alongside volume analysis to enhance the overall reliability of breakout signals.
How to trade with the MT volume indicator
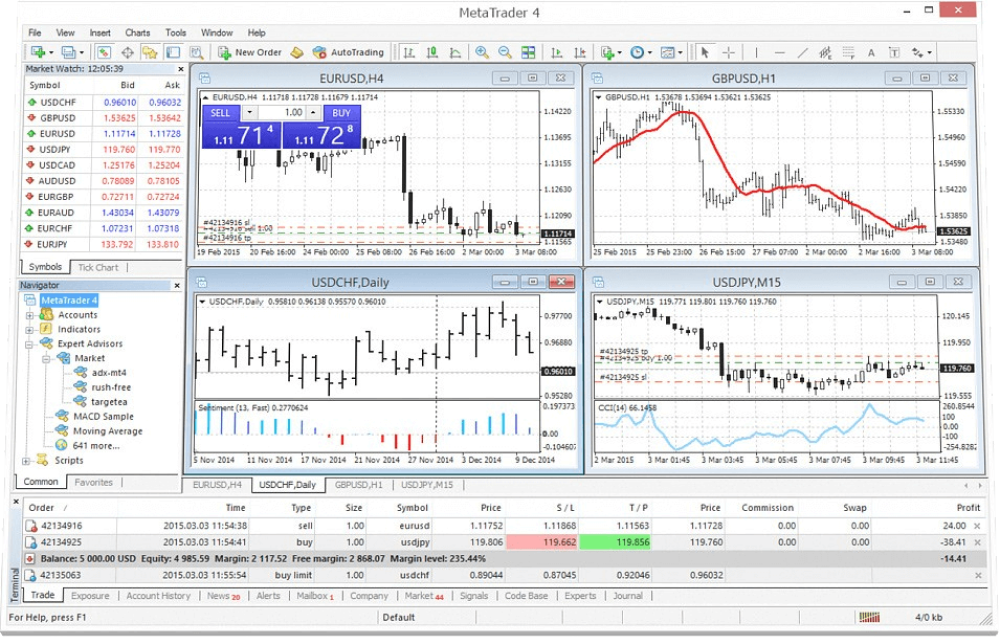
Open MetaTrader platform
Launch MetaTrader 4 or 5 on the device and log in to the trading account.
Choose a currency pair and timeframe
Select a specific currency pair one wishes to trade and choose an appropriate timeframe, such as 1-hour or 4-hour, for a detailed analysis of price movements.
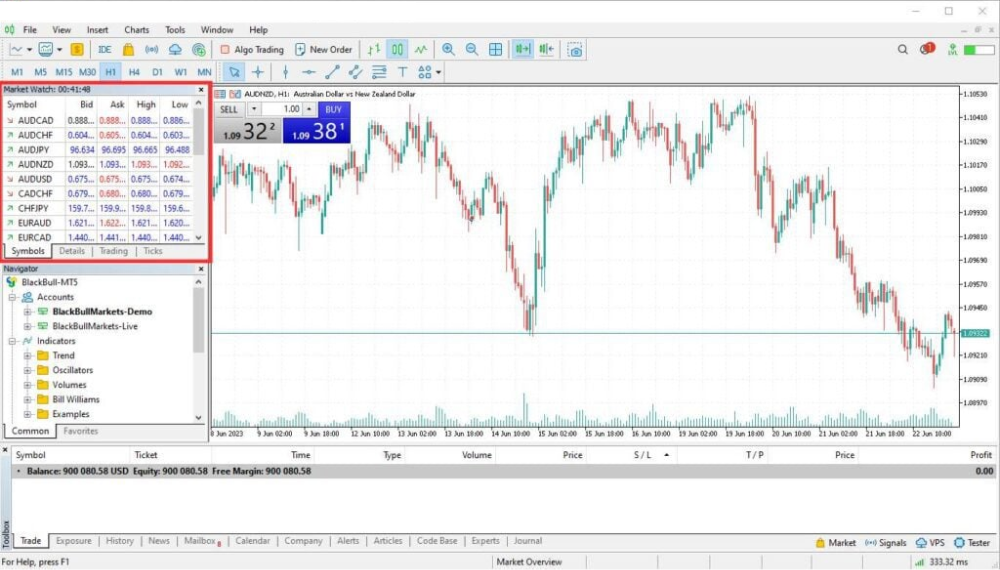
Add the volume indicator
Access the Navigator window on the left side of the platform. Locate the Volumes indicator under the Indicators' section. Drag and drop the indicator onto the price chart for the chosen currency pair.
Analyze the volume indicator
Observe the volume bars that now appear on the chart. Green bars signify higher volume during the current candle than the previous one, indicating increased market activity, signaling traders to place long orders. Conversely, red bars indicate lower volume, suggesting a potential decrease in market interest, signaling traders to place short orders.
Use the information in trading
Incorporate volume analysis into the trading decisions. Confirm the direction of trends by aligning volume trends with price movements. Higher volume during upward price trends validates bullish momentum, while lower volume during downtrends can affirm bearish sentiment.
Combine with other indicators
Enhance the analysis by combining the MetaTrader volume indicator with other technical indicators available on the platform. For example, use the Moving Average or Relative Strength Index (RSI) alongside volume data to better understand market conditions.
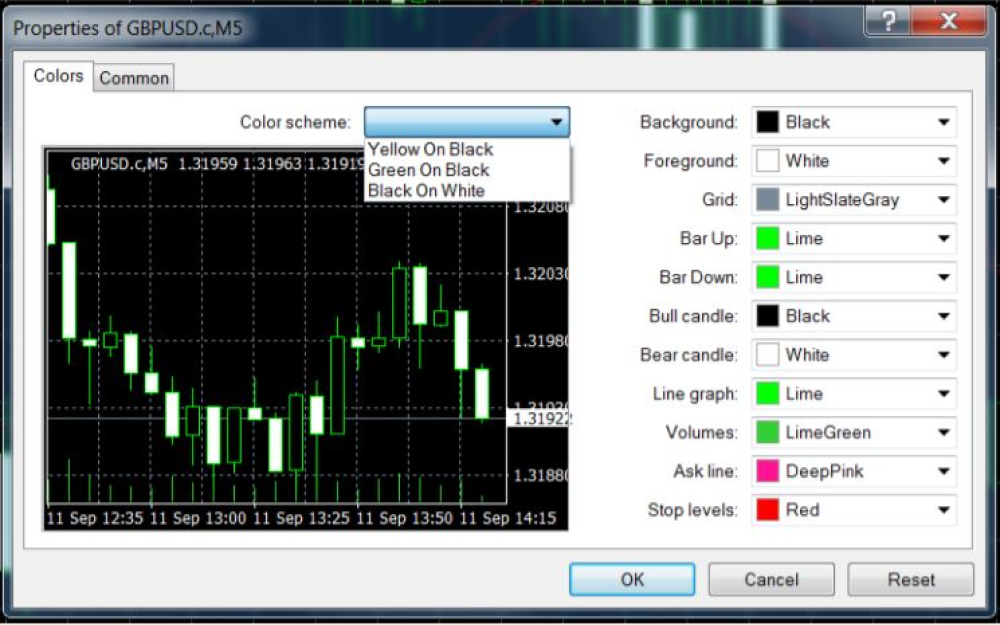
Adjust MetaTrader settings and preferences
Customize the appearance of the MetaTrader volume indicator based on specific preferences. Right-click on the chart, select Indicators List, then choose Volumes. From here, traders can modify settings, such as changing the color of volume bars, to align with their visual preferences.
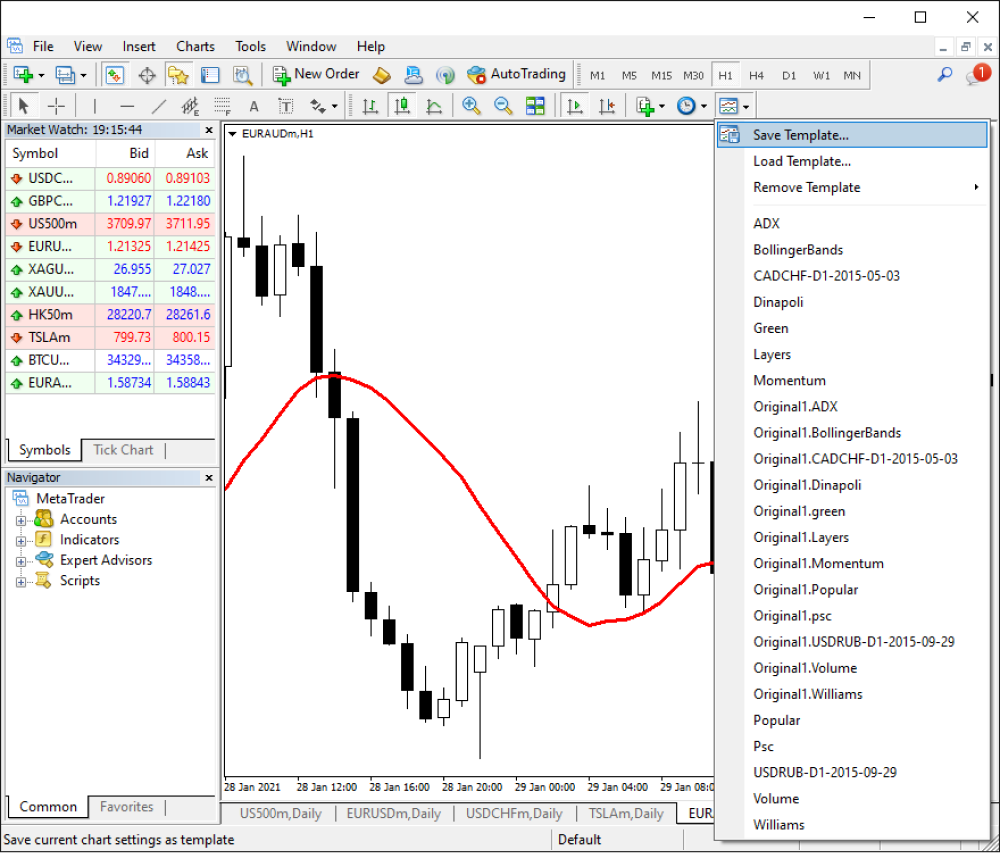
Save and analyze
Saving the chart ensures that the preferred MetaTrader volume indicator settings and configurations are readily available for subsequent analysis and trading sessions. To save, right-click on the chart, select Templates, and choose Save Template.
Using the MetaTrader volume indicator for informed trading decisions
MetaTrader's forex volume indicator, though invaluable for confirming trends and guiding trade decisions, faces challenges due to the decentralized nature of the forex market. Traders benefit from enhanced market insights but must navigate limitations inherent in volume data availability, ensuring a nuanced and informed approach to trading.
Disclaimer: All material published on our website is intended for informational purposes only and should not be considered personal advice or recommendation. As margin FX/CFDs are highly leveraged products, your gains and losses are magnified, and you could lose substantially more than your initial deposit. Investing in margin FX/CFDs does not give you any entitlements or rights to the underlying assets (e.g. the right to receive dividend payments). CFDs carry a high risk of investment loss.